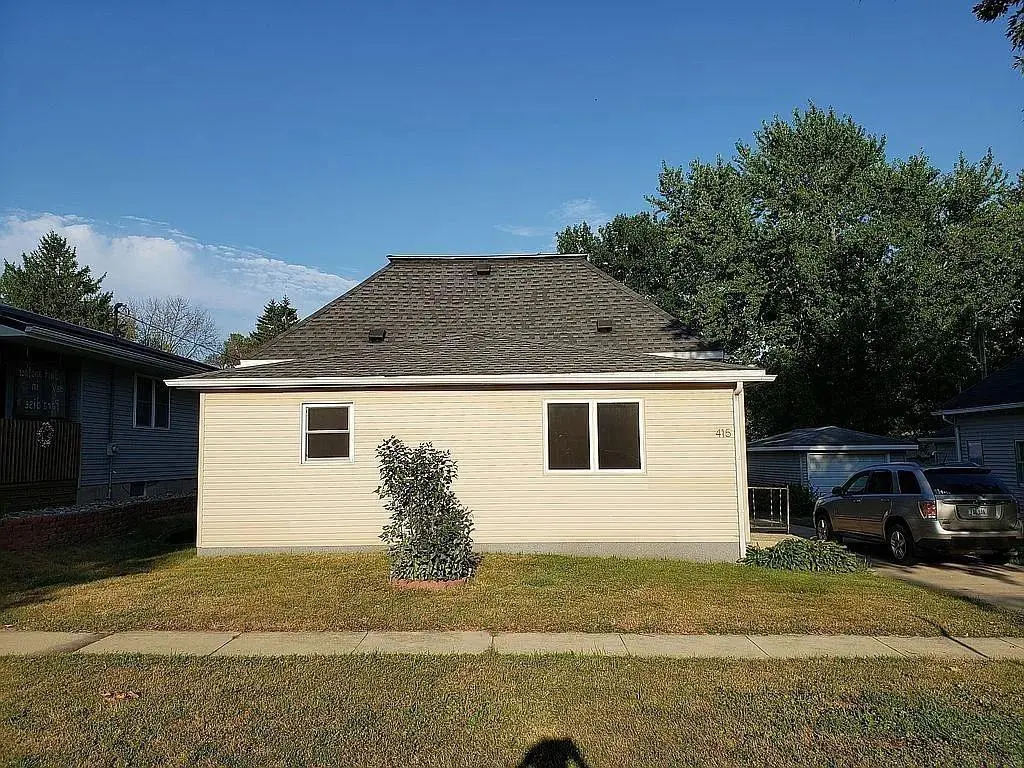
415 2nd Ave Ave NE · Oelwein, IA
Flood risk 1/10 · Minimal
- FEMA flood zone
- X (unshaded)
- Chance of flooding over 30 yrs
- 0.0%
- Est. flood insurance / yr
- $507 – $1,088
Fire risk 4/10 · Minor
- Est. fire insurance / yr
- $902 – $1,676
Heat risk 2/10 · Minimal
- Hot days now (above 100°F)
- 7 days/yr
- Hot days in 30 yrs
- 15 days/yr
Wind risk 2/10 · Minimal
- Chance of severe wind over 30 yrs
- —
Air-quality risk 1/10 · Minimal
- Unhealthy air days now
- 0 days/yr
- Unhealthy air days in 30 yrs
- 0 days/yr
Risk factors via First Street. Map © Google.
Why this score? — see what drove the C- grade
The composite is a weighted blend of 9 inputs, each scored 0–100. Each bar is that input's sub-score; the figure is the points it added to the 100-point composite (weight × sub-score).
- ARV discount +15.0/15.0
- Cash flow +14.8/30.0
- DSCR +4.5/10.0
- Schools +4.3/10.0
- Livability +3.8/5.0
- 1% rule +3.7/10.0
- Rent growth +2.5/5.0
- Condition / age +2.5/5.0
- Appreciation +0.0/10.0
$74,900
🖨 Deal sheet (PDF) 📄 Offer letter ✓ Due diligence
Listing remarks
Attractive 3 bedroom, 1 bath, all in one level, in a desirable neighborhood. Setup is perfect for a 1st time homeowner or retiree. Beautiful backyard with a very nice 2 stall detached garage. Has a some nice updates with paint, flooring and newer windows. Rooms including kitchen and bathrooms are spacious. No basement, on cement slab. Call soon for your personal showing. (More pictures to come)
Key facts
- 7,000 sq ft lot
- Garage
- Built 1907
Property features AI
Finance
- Other: Zoning: R-1
- HOA & community: Homeowners association with monthly fee
Exterior
- Parking: Has carport (2 spaces); Detached garage with garage door opener
- Utilities: Public water; Public sewer
- Home design: Single-family residence; 1 story
- Construction: Vinyl siding; Shingle (asphalt) roof
- Exterior features: Concrete and paved road access
Interior
- Kitchen: Cooktop; Refrigerator
- Bathrooms: 1 full bathroom
- Heating & cooling: Forced air heating (natural gas); Ceiling fan(s) for cooling
- Interior features: Cooktop; Refrigerator; Electric water heater; Ceiling fan(s); No fireplace
- Laundry & utility: Laundry on lower level; Electric water heater
Neighborhood map
What this means for you Summary
Snapshot
- This is a 3-bed/1.0-bath single-family listed at $75k.
Deal economics
- At list price, monthly cash flow is $21 ($254/yr) — positive.
- The deal already cash-flows at list — no discount required.
- To meet the 1% rule (rent ≥ 1% of price), the offer needs to be $65k (13.2% below list).
- Recommended offer: $65k (13.2% below list) — sets the bar for 1% rule.
- Cap rate 6.6% vs local median 4.5% in Oelwein — top-decile yield for the area; either an underpriced asset or a hidden risk that comps aren't pricing in. Stress-test before assuming the spread holds.
Location & tenants
- Location reads 76/100 on livability (#186 in IA, #3,329 nationally) — a middle-class / working-renter tenant base. Strengths: cost of living A+, housing A+, health & safety A+; Watch: employment D, amenities F, commute F.
- Oelwein Community School District (town): math 47% / reading 55% proficiency, ranked #281 of 289 in IA (top 97%) — acceptable for families but not a draw, mixed tenant base, ~2y average lease.
- Zoned schools: Wings Park Elementary School (math 52% / reading 47%, grade D, #514 of 616 statewide, top 85%, 345 students, 64% FRL); Oelwein Middle School (math 44% / reading 54%, grade C-, #219 of 246 statewide, top 90%, 359 students, 60% FRL); Oelwein High School (math 46% / reading 62%, grade C-, #293 of 336 statewide, top 87%, 314 students, 46% FRL).
- Market conditions: 60 active listings in the ZIP; 1 comparable units currently listed for rent nearby; 8 units permitted in Fayette County in 2024 (0 in 5+ unit buildings).
Forward outlook
- Local home prices are declining (-3.0%/yr); year-one equity from $518 of loan paydown is wiped out by about $2k of value loss. Plan a longer hold.
- Fayette County population projected at -15% by 2050 — secular population decline; favor cash flow + early exit over multi-decade hold.
Negotiation context
- It's been on market 24 days — a 2% lower offer ($74k) is reasonable based on typical stale-listing flexibility.
- Current owner paid $28k; list at $75k implies a 168% gain — meaningful room to come down on a strong offer.
Risks & watch-outs
- Watch-outs: built in 1907 — expect roof / HVAC / electrical / plumbing capex.
Questions for the listing agent
- Built in 1907 — when were the roof, HVAC, electrical panel, plumbing, and water heater last replaced?
- Is there a deadline driving the sale (1031 exchange, divorce, estate, relocation)? That informs how much negotiation room exists.
- What's the average days-on-market for RENTAL listings here right now (not sales)? A rising rental-DOM trend means longer vacancies and softer asking-rent achievability than the comps imply.
- What's the recent tenant-quality profile in this submarket — average credit score on applications, eviction rate, late-payment / NSF rate, and stable-employment percentage? A property-management company in the area should have these aggregated.
- How much new for-sale + rental construction is in the pipeline within 1–3 miles? Heavy new supply typically softens prices + rents 12–24 months out; constrained supply supports both.
Investment metrics
- 1% rule
- 0.87% ✗
- Cap rate
- 6.63%
- Cash-on-cash
- 1.21%
- DSCR
- 1.05
- GRM
- 9.6
CMA / ARV
- ARV (on-the-fly)
- $90,692
- Comps found
- 12
Show comp detail 12 sales within ~0.75 mi
| Address | Dist | Beds/Ba | Sqft | Sold | Price | $/sf | Match |
|---|---|---|---|---|---|---|---|
| 205 NE 4th Ave | 0.21mi | 3/1.0 | 1,192 (+4%) | 0mo | $59,900 | $50 | 84 |
| 525 2nd Ave Ave NW | 0.34mi | 3/1.0 | 1,120 (-2%) | 11mo | $50,000 | $45 | 71 |
| 906 N Frederick Ave | 0.46mi | 3/2.0 | 1,140 (-1%) | 4mo | $65,000 | $57 | 70 |
| 413 4th Ave Ave NE | 0.12mi | 3/1.0 | 1,306 (+14%) | 2mo | $175,000 | $134 | 70 |
| 811 NE 1st Ave | 0.26mi | 3/1.0 | 1,262 (+10%) | 6mo | $45,000 | $36 | 67 |
| 32 6th St. St NW | 0.25mi | 3/2.0 | 1,256 (+9%) | 4mo | $118,000 | $94 | 65 |
| 23 4th St NW | 0.21mi | 4/1.5 (+1) | 1,234 (+8%) | 8mo | $98,000 | $79 | 64 |
| 830 NE 2nd Ave | 0.30mi | 3/1.0 | 1,260 (+10%) | 9mo | $113,000 | $90 | 62 |
| 505 6th St St NE | 0.27mi | 3/1.5 | 1,008 (-12%) | 10mo | $159,900 | $159 | 57 |
| 514 NW 5th Ave | 0.56mi | 3/1.5 | 1,260 (+10%) | 4mo | $87,000 | $69 | 52 |
| 316 3rd Ave SE | 0.73mi | 3/2.0 | 1,198 (+4%) | 10mo | $143,000 | $119 | 46 |
| 300 SE 6th Ave | 0.72mi | 2/1.0 (-1) | 1,286 (+12%) | 7mo | $97,900 | $76 | 35 |
Match score weights: distance 35% · size 25% · config 20% · recency 20%. Top-matched comps best support the ARV.
Projected returns pro-forma
-3.0% appreciation · 3.0% rent growth · sell at horizon
- IRR
- -14.4%
- Equity multiple
- 0.49×
- Total profit
- $-10,794
- Equity at exit
- $11,168
- IRR
- -5.7%
- Equity multiple
- 0.63×
- Total profit
- $-7,686
- Equity at exit
- $6,476
Cash invested: $20,972 (down + closing). Projections, not guarantees.
Landlord ↔ Tenant lean methodology
- Overall (STATE)
- 83 Strongly Landlord-Friendly
- State Iowa
- 83 Strongly Landlord-Friendly · R+6
- County
- — inherits STATE
- City
- — inherits STATE
ZIP-level market 50662
- Home prices YoY
- -21.7%
- Active inventory
- 60
- Price-to-rent
- 9.6×
Monthly cashflow live
- Estimated rent
- $650 medium interval (Pro) →
- Mortgage (P&I)
- −$393
- Tax from tax record
- −$68 /mo · $820/yr
- Insurance
- −$31
- HOA
- −$0
- Vacancy / Maint / Mgmt
- −$136
- Net cashflow
- $21
Break-even live
Sensitivity live
| Price | -10% $64 | -5% $42 | +0% $21 | +5% $0 | +10% $-21 |
|---|---|---|---|---|---|
| Rent | -10% $-30 | -5% $-5 | +0% $21 | +5% $47 | +10% $73 |
| Rate | -1.0pp $59 | -0.5pp $40 | base $21 | +0.5pp $2 | +1.0pp $-18 |
UW: 25.0% down · 7.5% · 30yr · 1.5% tax · 5.0% vac · 8.0% maint · 8.0% mgmt
Financing live
Cash to close
- Down payment
- $18,725
- Closing costs
- $2,247
- Reserves months
- —
- Total cash needed
- —
Loan-product check · same deal, 3 products live
Conventional
25% down · 7.5% · 30yr
- Down + closing
- —
- Monthly P&I
- —
- Monthly cashflow
- —
- DSCR
- —
- Eligible?
- —
Personal DTI + credit; lowest rate.
DSCR
20% down · 8.5% · 30yr
- Down + closing
- —
- Monthly P&I
- —
- Monthly cashflow
- —
- DSCR
- —
- Eligible?
- —
No personal income docs; deal must DSCR.
Hard money
10% down · 12.0% · 12mo
- Down + closing
- —
- Monthly P&I
- —
- Monthly cashflow
- —
- DSCR
- —
- Eligible?
- —
Short-term bridge; refi at stabilization.
Rent comps 1 comps
| Address | Beds | Baths | Sqft | Rent | $/sqft | DOM | Units | Dist |
|---|---|---|---|---|---|---|---|---|
| 9 N Frederick Ave Apt 1 Oelwein, IA | 2.0 | 1.0 | 1125 | $650 | $0.58 | 45d | 1 | 0.38mi |
Listing history 19 events
-
2026-06-21days on market $74,900 Active 24 DOM
-
2026-06-21days on market $74,900 Active 23 DOM
-
2026-06-18days on market $74,900 Active 21 DOM
-
2026-06-17days on market $74,900 Active 20 DOM
-
2026-06-16days on market $74,900 Active 19 DOM
-
2026-06-15days on market $74,900 Active 18 DOM
-
2026-06-13days on market $74,900 Active 16 DOM
-
2026-06-12days on market $74,900 Active 15 DOM
-
2026-06-09days on market $74,900 Active 12 DOM
-
2026-06-08days on market $74,900 Active 11 DOM
-
2026-06-07days on market $74,900 Active 10 DOM
-
2026-06-07days on market $74,900 Active 9 DOM
-
2026-06-04days on market $74,900 Active 6 DOM
-
2026-06-02days on market $74,900 Active 5 DOM
-
2026-06-01days on market $74,900 Active 4 DOM
-
2026-05-31days on market $74,900 Active 3 DOM
-
2026-05-31days on market $74,900 Active 2 DOM
-
2026-05-27$74,900 Active
-
2020-11-19soldstatus $28,000
ⓘ Source: listings_history table (triggers on properties + properties_extension) + one-shot
backfill from property_details.listing_events for pre-trigger history.
Tax reassessment forecast IA · Partial reset (capped growth)
- Current annual tax
- $820 · $68/mo
- Projected year-2 tax
- $998 · $83/mo
- Expected delta
- +$178/yr (+$15/mo · 21.7%)
ⓘ Screening estimate from a state-policy table — verify with the county assessor before closing.
Climate risk First Street
- Flood 1/10 Low FEMA zone X (unshaded) · 0% chance over 30 yrs
- Wildfire 4/10 Moderate
- Heat 2/10 Low 7 d/yr ≥100°F today · 15 d/yr by 30 yrs out
- Wind 2/10 Low
- Air quality 1/10 Low 0 unhealthy d/yr today · 0 by 30 yrs out
Nearby sold comps map
Loading sold comps map…
Walkable amenities ~0.75 mi
Loading nearby amenities…
Taxation est. · year 1
- Rental income
- $7,800
- − Mortgage interest
- −$4,196
- − Property taxes
- −$820
- − Insurance
- −$374
- − Repairs & maintenance
- −$624
- − Management
- −$624
- − Depreciation
- −$2,179
- Taxable loss
- −$1,017
- Est. tax savings @ 24.0%
- +$244
- After-tax cash flow
- $498/yr
For passive investors: Depreciation is non-cash, so a rental often shows a tax loss while cash-flowing — sheltering income. Rental losses are passive: they offset passive income freely, and up to $25,000/yr can offset ordinary (W-2) income if you actively participate and your MAGI is under $100k (phasing out to $0 by $150k); unused losses carry forward. On sale, claimed depreciation is recaptured at up to 25%, and gains may owe capital-gains tax (a 1031 exchange can defer both). Figures are a year-1 estimate at your 24.0% rate — not tax advice; consult a CPA.
Schools (NCES district)
- District
- Oelwein Community School District
- NCES district ID
- 1921630
- Math proficiency
- 47% ▼ -5.00%
- Reading proficiency
- 55% ▲ 5.00%
- Median HH income
- $39,812
- Composite
- 42.61/100
- National rank
- #3189
- State rank
- #281 of 289 in IA
Livability — Oelwein
- Score
- 76/100
- State rank
- #186
- US rank
- #3329
Category grades
Schools grade is shown separately in the Schools card above.
Census & demographics
- Census place
- Oelwein, IA
- Population (ZIP)
- 6,497
Population outlook (Fayette County) Hauer SSP2
- Today (2025)
- 19,299 people
- By 2030
- 18,701 · -3.1%
- By 2040
- 17,469 · -9.5%
- By 2050
- 16,389 · -15.1%
- By 2075
- 15,156 · -21.5%
- By 2100
- 14,214 · -26.3%
Race, ethnicity, and origin ACS 2023
- Neighborhood character
- Predominantly White (90%)
- Race & ethnicity
- White 90% Two or more races 5% Hispanic / Latino 3% Native American 1%
- Common ancestry
- Italian 3% Portuguese 3% Lithuanian 2%
- Foreign-born
- 0%
- Languages at home
- 99% English-only · Spanish 1%
Political lean MEDSL · Fayette
- 2024 margin
- Solid R (+30.5) · D 34.0% · R 64.4% · Other 1.6%
- 2008→2024 swing
- -47.1pp toward R · 2008: 16.6pp · 2024: -30.5pp
- All cycles
- 2024: R+30.5 2020: R+22.7 2016: R+19.6 2012: D+11.9 2008: D+16.6
Not yet ingested
- Civics
- —
Market trends
- HPI YoY
- ▼ -49.26%
- Current HPI
- 177.9399
- Rent YoY
- —
- Metro
- —
- State GDP YoY
- ▲ 2.48%
- F500 in state
- 4
Industry mix (Fortune 500 HQ in IA)
| Industry | F500 HQs | Revenue |
|---|---|---|
| Financial Services | 1 | $16B |
|
||
| Retail / Convenience | 1 | $15B |
|
||
Price history
+167.5% since first listed2 events — show timeline
- 2026-05-27 Listed $74,900 NEIRBR as distributed by MLS GRID
- 2020-11-19 Sold (Public Records) $28,000 Public Records
Property tax history
+5.7%/yrLatest (2025): $820 · -17.7% YoY. Source: county tax records.
Cash-flow waterfall
monthlySold comps — $/sqft
last 12 mo · ≤1 miLoading sold comps…