 6-Plex
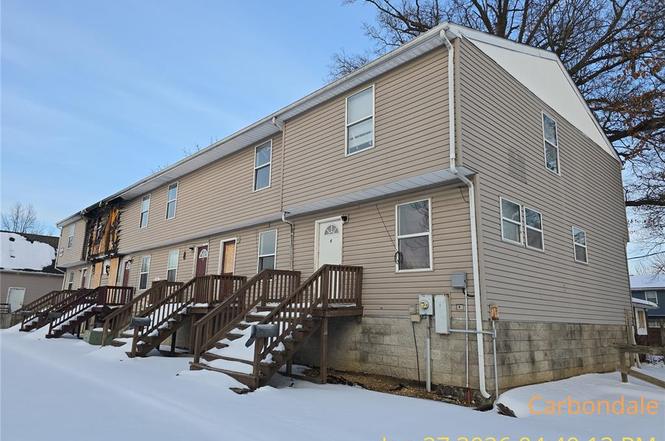
519 Rawlings · Carbondale, IL
Flood risk No data
- FEMA flood zone
- —
- Chance of flooding over 30 yrs
- —
- Est. flood insurance / yr
- —
Fire risk No data
- Est. fire insurance / yr
- —
Heat risk No data
- Hot days now (above threshold)
- —
- Hot days in 30 yrs
- —
Wind risk No data
- Chance of severe wind over 30 yrs
- —
Air-quality risk No data
- Unhealthy air days now
- —
- Unhealthy air days in 30 yrs
- —
Risk factors via First Street. Map © Google.
Why this score? — see what drove the B- grade
The composite is a weighted blend of 9 inputs, each scored 0–100. Each bar is that input's sub-score; the figure is the points it added to the 100-point composite (weight × sub-score).
- Cash flow +30.0/30.0
- 1% rule +10.0/10.0
- DSCR +10.0/10.0
- ARV discount +7.5/15.0
- Rent growth +3.6/5.0
- Livability +3.5/5.0
- Condition / age +2.5/5.0
- Schools +2.4/10.0
- Appreciation +0.0/10.0
$114,500
🖨 Deal sheet 📄 Offer letter ✓ Due diligence
Multi-family units
County records classify this as Multi-Family (5+ Unit). Listing-text estimate: 6 units. confirmed
5+ unit building — per-unit beds/baths from public records are typically unavailable; the breakdown below (if shown) is an estimate from the listing text.
Listing remarks
Prime Investment Opportunity: 6-Unit Multi-Family Building Near SIU Campus – 519 S Rawlings St, Carbondale, ILDiscover this spacious 6-unit rental complex ideally situated just steps from Southern Illinois University Carbondale (SIU), in one of the most sought-after student housing areas in town. Perfect for investors seeking high-demand rental income from university students and faculty, this property offers excellent proximity to campus, making it a turnkey candidate for restoration and strong long-term returns. Key Features:6 total units in a large, well-established multi-family building (built circa 1987). Unit mix includes:2 larger units: 4 bedrooms / 3 bathrooms each – ide
Key facts
- High occupancy area
- Near siu campus
- Built 1987
Tags
Property features AI
Finance
- Other: Seller may consider concessions; Address: 519 Rawlings, Carbondale, IL 62901
Exterior
- Home design: Residential income property
- Construction: Frame construction
Interior
- Bedrooms: No main or upper level bedrooms listed
- Bathrooms: No main or upper level bathrooms listed
- Heating & cooling: No cooling listed
- Interior features: Basement with 8+ ft poured construction
Neighborhood map
What this means for you Summary
Snapshot
- This is a 2×4.0bd/3.0ba + 4×?bd/?ba units multifamily listed at $114k.
Deal economics
- At list price, monthly cash flow is $3k ($34k/yr) — positive. Per door: $470/mo.
- The deal already cash-flows at list — no discount required.
- Meets the 1% rule at list price ($5k rent vs $114k).
- Recommended offer: $104k (9.0% below list) — sets the bar for market timing.
- Cap rate 35.8% vs local median 4.9% in Carbondale — top-decile yield for the area; either an underpriced asset or a hidden risk that comps aren't pricing in. Stress-test before assuming the spread holds.
Location & tenants
- Location reads 70/100 on livability (#375 in IL) — a middle-class / working-renter tenant base. Strengths: amenities A+, commute A+, cost of living A+; Watch: housing C-, crime F, employment F.
- Carbondale Chsd 165 (urban): math 26% / reading 35% proficiency, ranked #279 of 620 in IL (top 45%) — families likely to look elsewhere, expect single-tenant / working-renter base with shorter leases.
- Zoned schools: Carbondale Comm H S (math 26% / reading 35%, grade F, #175 of 693 statewide, top 26%, 997 students, 0% FRL).
- Market conditions: Rents rising fast (+4.5%/yr); 202 active listings in the ZIP; 1 comparable units currently listed for rent nearby; lower-income renter base — watch delinquency; 5 units permitted in Jackson County in 2024 (0 in 5+ unit buildings).
- At $4,570/mo this rent would consume 156% of the median local household income ($35k/yr) (locally 2038% of renters already pay >50% of income on rent) — very limited rent-growth headroom before tenants either downsize or default.
Forward outlook
- Local home prices are declining (-3.0%/yr); year-one equity from $792 of loan paydown is wiped out by about $3k of value loss. Plan a longer hold.
- At projected returns (-3.0% appreciation + 4.5% rent growth), your $32k cash investment doubles in ~2 years — after that, you're playing with house money.
Negotiation context
- It's been on market 118 days — a 9% lower offer ($104k) is reasonable based on typical stale-listing flexibility.
- 5 sale attempts since 5y ago; this cycle's ask has dropped $40k (26%) from the opening price — seller is motivated, your offer sets the floor, not the list.
Questions for the listing agent
- It's been on market 118 days. Have you received any prior offers? Is the seller open to a 9% concession, seller financing, or rate buy-down credit?
- Can we see the unit-by-unit rent roll, current vacancy, and any below-market leases? What's the average tenancy length?
- What capital expenditures (roof, boiler, parking lot, exteriors) have been made in the last 5 years, and what's planned in the next 2?
- Why hasn't it sold? Are there any deal-killer items the seller is aware of (foundation, flood, title, zoning, code violations)?
- Is there a deadline driving the sale (1031 exchange, divorce, estate, relocation)? That informs how much negotiation room exists.
- Schools are D-rated, which usually means shorter tenancies and higher turnover. Who's the typical renter profile here, and what's been the actual vacancy rate?
- Crime grade is F in this area — have there been break-ins, vandalism, or insurance claims at this property in the last 3 years? What carrier currently insures it and at what premium?
- What's the average days-on-market for RENTAL listings here right now (not sales)? A rising rental-DOM trend means longer vacancies and softer asking-rent achievability than the comps imply.
- What's the recent tenant-quality profile in this submarket — average credit score on applications, eviction rate, late-payment / NSF rate, and stable-employment percentage? A property-management company in the area should have these aggregated.
- How much new apartment / multifamily construction is in the pipeline within 1–3 miles? Heavy new supply (>2% of stock underway) typically softens rents 12–24 months out; light construction supports rent growth.
Investment metrics
- 1% rule
- 3.99% ✓
- Cap rate
- 35.84%
- Cash-on-cash
- 105.52%
- DSCR
- 5.69
- GRM
- 2.1
CMA / ARV
No comps found within radius.
Show comp detail 11 sales within ~0.75 mi
| Address | Dist | Beds/Ba | Sqft | Sold | Price | $/sf | Match |
|---|---|---|---|---|---|---|---|
| 701 S Rawlings St | 0.09mi | 3/3.0 (-1) | — | 4mo | $86,400 | — | 75 |
| 403 W Elm St St | 0.22mi | 4/4.0 | — | 5mo | $30,000 | — | 69 |
| 313 W Cherry St | 0.21mi | 5/2.0 (+1) | — | 2mo | $89,900 | — | 67 |
| 406 W Walnut St | 0.25mi | 4/2.0 | — | 11mo | $130,000 | — | 63 |
| 408 S Washington St | 0.44mi | 5/3.0 (+1) | 2,670 | 9mo | $15,000 | $6 | 55 |
| 1207 W Freeman St | 0.41mi | 4/2.0 | 1,740 | 15mo | $150,000 | $86 | 52 |
| 304 E College St | 0.56mi | 5/3.0 (+1) | 1,750 | 7mo | $119,000 | $68 | 51 |
| 413 S Washington St | 0.46mi | 5/2.0 (+1) | 1,584 | 16mo | $25,000 | $16 | 44 |
| 301 N Springer St | 0.51mi | 5/3.0 (+1) | 1,633 | 21mo | $60,000 | $37 | 41 |
| 318 W Pecan St | 0.59mi | 5/4.0 (+1) | 8,819 | 20mo | $125,000 | $14 | 34 |
| 612 N Bridge St | 0.74mi | 5/2.0 (+1) | 1,476 | 13mo | $69,000 | $47 | 33 |
Match score weights: distance 35% · size 25% · config 20% · recency 20%. Top-matched comps best support the ARV.
Projected returns pro-forma
-3.0% appreciation · 4.51% rent growth · sell at horizon
- IRR
- —
- Equity multiple
- 6.24×
- Total profit
- $168,107
- Equity at exit
- $17,072
- IRR
- —
- Equity multiple
- 13.72×
- Total profit
- $407,681
- Equity at exit
- $9,900
Cash invested: $32,060 (down + closing). Projections, not guarantees.
Landlord ↔ Tenant lean methodology
- Overall (STATE)
- 43 Moderately Tenant-Leaning
- State Illinois
- 43 Moderately Tenant-Leaning · D+7
- County
- — inherits STATE
- City
- — inherits STATE
ZIP-level market 62901
- Rents YoY
- 4.5%
- Active inventory
- 202
- Price-to-rent
- 9.5×
Monthly cashflow live
- Estimated rent
- $4,570 medium interval (Pro) →
- Mortgage (P&I)
- −$600
- Tax est. 1.5%
- −$143 /mo · $1,718/yr
- Insurance
- −$48
- HOA
- −$0
- Vacancy / Maint / Mgmt
- −$960
- Net cashflow
- $2,819
Break-even live
6-unit breakdown (identical units grouped — click to expand)
| Units | Beds | Baths | Est. rent |
|---|---|---|---|
| 2× units | 4.0 | 3 | $2,002 |
| #1 | 4.0 | 3 | $1,001 |
| #2 | 4.0 | 3 | $1,001 |
| 4× units | 0 | 0 | $2,568 |
| #3 | 0 | 0 | $642 |
| #4 | 0 | 0 | $642 |
| #5 | 0 | 0 | $642 |
| #6 | 0 | 0 | $642 |
| Total (6 units) | $4,570 | ||
UW: 25.0% down · 7.5% · 30yr · 1.5% tax · 5.0% vac · 8.0% maint · 8.0% mgmt
Financing live
Cash to close
- Down payment
- $28,625
- Closing costs
- $3,435
- Reserves months
- —
- Total cash needed
- —
Loan-product check · same deal, 3 products live
Conventional
25% down · 7.5% · 30yr
- Down + closing
- —
- Monthly P&I
- —
- Monthly cashflow
- —
- DSCR
- —
- Eligible?
- —
Personal DTI + credit; lowest rate.
DSCR
20% down · 8.5% · 30yr
- Down + closing
- —
- Monthly P&I
- —
- Monthly cashflow
- —
- DSCR
- —
- Eligible?
- —
No personal income docs; deal must DSCR.
Hard money
10% down · 12.0% · 12mo
- Down + closing
- —
- Monthly P&I
- —
- Monthly cashflow
- —
- DSCR
- —
- Eligible?
- —
Short-term bridge; refi at stabilization.
Rent comps 1 comps
| Address | Beds | Baths | Sqft | Rent | $/sqft | DOM | Units | Dist |
|---|---|---|---|---|---|---|---|---|
| 250 S Lewis Ln Carbondale, IL | 3.0 | 1.0 | 622 | $750 | $1.20 | 43d | 1 | 1.27mi |
Listing history 29 events
-
2026-06-19days on market $114,500 Active 118 DOM
-
2026-06-18days on market $114,500 Active 117 DOM
-
2026-06-17days on market $114,500 Active 116 DOM
-
2026-06-16days on market $114,500 Active 115 DOM
-
2026-06-15days on market $114,500 Active 114 DOM
-
2026-06-14days on market $114,500 Active 112 DOM
-
2026-06-13days on market $114,500 Active 111 DOM
-
2026-06-10days on market $114,500 Active 109 DOM
-
2026-06-09days on market $114,500 Active 108 DOM
-
2026-06-08days on market $114,500 Active 107 DOM
-
2026-06-07days on market $114,500 Active 106 DOM
-
2026-06-02days on market $114,500 Active 101 DOM
-
2026-06-01days on market $114,500 Active 100 DOM
-
2026-05-31days on market $114,500 Active 99 DOM
-
2026-05-30days on market $114,500 Active 98 DOM
-
2026-03-18price $114,500
-
2026-02-21$155,000 Active
-
2024-09-03historical Under Contract
-
2024-07-19status Active
-
2024-07-19historical
-
2024-07-19historical
-
2024-06-21historical Under Contract
-
2024-06-07price
-
2024-04-18status Active
-
2024-03-21historical Under Contract
-
2024-03-01Active
-
2022-11-02historical
-
2022-11-01historical
-
2021-11-01Active
ⓘ Source: listings_history table (triggers on properties + properties_extension) + one-shot
backfill from property_details.listing_events for pre-trigger history.
Nearby sold comps map
Loading sold comps map…
Walkable amenities ~0.75 mi
Loading nearby amenities…
Taxation est. · year 1
- Rental income
- $54,840
- − Mortgage interest
- −$6,414
- − Property taxes
- −$1,718
- − Insurance
- −$572
- − Repairs & maintenance
- −$4,387
- − Management
- −$4,387
- − Depreciation
- −$3,331
- Taxable income
- $34,031
- Est. tax owed @ 24.0%
- −$8,167
- After-tax cash flow
- $25,661/yr
For passive investors: Depreciation is non-cash, so a rental often shows a tax loss while cash-flowing — sheltering income. Rental losses are passive: they offset passive income freely, and up to $25,000/yr can offset ordinary (W-2) income if you actively participate and your MAGI is under $100k (phasing out to $0 by $150k); unused losses carry forward. On sale, claimed depreciation is recaptured at up to 25%, and gains may owe capital-gains tax (a 1031 exchange can defer both). Figures are a year-1 estimate at your 24.0% rate — not tax advice; consult a CPA.
Schools (NCES district)
- District
- Carbondale Chsd 165
- NCES district ID
- 1708370
- Math proficiency
- 26% ▼ -10.00%
- Reading proficiency
- 35% ▼ -2.00%
- Median HH income
- $22,075
- Composite
- 23.92/100
- National rank
- #7787
- State rank
- #279 of 620 in IL
Livability — Carbondale
- Score
- 70/100
- State rank
- #375
- US rank
- #7806
Category grades
Schools grade is shown separately in the Schools card above.
Census & demographics
- Census place
- Carbondale, IL
- County
- Jackson County · 22,946 people
- City population
- 22,946
- Metro
- Carbondale-Marion, IL
- Population (ZIP)
- 22,946
- Household income
- $35,089
- Rent vs Own
- Severe rent burden
- 2038.0
Population outlook (Jackson County) Hauer SSP2
- Today (2025)
- 59,093 people
- By 2030
- 59,628 · +0.9%
- By 2040
- 59,495 · +0.7%
- By 2050
- 58,811 · -0.5%
- By 2075
- 57,683 · -2.4%
- By 2100
- 55,337 · -6.4%
Race, ethnicity, and origin ACS 2023
- Neighborhood character
- Diverse neighborhood (Simpson 0.58)
- Race & ethnicity
- White 59% Black 26% Asian 6% Hispanic / Latino 5% Two or more races 5%
- Hispanic origin (detail)
- Mexican 4%
- Common ancestry
- Romanian 2% Italian 2% Slovak 2%
- Foreign-born
- 9% · Canada, China, South Korea
- Languages at home
- 87% English-only · Other Indo-European 4% Spanish 4% Arabic 2%
Political lean MEDSL · Jackson
- 2024 margin
- Toss-up / Even · D 51.0% · R 47.5% · Other 1.4%
- 2008→2024 swing
- -18.3pp toward R · 2008: 21.8pp · 2024: 3.5pp
- All cycles
- 2024: D+3.5 2020: D+1.3 2016: D+3.0 2012: D+10.3 2008: D+21.8
Not yet ingested
- Civics
- —
Market trends
- HPI YoY
- ▼ -75.62%
- Current HPI
- 88.7209
- Rent YoY
- ▲ 4.51%
- Metro
- Carbondale-Marion, IL
- State GDP YoY
- ▲ 1.59%
- F500 in state
- 60
Industry mix (Fortune 500 HQ in IL)
| Industry | F500 HQs | Revenue |
|---|---|---|
| Insurance | 4 | $201B |
|
||
| Consumer Goods | 4 | $87B |
|
||
| Industrial Machinery | 3 | $64B |
|
||
| Healthcare | 2 | $55B |
|
||
| Retail / Pharmacy | 1 | $148B |
|
||
| Agriculture / Food | 1 | $86B |
|
||
Price history
-26.1% since first listed14 events — show timeline
- 2026-03-18 Price Changed $114,500 MARIS as Distributed by MLS Grid
- 2026-02-21 Listed $155,000 MARIS as Distributed by MLS Grid
- 2024-09-03 Contingent — RMLSA as Distributed by MLS Grid
- 2024-07-19 Relisted — RMLSA as Distributed by MLS Grid
- 2024-07-19 Listing Removed — MRED as Distributed by MLS Grid
- 2024-07-19 Listing Removed — RMLSA as Distributed by MLS Grid
- 2024-06-21 Contingent — RMLSA as Distributed by MLS Grid
- 2024-06-07 Price Changed — RMLSA as Distributed by MLS Grid
- 2024-04-18 Relisted — RMLSA as Distributed by MLS Grid
- 2024-03-21 Contingent — RMLSA as Distributed by MLS Grid
- 2024-03-01 Listed — RMLSA as Distributed by MLS Grid
- 2022-11-02 Listing Removed — RMLSA as Distributed by MLS Grid
- 2022-11-01 Listing Removed — MRED as Distributed by MLS Grid
- 2021-11-01 Listed — RMLSA as Distributed by MLS Grid
Cash-flow waterfall
monthlySold comps — $/sqft
last 12 mo · ≤1 miLoading sold comps…