 🏷️ Likely Rental
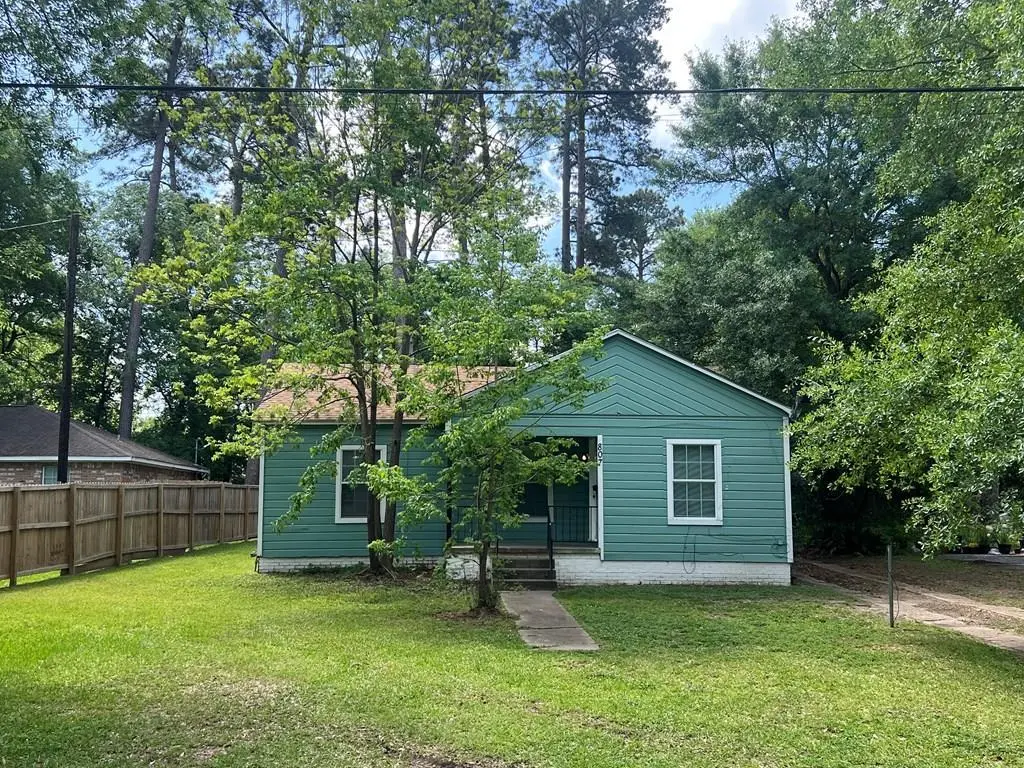
807 Jordan Ave #807 · Lufkin, TX
Flood risk 1/10 · Minimal
- FEMA flood zone
- X (unshaded)
- Chance of flooding over 30 yrs
- 0.0%
- Est. flood insurance / yr
- $507 – $1,088
Fire risk 3/10 · Minor
- Est. fire insurance / yr
- $1,222 – $2,270
Heat risk 8/10 · Major
- Hot days now (above 110°F)
- 7 days/yr
- Hot days in 30 yrs
- 25 days/yr
Wind risk 8/10 · Major
- Chance of severe wind over 30 yrs
- 80.0%
Air-quality risk 1/10 · Minimal
- Unhealthy air days now
- 0 days/yr
- Unhealthy air days in 30 yrs
- 0 days/yr
Risk factors via First Street. Map © Google.
Why this score? — see what drove the B+ grade
The composite is a weighted blend of 9 inputs, each scored 0–100. Each bar is that input's sub-score; the figure is the points it added to the 100-point composite (weight × sub-score).
- Cash flow +29.0/30.0
- ARV discount +15.0/15.0
- DSCR +10.0/10.0
- 1% rule +8.1/10.0
- Condition / age +4.0/5.0
- Livability +3.6/5.0
- Schools +3.3/10.0
- Rent growth +2.5/5.0
- Appreciation +0.0/10.0
$99,000
🖨 Deal sheet (PDF) 📄 Offer letter ✓ Due diligence
Listing remarks MLS
Charming and full of character, this updated traditional wood-frame home offers a perfect blend of timeless appeal and modern improvements. Featuring 2-3 Bedrooms and 1 Full Bathroom, this home features beautiful original wood flooring and a spacious living and dining area. Recent updates include all windows replaced in 2021 and a Central HVAC system was installed in 2022, providing improved energy efficiency and year-round comfort. The home has also been freshly painted and cleaned, making it truly move-in or rental ready! Relax on the inviting covered front porch, and take advantage of the backyard storage shed for added convenience and storage space. Previously leased for $1,100 per month, this property presents a great opportunity for both homeowners and investors alike. Don't miss your chance to own this well-maintained home with classic charm and modern updates!
Key facts
- Covered front porch
- Freshly painted
- Central hvac system
Tags
Neighborhood map
What this means for you Summary
Snapshot
- This is a 3-bed/1.0-bath single-family listed at $99k. Condition is rated good.
Deal economics
- At list price, monthly cash flow is $340 ($4k/yr) — positive.
- The deal already cash-flows at list — no discount required.
- Meets the 1% rule at list price ($1k rent vs $99k).
- Recommended offer: $93k (6.0% below list) — sets the bar for market timing.
- Cap rate 10.4% vs local median 3.5% in Lufkin — top-decile yield for the area; either an underpriced asset or a hidden risk that comps aren't pricing in. Stress-test before assuming the spread holds.
Location & tenants
- Location reads 72/100 on livability (#240 in TX) — a middle-class / working-renter tenant base. Strengths: cost of living A+, housing A+, health & safety A+; Watch: crime F, commute F, employment D-.
- Lufkin ISD (town): math 39% / reading 39% proficiency, ranked #446 of 826 in TX (top 54%) — families likely to look elsewhere, expect single-tenant / working-renter base with shorter leases; 68% free/reduced lunch — lower-income household profile, screen leases tightly.
- Zoned schools: Trout Pri (252 students, 95% FRL); Lufkin Middle (math 38% / reading 38%, grade F, #717 of 1,662 statewide, top 44%, 1,487 students, 89% FRL); Lufkin H S (math 49% / reading 45%, grade D-, #591 of 1,632 statewide, top 38%, 2,135 students, 85% FRL) — zoned schools average 90% FRL vs 68% district-wide (21 pts higher); higher-poverty schools than district average — tighter screening recommended.
- Market conditions: 295 active listings in the ZIP; 5 comparable units currently listed for rent nearby; rentals lingering (median 45d on market — plan ~5-8 weeks vacancy on turnover, expect pricing pressure); 100% of comp listings sitting > 30 days — soft ceiling on asking rent; 120 units permitted in Angelina County in 2024 (0 in 5+ unit buildings).
Forward outlook
- Local home prices are declining (-3.0%/yr); year-one equity from $684 of loan paydown is wiped out by about $3k of value loss. Plan a longer hold.
- At projected returns (-3.0% appreciation + 3.0% rent growth), your $28k cash investment doubles in ~8 years — after that, you're playing with house money.
Negotiation context
- It's been on market 64 days — a 6% lower offer ($93k) is reasonable based on typical stale-listing flexibility.
Risks & watch-outs
- Watch-outs: built in 1946 — expect roof / HVAC / electrical / plumbing capex.
- Climate carrying-cost: severe wind risk, 80% chance of damaging wind over 30y; extreme-heat days projected 7→25/yr by 2055 (HVAC capex compounding) — expect insurance premiums to compound above CPI over the hold.
Questions for the listing agent
- It's been on market 64 days. Have you received any prior offers? Is the seller open to a 6% concession, seller financing, or rate buy-down credit?
- Built in 1946 — when were the roof, HVAC, electrical panel, plumbing, and water heater last replaced?
- Why hasn't it sold? Are there any deal-killer items the seller is aware of (foundation, flood, title, zoning, code violations)?
- Is there a deadline driving the sale (1031 exchange, divorce, estate, relocation)? That informs how much negotiation room exists.
- Crime grade is F in this area — have there been break-ins, vandalism, or insurance claims at this property in the last 3 years? What carrier currently insures it and at what premium?
- What's the average days-on-market for RENTAL listings here right now (not sales)? A rising rental-DOM trend means longer vacancies and softer asking-rent achievability than the comps imply.
- What's the recent tenant-quality profile in this submarket — average credit score on applications, eviction rate, late-payment / NSF rate, and stable-employment percentage? A property-management company in the area should have these aggregated.
- How much new for-sale + rental construction is in the pipeline within 1–3 miles? Heavy new supply typically softens prices + rents 12–24 months out; constrained supply supports both.
Investment metrics
- 1% rule
- 1.31% ✓
- Cap rate
- 10.41%
- Cash-on-cash
- 14.70%
- DSCR
- 1.65
- GRM
- 6.4
CMA / ARV
- ARV (median comp)
- $173,791
- List price
- $99,000
- Delta
- -43.03%
- Verdict
- UNDERPRICED
- Comps
- 4 within 1.0 mi
Projected returns pro-forma
-3.0% appreciation · 3.0% rent growth · sell at horizon
- IRR
- 5.2%
- Equity multiple
- 1.20×
- Total profit
- $5,601
- Equity at exit
- $14,761
- IRR
- 14.7%
- Equity multiple
- 2.18×
- Total profit
- $32,800
- Equity at exit
- $8,560
Cash invested: $27,720 (down + closing). Projections, not guarantees.
Landlord ↔ Tenant lean methodology
- Overall (STATE)
- 87 Strongly Landlord-Friendly
- State Texas
- 87 Strongly Landlord-Friendly · R+5
- County
- — inherits STATE
- City
- — inherits STATE
ZIP-level market 75904
- Home prices YoY
- -25.1%
- Active inventory
- 295
- Price-to-rent
- 6.4×
Monthly cashflow live
- Estimated rent
- $1,296 high interval (Pro) →
- Mortgage (P&I)
- −$519
- Tax est. 1.5%
- −$124 /mo · $1,485/yr
- Insurance
- −$41
- HOA
- −$0
- Vacancy / Maint / Mgmt
- −$272
- Net cashflow
- $340
Break-even live
Sensitivity live
| Price | -10% $408 | -5% $374 | +0% $340 | +5% $305 | +10% $271 |
|---|---|---|---|---|---|
| Rent | -10% $237 | -5% $288 | +0% $340 | +5% $391 | +10% $442 |
| Rate | -1.0pp $389 | -0.5pp $365 | base $340 | +0.5pp $314 | +1.0pp $288 |
UW: 25.0% down · 7.5% · 30yr · 1.5% tax · 5.0% vac · 8.0% maint · 8.0% mgmt
Financing live
Cash to close
- Down payment
- $24,750
- Closing costs
- $2,970
- Reserves months
- —
- Total cash needed
- —
Loan-product check · same deal, 3 products live
Conventional
25% down · 7.5% · 30yr
- Down + closing
- —
- Monthly P&I
- —
- Monthly cashflow
- —
- DSCR
- —
- Eligible?
- —
Personal DTI + credit; lowest rate.
DSCR
20% down · 8.5% · 30yr
- Down + closing
- —
- Monthly P&I
- —
- Monthly cashflow
- —
- DSCR
- —
- Eligible?
- —
No personal income docs; deal must DSCR.
Hard money
10% down · 12.0% · 12mo
- Down + closing
- —
- Monthly P&I
- —
- Monthly cashflow
- —
- DSCR
- —
- Eligible?
- —
Short-term bridge; refi at stabilization.
Rent comps 5 comps
| Address | Beds | Baths | Sqft | Rent | $/sqft | DOM | Units | Dist |
|---|---|---|---|---|---|---|---|---|
| 810 Ellis Ave Lufkin, TX | 2.0 | 1.0 | 720 | $950 | $1.32 | 45d | 1 | 0.48mi |
| 120 E Denman Ave Lufkin, TX | 2.0 | 2.0 | 985 | $1,300 | $1.32 | 45d | 1 | 0.73mi |
| 1214 Lotus Ln Lufkin, TX | 2.0 | 2.0 | 893 | $900 | $1.01 | 45d | 1 | 0.75mi |
| 300 S John Redditt Dr Lufkin, TX | 2.0 | 1.0 | 642 | $1,150 | $1.79 | 45d | 4 | 1.00mi |
| 310 Mott Rd Lufkin, TX | 1.0–2.0 | 1.0 | 806 | $988 | $1.23 | 45d | 28 | 1.35mi |
Listing history 17 events
-
2026-06-19days on market $99,000 Active 64 DOM
-
2026-06-18days on market $99,000 Active 63 DOM
-
2026-06-17days on market $99,000 Active 62 DOM
-
2026-06-16days on market $99,000 Active 61 DOM
-
2026-06-15days on market $99,000 Active 60 DOM
-
2026-06-14days on market $99,000 Active 58 DOM
-
2026-06-13days on market $99,000 Active 57 DOM
-
2026-06-10days on market $99,000 Active 55 DOM
-
2026-06-09days on market $99,000 Active 54 DOM
-
2026-06-08days on market $99,000 Active 53 DOM
-
2026-06-07days on market $99,000 Active 52 DOM
-
2026-06-03days on market $99,000 Active 48 DOM
-
2026-06-02days on market $99,000 Active 47 DOM
-
2026-06-01days on market $99,000 Active 46 DOM
-
2026-05-31days on market $99,000 Active 45 DOM
-
2026-05-30days on market $99,000 Active 44 DOM
-
2026-04-16$99,000 Active 880-char remark
Show marketing remark (880 chars)
Charming and full of character, this updated traditional wood-frame home offers a perfect blend of timeless appeal and modern improvements. Featuring 2-3 Bedrooms and 1 Full Bathroom, this home features beautiful original wood flooring and a spacious living and dining area. Recent updates include all windows replaced in 2021 and a Central HVAC system was installed in 2022, providing improved energy efficiency and year-round comfort. The home has also been freshly painted and cleaned, making it truly move-in or rental ready! Relax on the inviting covered front porch, and take advantage of the backyard storage shed for added convenience and storage space. Previously leased for $1,100 per month, this property presents a great opportunity for both homeowners and investors alike. Don't miss your chance to own this well-maintained home with classic charm and modern updates!
ⓘ Source: listings_history table (triggers on properties + properties_extension) + one-shot
backfill from property_details.listing_events for pre-trigger history.
Climate risk First Street
- Flood 1/10 Low FEMA zone X (unshaded) · 0% chance over 30 yrs
- Wildfire 3/10 Moderate
- Heat 8/10 Severe 7 d/yr ≥110°F today · 25 d/yr by 30 yrs out
- Wind 8/10 Severe 80% chance of damaging wind over 30 yrs
- Air quality 1/10 Low 0 unhealthy d/yr today · 0 by 30 yrs out
Nearby sold comps map
Loading sold comps map…
Walkable amenities ~0.75 mi
Loading nearby amenities…
Taxation est. · year 1
- Rental income
- $15,549
- − Mortgage interest
- −$5,546
- − Property taxes
- −$1,485
- − Insurance
- −$495
- − Repairs & maintenance
- −$1,244
- − Management
- −$1,244
- − Depreciation
- −$2,880
- Taxable income
- $2,656
- Est. tax owed @ 24.0%
- −$637
- After-tax cash flow
- $3,437/yr
For passive investors: Depreciation is non-cash, so a rental often shows a tax loss while cash-flowing — sheltering income. Rental losses are passive: they offset passive income freely, and up to $25,000/yr can offset ordinary (W-2) income if you actively participate and your MAGI is under $100k (phasing out to $0 by $150k); unused losses carry forward. On sale, claimed depreciation is recaptured at up to 25%, and gains may owe capital-gains tax (a 1031 exchange can defer both). Figures are a year-1 estimate at your 24.0% rate — not tax advice; consult a CPA.
Condition & rehab AI · 12 photos
This charming and updated home is move-in ready with recent improvements and a good condition score. It offers a blend of timeless appeal and modern updates, making it an attractive option for both resale and rental.
Value-add opportunities
- Both Paint the exterior siding — Enhances curb appeal and value
- Both Replace the storage shed with a larger, more modern shed — Provides additional storage and improves curb appeal
- Both Install a new front door — Improves security and enhances curb appeal
Renovation cost estimate screening
Value-add ROI direction
- Both Paint the exterior siding — Enhances curb appeal and value ↑
- Both Replace the storage shed with a larger, more modern shed — Provides additional storage and improves curb appeal ↑
- Both Install a new front door — Improves security and enhances curb appeal ↑
ⓘ Cost ranges are severity-bucket heuristics (US national rule-of-thumb). Get contractor quotes + a written scope before underwriting a rehab budget.
Schools (NCES district)
- District
- Lufkin ISD
- NCES district ID
- 4828550
- Math proficiency
- 39% ▼ -9.00%
- Reading proficiency
- 39% ▬ 0.00%
- Median HH income
- $41,009
- Composite
- 32.81/100
- National rank
- #5625
- State rank
- #446 of 826 in TX
Livability — Lufkin
- Score
- 72/100
- State rank
- #240
- US rank
- #5792
Category grades
Schools grade is shown separately in the Schools card above.
Census & demographics
- Census place
- Lufkin, TX
- County
- Angelina County · 62,696 people
- City population
- 62,696
- Metro
- Lufkin, TX
- Population (ZIP)
- 34,462
- Household income
- $60,205
- Rent vs Own
- Severe rent burden
- 1159.0
Population outlook (Angelina County) Hauer SSP2
- Today (2025)
- 90,174 people
- By 2030
- 90,697 · +0.6%
- By 2040
- 91,291 · +1.2%
- By 2050
- 91,168 · +1.1%
- By 2075
- 88,961 · -1.3%
- By 2100
- 80,590 · -10.6%
Race, ethnicity, and origin ACS 2023
- Neighborhood character
- Diverse neighborhood (Simpson 0.58)
- Race & ethnicity
- White 60% Hispanic / Latino 19% Black 16% Two or more races 12% Native American 2%
- Hispanic origin (detail)
- Mexican 17%
- Common ancestry
- Romanian 2% Slovak 1% Lithuanian 1%
- Foreign-born
- 6% · Canada
- Languages at home
- 86% English-only · Spanish 14%
Political lean MEDSL · Angelina
- 2024 margin
- Solid R (+52.0) · D 23.7% · R 75.7%
- 2008→2024 swing
- -17.0pp toward R · 2008: -35.0pp · 2024: -52.0pp
- All cycles
- 2024: R+52.0 2020: R+46.1 2016: R+47.3 2012: R+43.9 2008: R+35.0
Not yet ingested
- Civics
- —
Market trends
- HPI YoY
- ▼ -71.71%
- Current HPI
- 213.4236
- Rent YoY
- —
- Metro
- Lufkin, TX
- State GDP YoY
- ▲ 3.95%
- F500 in state
- 110
Industry mix (Fortune 500 HQ in TX)
| Industry | F500 HQs | Revenue |
|---|---|---|
| Energy | 16 | $1,198B |
|
||
| Technology | 5 | $198B |
|
||
| Engineering / Construction | 4 | $72B |
|
||
| Energy Services | 3 | $60B |
|
||
| Utilities | 3 | $41B |
|
||
| Healthcare | 2 | $330B |
|
||
Price history
1 event — show timeline
- 2026-04-16 Listed $99,000 Deep East Texas MLS
Cash-flow waterfall
monthlySold comps — $/sqft
last 12 mo · ≤1 miLoading sold comps…