 Duplex
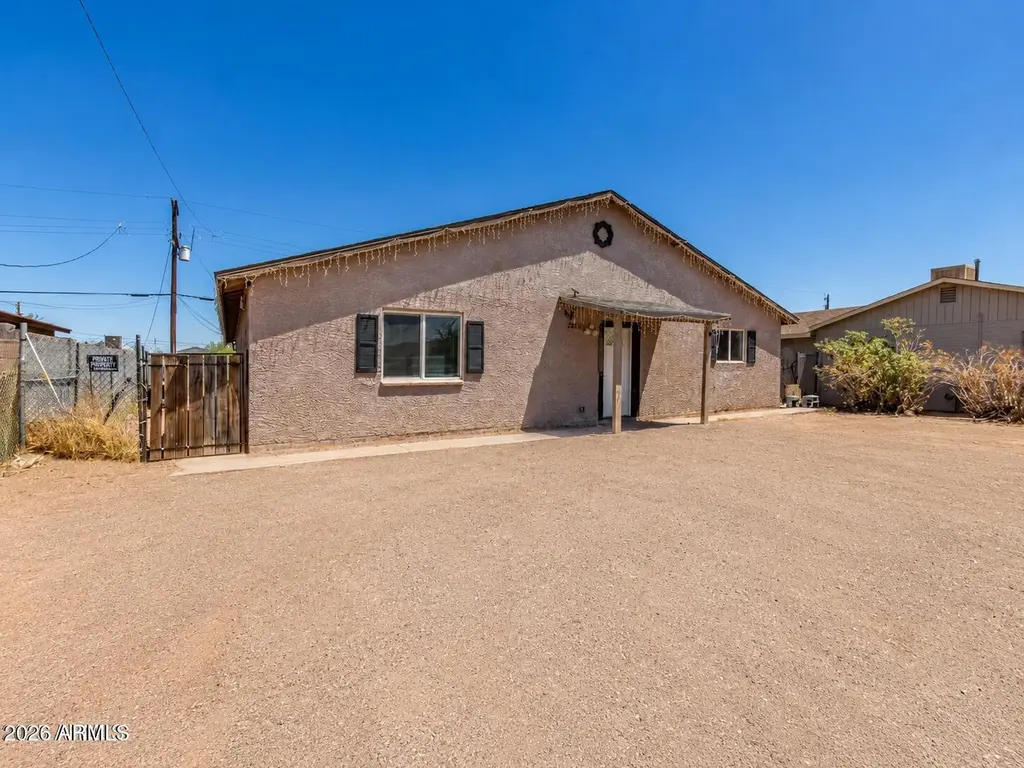
2828 E Chipman Rd · Phoenix, AZ
Flood risk 1/10 · Minimal
- FEMA flood zone
- X (shaded)
- Chance of flooding over 30 yrs
- 0.0%
- Est. flood insurance / yr
- $507 – $1,088
Fire risk 1/10 · Minimal
- Est. fire insurance / yr
- $610 – $1,132
Heat risk 9/10 · Severe
- Hot days now (above 112°F)
- 7 days/yr
- Hot days in 30 yrs
- 19 days/yr
Wind risk 1/10 · Minimal
- Chance of severe wind over 30 yrs
- —
Air-quality risk 2/10 · Minimal
- Unhealthy air days now
- 1 days/yr
- Unhealthy air days in 30 yrs
- 2 days/yr
Risk factors via First Street. Map © Google.
Why this score? — see what drove the D grade
The composite is a weighted blend of 9 inputs, each scored 0–100. Each bar is that input's sub-score; the figure is the points it added to the 100-point composite (weight × sub-score).
- Cash flow +15.7/30.0
- ARV discount +7.5/15.0
- DSCR +4.8/10.0
- Livability +3.8/5.0
- 1% rule +3.2/10.0
- Condition / age +2.5/5.0
- Rent growth +2.2/5.0
- Schools +1.0/10.0
- Appreciation +0.0/10.0
$519,999
🖨 Deal sheet 📄 Offer letter ✓ Due diligence
Multi-family units
County records classify this as Multi-Family (2-4 Unit). Listing-text estimate: 2 units. confirmed
Listing remarks MLS
Remodeled turn key duplex! Enjoy a 3 bed 2 bath home with rental potential from the separate 2 bed 1 bath space, all under one roof. Wonderful floor plan with tile flooring and picture windows. Lovely custom cabinetry in the open concept kitchen. Plush carpeting in the spacious bedrooms. Master has a walk in closet. Newly tiled showers with decorative accents
Key facts
- Ac unit replaced
- Brand new roof
- Stunning new kitchen
Tags
Property features AI
Finance
- Other: Single building on the lot
Exterior
- Parking: 4 total parking spaces (open parking)
- Utilities: Electric service: SRP; Public sewer; City franchise water
- Home design: Fee simple ownership
- Construction: Stucco and block construction; Other roof
- Exterior features: Stucco and block construction; Asphalt road access; No community pool
Interior
- Kitchen: Refrigerator; Free-standing electric oven
- Flooring: Tile flooring; Carpet flooring
- Heating & cooling: Central heating; Central air conditioning
- Interior features: Refrigerator; Free-standing electric oven
Neighborhood map
What this means for you Summary
Snapshot
- This is a 1×3bd/2ba + 1×2bd/1ba units multifamily listed at $520k.
Deal economics
- At list price, monthly cash flow is $231 ($3k/yr) — positive. Per door: $115/mo.
- The deal already cash-flows at list — no discount required.
- To meet the 1% rule (rent ≥ 1% of price), the offer needs to be $426k (18.1% below list).
- Recommended offer: $426k (18.1% below list) — sets the bar for 1% rule.
- Cap rate 6.8% vs local median 3.3% in Phoenix — top-decile yield for the area; either an underpriced asset or a hidden risk that comps aren't pricing in. Stress-test before assuming the spread holds.
Location & tenants
- Location reads 75/100 on livability (#16 in AZ, #3,924 nationally) — a middle-class / working-renter tenant base. Strengths: amenities A+, commute A+, housing A+; Watch: health & safety C-, crime F.
- Roosevelt Elementary District (4279) (urban): math 8% / reading 14% proficiency, ranked #234 of 249 in AZ (top 94%) — low school quality limits family demand, transient renter base, plan for 1-2y turnover.
- Market conditions: Rents soft (-1.2%/yr); 131 active listings in the ZIP; 7 comparable units currently listed for rent nearby; rentals leasing fast (median 2d on market — plan ~1-2 weeks tenant-placement turnaround); 36,011 units permitted in Maricopa County in 2024 (12,801 in 5+ unit buildings).
- At $4,259/mo this rent would consume 84% of the median local household income ($61k/yr) (locally 1460% of renters already pay >50% of income on rent) — very limited rent-growth headroom before tenants either downsize or default.
Forward outlook
- Local home prices are declining (-3.0%/yr); year-one equity from $4k of loan paydown is wiped out by about $16k of value loss. Plan a longer hold.
- Maricopa County population projected at +38% by 2050 — long-run rental-demand tailwind backs the buy-and-hold thesis.
Negotiation context
- It's been on market 36 days — a 3% lower offer ($504k) is reasonable based on typical stale-listing flexibility.
- 8 sale attempts since 13y ago with the ask held roughly flat each time — persistent listings suggest the price (not the market) is what's stuck; bring a comps-based counter.
- Current owner paid $184k; list at $520k implies a 183% gain — meaningful room to come down on a strong offer.
Risks & watch-outs
- Climate carrying-cost: extreme-heat days projected 7→19/yr by 2055 (HVAC capex compounding) — expect insurance premiums to compound above CPI over the hold.
Questions for the listing agent
- It's been on market 36 days. Have you received any prior offers? Is the seller open to a 18% concession, seller financing, or rate buy-down credit?
- Can we see the unit-by-unit rent roll, current vacancy, and any below-market leases? What's the average tenancy length?
- What capital expenditures (roof, boiler, parking lot, exteriors) have been made in the last 5 years, and what's planned in the next 2?
- Is there a deadline driving the sale (1031 exchange, divorce, estate, relocation)? That informs how much negotiation room exists.
- Crime grade is F in this area — have there been break-ins, vandalism, or insurance claims at this property in the last 3 years? What carrier currently insures it and at what premium?
- The area grade is low — what's the realistic commute time and amenity access for the typical tenant pool here? Any planned neighborhood developments (good or bad) we should know about?
- What's the average days-on-market for RENTAL listings here right now (not sales)? A rising rental-DOM trend means longer vacancies and softer asking-rent achievability than the comps imply.
- What's the recent tenant-quality profile in this submarket — average credit score on applications, eviction rate, late-payment / NSF rate, and stable-employment percentage? A property-management company in the area should have these aggregated.
- How much new apartment / multifamily construction is in the pipeline within 1–3 miles? Heavy new supply (>2% of stock underway) typically softens rents 12–24 months out; light construction supports rent growth.
Investment metrics
- 1% rule
- 0.82% ✗
- Cap rate
- 6.83%
- Cash-on-cash
- 1.90%
- DSCR
- 1.08
- GRM
- 10.2
CMA / ARV
No comps found within radius.
Projected returns pro-forma
-3.0% appreciation · 0.0% rent growth · sell at horizon
- IRR
- -16.3%
- Equity multiple
- 0.44×
- Total profit
- $-82,256
- Equity at exit
- $77,534
- IRR
- -13.7%
- Equity multiple
- 0.30×
- Total profit
- $-101,813
- Equity at exit
- $44,960
Cash invested: $145,600 (down + closing). Projections, not guarantees.
Landlord ↔ Tenant lean methodology
- Overall (STATE)
- 87 Strongly Landlord-Friendly
- State Arizona
- 87 Strongly Landlord-Friendly · R+3
- County
- — inherits STATE
- City
- — inherits STATE
ZIP-level market 85040
- Home prices YoY
- -28.4%
- Rents YoY
- -1.2%
- Active inventory
- 131
- Price-to-rent
- 19.4×
Monthly cashflow live
- Estimated rent
- $4,259 high interval (Pro) →
- Mortgage (P&I)
- −$2,727
- Tax from tax record
- −$190 /mo · $2,281/yr
- Insurance
- −$217
- HOA
- −$0
- Vacancy / Maint / Mgmt
- −$894
- Net cashflow
- $231
Break-even live
2-unit breakdown (identical units grouped — click to expand)
| Units | Beds | Baths | Est. rent |
|---|---|---|---|
| 1× unit | 3 | 2 | $2,234 |
| 1× unit | 2 | 1 | $2,025 |
| Total (2 units) | $4,259 | ||
UW: 25.0% down · 7.5% · 30yr · 1.5% tax · 5.0% vac · 8.0% maint · 8.0% mgmt
Financing live
Cash to close
- Down payment
- $130,000
- Closing costs
- $15,600
- Reserves months
- —
- Total cash needed
- —
Loan-product check · same deal, 3 products live
Conventional
25% down · 7.5% · 30yr
- Down + closing
- —
- Monthly P&I
- —
- Monthly cashflow
- —
- DSCR
- —
- Eligible?
- —
Personal DTI + credit; lowest rate.
DSCR
20% down · 8.5% · 30yr
- Down + closing
- —
- Monthly P&I
- —
- Monthly cashflow
- —
- DSCR
- —
- Eligible?
- —
No personal income docs; deal must DSCR.
Hard money
10% down · 12.0% · 12mo
- Down + closing
- —
- Monthly P&I
- —
- Monthly cashflow
- —
- DSCR
- —
- Eligible?
- —
Short-term bridge; refi at stabilization.
Rent comps 7 comps
| Address | Beds | Baths | Sqft | Rent | $/sqft | DOM | Units | Dist |
|---|---|---|---|---|---|---|---|---|
| 2739 E Tamarisk Ave Apt 2 Phoenix, AZ | 2.0 | 1.0 | 2880 | $1,299 | $0.45 | 1d | 1 | 0.15mi |
| 2739 E Tamarisk Ave Unit 3 Phoenix, AZ | 2.0 | 1.0 | 2880 | $1,750 | $0.61 | 1d | 1 | 0.15mi |
| 2553 E Pueblo Ave Unit 1 Phoenix, AZ | 2.0 | 1.0 | 2484 | $1,000 | $0.40 | 1d | 1 | 0.40mi |
| 2321 E Huntington Dr Phoenix, AZ | 3.0 | 2.5 | 2000 | $2,400 | $1.20 | 1d | 1 | 0.96mi |
| 3131 E Legacy Dr Phoenix, AZ | 2.0–3.0 | 2.0 | 1730 | $2,100 | $1.21 | 2d | 3 | 1.35mi |
| 3131 E Legacy Dr Phoenix, AZ | 2.0–3.0 | 2.0 | 1795 | $2,600 | $1.45 | 1d | 2 | 1.35mi |
| 3131 E Legacy Dr #2038 Phoenix, AZ | 3.0 | 2.0 | 1795 | $5,550 | $3.09 | 2d | 1 | 1.40mi |
Listing history 41 events
-
2026-06-18days on market $519,999 Active 36 DOM
-
2026-06-17days on market $519,999 Active 35 DOM
-
2026-06-16days on market $519,999 Active 34 DOM
-
2026-06-15days on market $519,999 Active 33 DOM
-
2026-06-13days on market $519,999 Active 31 DOM
-
2026-06-13days on market $519,999 Active 30 DOM
-
2026-06-09days on market $519,999 Active 27 DOM
-
2026-06-08days on market $519,999 Active 26 DOM
-
2026-06-07days on market $519,999 Active 25 DOM
-
2026-06-04days on market $519,999 Active 22 DOM
-
2026-06-03days on market $519,999 Active 21 DOM
-
2026-06-02days on market $519,999 Active 20 DOM
-
2026-06-01days on market $519,999 Active 19 DOM
-
2026-05-31days on market $519,999 Active 18 DOM
-
2026-05-14status Active
-
2026-05-12historical
-
2026-05-11$519,999 Active
-
2025-11-02historical
-
2025-08-01$519,999 Active
-
2017-03-03soldstatus $183,800 Closed 361-char remark
Show marketing remark (361 chars)
Remodeled turn key duplex! Enjoy a 3 bed 2 bath home with rental potential from the separate 2 bed 1 bath space, all under one roof. Wonderful floor plan with tile flooring and picture windows. Lovely custom cabinetry in the open concept kitchen. Plush carpeting in the spacious bedrooms. Master has a walk in closet. Newly tiled showers with decorative accents
-
2017-01-28status Pending 361-char remark
Show marketing remark (361 chars)
Remodeled turn key duplex! Enjoy a 3 bed 2 bath home with rental potential from the separate 2 bed 1 bath space, all under one roof. Wonderful floor plan with tile flooring and picture windows. Lovely custom cabinetry in the open concept kitchen. Plush carpeting in the spacious bedrooms. Master has a walk in closet. Newly tiled showers with decorative accents
-
2017-01-26$178,800 Active 361-char remark
Show marketing remark (361 chars)
Remodeled turn key duplex! Enjoy a 3 bed 2 bath home with rental potential from the separate 2 bed 1 bath space, all under one roof. Wonderful floor plan with tile flooring and picture windows. Lovely custom cabinetry in the open concept kitchen. Plush carpeting in the spacious bedrooms. Master has a walk in closet. Newly tiled showers with decorative accents
-
2017-01-25historical
-
2016-12-30price $178,800
-
2016-12-01price $179,000
-
2016-10-17price $189,000
-
2016-10-09$199,000 Active
-
2016-09-22historical
-
2016-09-13price $199,900
-
2016-09-02price $209,900
-
2016-08-25price $219,900
-
2016-08-16$229,900 Active
-
2015-11-30soldstatus $37,000
-
2014-04-17historical
-
2014-04-11$49,900 Active
-
2013-10-10historical
-
2013-08-17price $67,900
-
2013-08-13$69,900 Active
-
2012-09-11soldstatus $43,500
-
1998-02-02soldstatus $48,500
-
1996-01-09soldstatus $80,000
ⓘ Source: listings_history table (triggers on properties + properties_extension) + one-shot
backfill from property_details.listing_events for pre-trigger history.
Tax reassessment forecast AZ · Resets to sale price
- Current annual tax
- $2,281 · $190/mo
- Projected year-2 tax
- $3,432 · $286/mo
- Expected delta
- +$1,151/yr (+$96/mo · 50.4%)
ⓘ Screening estimate from a state-policy table — verify with the county assessor before closing.
Climate risk First Street
- Flood 1/10 Low FEMA zone X (shaded) · 0% chance over 30 yrs
- Wildfire 1/10 Low
- Heat 9/10 Extreme 7 d/yr ≥112°F today · 19 d/yr by 30 yrs out
- Wind 1/10 Low
- Air quality 2/10 Low 1 unhealthy d/yr today · 2 by 30 yrs out
Nearby sold comps map
Loading sold comps map…
Walkable amenities ~0.75 mi
Loading nearby amenities…
Taxation est. · year 1
- Rental income
- $51,108
- − Mortgage interest
- −$29,128
- − Property taxes
- −$2,281
- − Insurance
- −$2,600
- − Repairs & maintenance
- −$4,089
- − Management
- −$4,089
- − Depreciation
- −$15,127
- Taxable loss
- −$6,206
- Est. tax savings @ 24.0%
- +$1,489
- After-tax cash flow
- $4,260/yr
For passive investors: Depreciation is non-cash, so a rental often shows a tax loss while cash-flowing — sheltering income. Rental losses are passive: they offset passive income freely, and up to $25,000/yr can offset ordinary (W-2) income if you actively participate and your MAGI is under $100k (phasing out to $0 by $150k); unused losses carry forward. On sale, claimed depreciation is recaptured at up to 25%, and gains may owe capital-gains tax (a 1031 exchange can defer both). Figures are a year-1 estimate at your 24.0% rate — not tax advice; consult a CPA.
Schools (NCES district)
- District
- Roosevelt Elementary District (4279)
- NCES district ID
- 0407080
- Math proficiency
- 8% ▼ -13.00%
- Reading proficiency
- 14% ▼ -8.00%
- Median HH income
- $42,813
- Composite
- 9.74/100
- National rank
- #9829
- State rank
- #234 of 249 in AZ
Livability — Phoenix
- Score
- 75/100
- State rank
- #16
- US rank
- #3924
Category grades
Schools grade is shown separately in the Schools card above.
Census & demographics
- Census place
- Phoenix, AZ
- County
- Maricopa County · 4,537,380 people
- City population
- 1,500,198
- Metro
- Phoenix-Mesa-Chandler, AZ
- Population (ZIP)
- 34,117
- Household income
- $60,727
- Rent vs Own
- Severe rent burden
- 1460.0
Population outlook (Maricopa County) Hauer SSP2
- Today (2025)
- 4,979,203 people
- By 2030
- 5,378,229 · +8.0%
- By 2040
- 6,156,598 · +23.6%
- By 2050
- 6,872,376 · +38.0%
- By 2075
- 8,401,270 · +68.7%
- By 2100
- 9,247,439 · +85.7%
Race, ethnicity, and origin ACS 2023
- Neighborhood character
- Diverse neighborhood (Simpson 0.55)
- Race & ethnicity
- Hispanic / Latino 64% Two or more races 28% Black 16% White 13% Native American 4% Asian 3%
- Hispanic origin (detail)
- Mexican 58% Puerto Rican 1%
- Common ancestry
- Romanian 1% Italian 1% Lithuanian 1%
- Foreign-born
- 23% · Canada, South Korea
- Languages at home
- 51% English-only · Spanish 45% Other Indo-European 1% Tagalog/Filipino 1%
Political lean MEDSL · Maricopa
- 2024 margin
- Toss-up / Even · D 47.7% · R 51.2% · Other 1.1%
- 2008→2024 swing
- +7.1pp toward D · 2008: -10.6pp · 2024: -3.5pp
- All cycles
- 2024: R+3.5 2020: D+2.2 2016: R+3.5 2012: R+12.0 2008: R+10.6
Not yet ingested
- Civics
- —
Market trends
- HPI YoY
- ▼ -158.81%
- Current HPI
- 401.3438
- Rent YoY
- ▼ -1.21%
- Metro
- Phoenix-Mesa-Chandler, AZ
- State GDP YoY
- ▲ 4.54%
- F500 in state
- 20
Industry mix (Fortune 500 HQ in AZ)
| Industry | F500 HQs | Revenue |
|---|---|---|
| Technology | 2 | $13B |
|
||
| Mining / Metals | 1 | $23B |
|
||
| Environmental Services | 1 | $16B |
|
||
| Metals / Steel | 1 | $14B |
|
||
| Technology Distribution | 1 | $9B |
|
||
| Homebuilding | 1 | $8B |
|
||
Price history
+550.0% since first listed27 events — show timeline
- 2026-05-14 Relisted — ARMLS
- 2026-05-12 Listing Removed — ARMLS
- 2026-05-11 Listed $519,999 ARMLS
- 2025-11-02 Listing Removed — ARMLS
- 2025-08-01 Listed $519,999 ARMLS
- 2017-03-03 Sold (MLS) $183,800 ARMLS
- 2017-01-28 Pending — ARMLS
- 2017-01-26 Listed $178,800 ARMLS
- 2017-01-25 Listing Removed — ARMLS
- 2016-12-30 Price Changed $178,800 ARMLS
- 2016-12-01 Price Changed $179,000 ARMLS
- 2016-10-17 Price Changed $189,000 ARMLS
- 2016-10-09 Listed $199,000 ARMLS
- 2016-09-22 Listing Removed — ARMLS
- 2016-09-13 Price Changed $199,900 ARMLS
- 2016-09-02 Price Changed $209,900 ARMLS
- 2016-08-25 Price Changed $219,900 ARMLS
- 2016-08-16 Listed $229,900 ARMLS
- 2015-11-30 Sold (Public Records) $37,000 Public Records
- 2014-04-17 Listing Removed — ARMLS
- 2014-04-11 Listed $49,900 ARMLS
- 2013-10-10 Listing Removed — ARMLS
- 2013-08-17 Price Changed $67,900 ARMLS
- 2013-08-13 Listed $69,900 ARMLS
- 2012-09-11 Sold (Public Records) $43,500 Public Records
- 1998-02-02 Sold (Public Records) $48,500 Public Records
- 1996-01-09 Sold (Public Records) $80,000 Public Records
Property tax history
+0.4%/yrLatest (2025): $2,281 · +2.6% YoY. Source: county tax records.
Cash-flow waterfall
monthlySold comps — $/sqft
last 12 mo · ≤1 miLoading sold comps…