952 Cour Retta St · Warren, MI
Flood risk No data
- FEMA flood zone
- —
- Chance of flooding over 30 yrs
- —
- Est. flood insurance / yr
- —
Fire risk No data
- Est. fire insurance / yr
- —
Heat risk No data
- Hot days now (above threshold)
- —
- Hot days in 30 yrs
- —
Wind risk No data
- Chance of severe wind over 30 yrs
- —
Air-quality risk No data
- Unhealthy air days now
- —
- Unhealthy air days in 30 yrs
- —
Risk factors via First Street. Map © Google.
Why this score? — see what drove the B- grade
The composite is a weighted blend of 9 inputs, each scored 0–100. Each bar is that input's sub-score; the figure is the points it added to the 100-point composite (weight × sub-score).
- Cash flow +29.2/30.0
- 1% rule +10.0/10.0
- DSCR +10.0/10.0
- ARV discount +7.5/15.0
- Livability +3.7/5.0
- Rent growth +3.1/5.0
- Condition / age +2.8/5.0
- Schools +1.3/10.0
- Appreciation +0.0/10.0
$35,000
🖨 Deal sheet 📄 Offer letter ✓ Due diligence
Listing remarks MLS
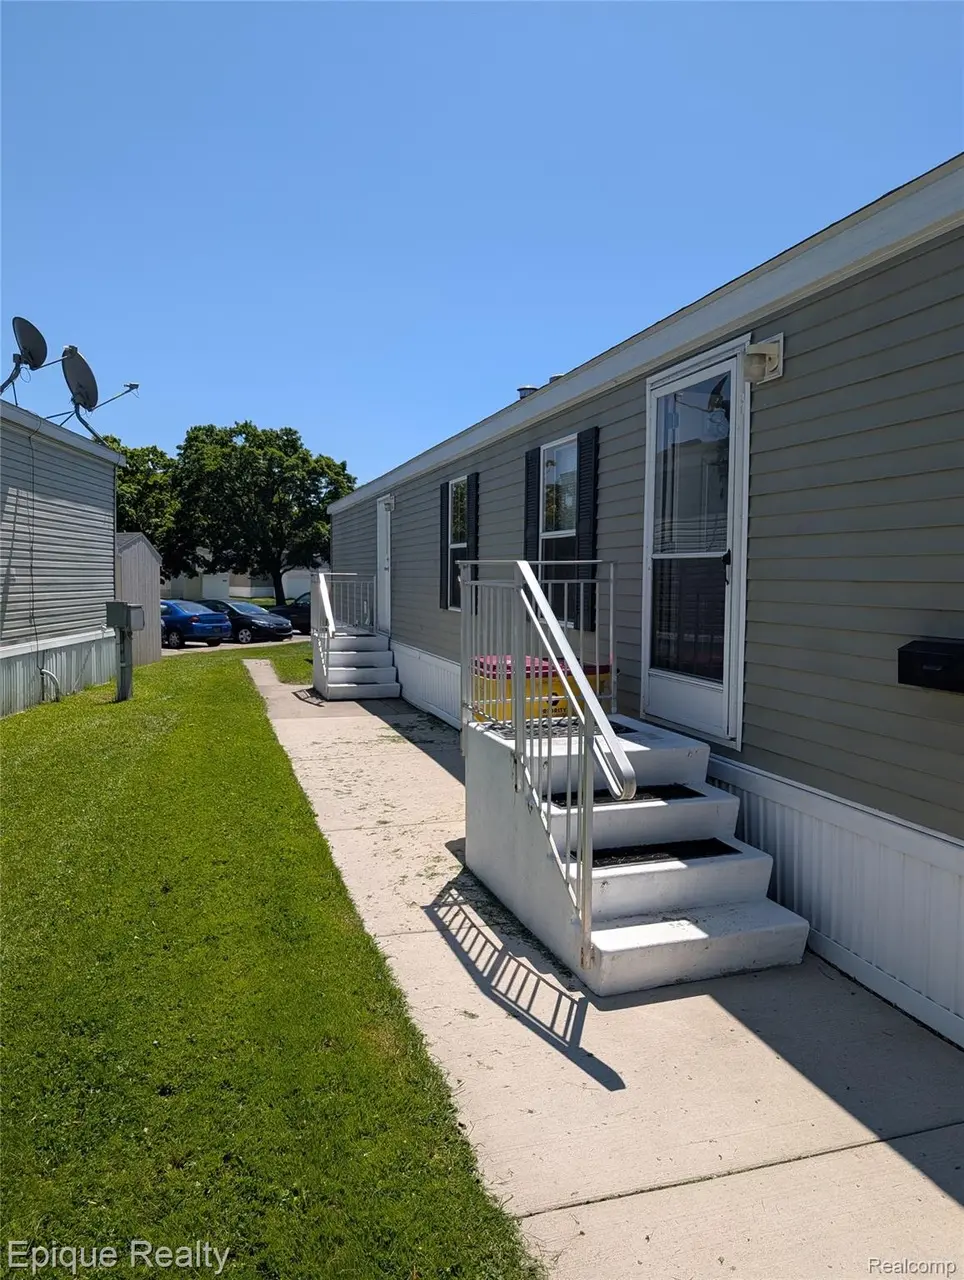
Discover the potential of 952 Cour Retta ST, a single family residence built in 2006 in Warren, MI. This property offers a compelling opportunity to create your ideal living space, blending functionality with the promise of a personalized touch. This home offers three bedrooms, providing flexible spaces for rest, recreation, or a dedicated home office. With two bathrooms, convenience and comfort are readily available for daily routines. Embrace the chance to craft a home that reflects your unique style and aspirations. Schedule a showing today to experience the possibilities of this Warren residence.
Key facts
- Built 2006
- Listed 22 days
Property features AI
Finance
- Other: Located north of 8 Mile and east of Dequindre (cross street: 8 Mile and Dequindre)
- HOA & community: Homeowners association with monthly fee of $733; Association fee includes water
Exterior
- Parking: No garage
- Utilities: Public water; Public sewer; Water and sewer available
- Home design: Single‑family residence; One story; Ground‑level entry with steps
- Construction: Aluminum siding
- Exterior features: Paved road access; Lot dimensions approximately 15 x 60
Interior
- Kitchen: Gas cooktop; Microwave; Dishwasher; Free‑standing refrigerator
- Bathrooms: 2 full bathrooms
- Heating & cooling: Forced air heating (natural gas); No central cooling
- Interior features: Dishwasher; Dryer; Free‑standing refrigerator; Gas cooktop; Microwave; Washer; Crawl space basement
- Laundry & utility: Washer and dryer included
Neighborhood map
What this means for you Summary
Snapshot
- This is a 3-bed/2.0-bath single-family listed at $35k. Condition is rated average.
Deal economics
- At list price, monthly cash flow is $122 ($1k/yr) — positive.
- The deal already cash-flows at list — no discount required.
- Meets the 1% rule at list price ($1k rent vs $35k).
- Recommended offer: $34k (1.5% below list) — sets the bar for market timing.
- Cap rate 10.5% vs local median 5.3% in Warren — top-decile yield for the area; either an underpriced asset or a hidden risk that comps aren't pricing in. Stress-test before assuming the spread holds.
Location & tenants
- Location reads 74/100 on livability (#171 in MI, #4,491 nationally) — a middle-class / working-renter tenant base. Strengths: commute A+, cost of living A+, housing A+; Watch: schools D, amenities D, employment D.
- Fitzgerald Public Schools (urban): math 8% / reading 23% proficiency, ranked #503 of 540 in MI (top 93%) — low school quality limits family demand, transient renter base, plan for 1-2y turnover; 77% free/reduced lunch — lower-income household profile, screen leases tightly.
- Market conditions: Rents rising (+2.4%/yr); 168 active listings in the ZIP; 31 comparable units currently listed for rent nearby; rentals at typical pace (median 24d on market — plan ~3-4 weeks tenant-placement turnaround); 1,321 units permitted in Macomb County in 2024 (86 in 5+ unit buildings).
- This rent runs 31% of the median local income ($54k/yr) — at the standard rent-burdened threshold; future hikes will face affordability resistance.
Forward outlook
- Local home prices are declining (-3.0%/yr); year-one equity from $242 of loan paydown is wiped out by about $1k of value loss. Plan a longer hold.
- Macomb County population projected at +9% by 2050 — modest demand growth; plan on rents tracking national, not racing it.
- At projected returns (-3.0% appreciation + 2.4% rent growth), your $10k cash investment doubles in ~9 years — after that, you're playing with house money.
Negotiation context
- It's been on market 22 days — a 2% lower offer ($34k) is reasonable based on typical stale-listing flexibility.
- 2 sale attempts with the ask held roughly flat each time — persistent listings suggest the price (not the market) is what's stuck; bring a comps-based counter.
Risks & watch-outs
- Watch-outs: HOA is 53% of rent.
Questions for the listing agent
- What does the HOA fee cover, when was the last increase, and are there any pending special assessments or reserve-fund shortfalls?
- Is there a deadline driving the sale (1031 exchange, divorce, estate, relocation)? That informs how much negotiation room exists.
- Schools are D-rated, which usually means shorter tenancies and higher turnover. Who's the typical renter profile here, and what's been the actual vacancy rate?
- Crime grade is D in this area — have there been break-ins, vandalism, or insurance claims at this property in the last 3 years? What carrier currently insures it and at what premium?
- What's the average days-on-market for RENTAL listings here right now (not sales)? A rising rental-DOM trend means longer vacancies and softer asking-rent achievability than the comps imply.
- What's the recent tenant-quality profile in this submarket — average credit score on applications, eviction rate, late-payment / NSF rate, and stable-employment percentage? A property-management company in the area should have these aggregated.
- How much new for-sale + rental construction is in the pipeline within 1–3 miles? Heavy new supply typically softens prices + rents 12–24 months out; constrained supply supports both.
Investment metrics
- 1% rule
- 3.97% ✓
- Cap rate
- 10.49%
- Cash-on-cash
- 14.98%
- DSCR
- 1.67
- GRM
- 2.1
CMA / ARV
- ARV (on-the-fly)
- $106,400
- Comps found
- 12
Show comp detail 12 sales within ~0.75 mi
| Address | Dist | Beds/Ba | Sqft | Sold | Price | $/sf | Match |
|---|---|---|---|---|---|---|---|
| 2184 Garrick Ave | 0.38mi | 3/1.0 | 960 (+1%) | 1mo | $95,100 | $99 | 76 |
| 3308 Toepfer Rd | 0.24mi | 3/1.0 | 1,000 (+5%) | 7mo | $150,500 | $151 | 70 |
| 2007 Pearl Ave | 0.56mi | 3/1.0 | 937 (-1%) | 2mo | $131,500 | $140 | 66 |
| 3588 Poplar Ave | 0.35mi | 3/1.0 | 1,031 (+8%) | 6mo | $50,000 | $48 | 60 |
| 3135 Jarvis Ave | 0.40mi | 3/1.5 | 1,052 (+11%) | 2mo | $163,000 | $155 | 60 |
| 20426 Wexford St | 0.63mi | 3/1.5 | 1,009 (+6%) | 0mo | $117,000 | $116 | 58 |
| 20409 Yonka St | 0.58mi | 3/1.0 | 1,050 (+10%) | 1mo | $93,000 | $89 | 50 |
| 1576 E Harry Ave | 0.73mi | 2/1.0 (-1) | 947 (-0%) | 7mo | $85,000 | $90 | 50 |
| 20028 Gallagher St | 0.67mi | 3/1.0 | 1,020 (+7%) | 5mo | $85,000 | $83 | 48 |
| 20180 Charest St | 0.55mi | 3/1.0 | 840 (-12%) | 4mo | $45,000 | $54 | 47 |
| 2167 Woodruff Ave | 0.73mi | 3/1.0 | 1,080 (+14%) | 2mo | $146,000 | $135 | 37 |
| 20811 Sunset Ave | 0.69mi | 3/1.0 | 1,090 (+15%) | 3mo | $122,000 | $112 | 37 |
Match score weights: distance 35% · size 25% · config 20% · recency 20%. Top-matched comps best support the ARV.
Projected returns pro-forma
-3.0% appreciation · 2.35% rent growth · sell at horizon
- IRR
- 4.5%
- Equity multiple
- 1.17×
- Total profit
- $1,691
- Equity at exit
- $5,219
- IRR
- 13.1%
- Equity multiple
- 2.00×
- Total profit
- $9,768
- Equity at exit
- $3,026
Cash invested: $9,800 (down + closing). Projections, not guarantees.
Landlord ↔ Tenant lean methodology
- Overall (STATE)
- 62 Landlord-Friendly
- State Michigan
- 62 Landlord-Friendly · EVEN
- County
- — inherits STATE
- City
- — inherits STATE
ZIP-level market 48091
- Rents YoY
- 2.4%
- Active inventory
- 168
- Price-to-rent
- 2.1×
Monthly cashflow live
- Estimated rent
- $1,389 high interval (Pro) →
- Mortgage (P&I)
- −$184
- Tax est. 1.5%
- −$44 /mo · $525/yr
- Insurance
- −$15
- HOA
- −$733
- Vacancy / Maint / Mgmt
- −$292
- Net cashflow
- $122
Break-even live
UW: 25.0% down · 7.5% · 30yr · 1.5% tax · 5.0% vac · 8.0% maint · 8.0% mgmt
Financing live
Cash to close
- Down payment
- $8,750
- Closing costs
- $1,050
- Reserves months
- —
- Total cash needed
- —
Loan-product check · same deal, 3 products live
Conventional
25% down · 7.5% · 30yr
- Down + closing
- —
- Monthly P&I
- —
- Monthly cashflow
- —
- DSCR
- —
- Eligible?
- —
Personal DTI + credit; lowest rate.
DSCR
20% down · 8.5% · 30yr
- Down + closing
- —
- Monthly P&I
- —
- Monthly cashflow
- —
- DSCR
- —
- Eligible?
- —
No personal income docs; deal must DSCR.
Hard money
10% down · 12.0% · 12mo
- Down + closing
- —
- Monthly P&I
- —
- Monthly cashflow
- —
- DSCR
- —
- Eligible?
- —
Short-term bridge; refi at stabilization.
Rent comps 31 comps
| Address | Beds | Baths | Sqft | Rent | $/sqft | DOM | Units | Dist |
|---|---|---|---|---|---|---|---|---|
| 21155 Warner Ave Warren, MI | 2.0 | 1.0 | 756 | $1,029 | $1.36 | 24d | 1 | 0.09mi |
| 2034 John B Ave Warren, MI | 3.0 | 1.0 | 920 | $1,261 | $1.37 | 43d | 1 | 0.37mi |
| 21516 Dequindre Rd Warren, MI | 1.0–2.0 | 1.0 | 837 | $1,375 | $1.64 | 21d | 1 | 0.40mi |
| 20255 Harned St Detroit, MI | 3.0 | 1.0 | 1000 | $1,374 | $1.37 | 16d | 1 | 0.43mi |
| 1621 E Evelyn Ave Hazel Park, MI | 2.0 | 1.0 | 749 | $1,295 | $1.73 | 18d | 1 | 0.65mi |
| 1731 E Pearl Ave Hazel Park, MI | 3.0 | 1.0 | 844 | $1,500 | $1.78 | 20d | 1 | 0.75mi |
| 1326 E Evelyn Ave Unit 1032332P Hazel Park, MI | 3.0 | 2.0 | 1097 | $6,448 | $5.88 | 1d | 1 | 0.83mi |
| 19694 Gallagher St Detroit, MI | 3.0 | 1.0 | 1000 | $1,150 | $1.15 | 15d | 1 | 0.84mi |
| 1211 E Bernhard Ave Hazel Park, MI | 2.0 | 1.0 | 721 | $1,500 | $2.08 | 24d | 1 | 0.87mi |
| 19930 Binder St Detroit, MI | 3.0 | 1.0 | 1000 | $1,450 | $1.45 | 16d | 1 | 0.87mi |
| 1019 E Hayes Ave Unit 1032331P Hazel Park, MI | 3.0 | 1.0 | 1033 | $5,301 | $5.13 | 1d | 1 | 0.97mi |
| 2709 Capitol Ave Warren, MI | 3.0 | 2.0 | 1056 | $1,649 | $1.56 | 43d | 1 | 0.97mi |
| 19450 Norwood St Detroit, MI | 3.0 | 1.0 | 1000 | $1,200 | $1.20 | 5d | 1 | 0.99mi |
| 23077 Davey Ave Hazel Park, MI | 3.0 | 1.0 | 933 | $1,895 | $2.03 | 24d | 1 | 1.01mi |
| 19360 Revere St Detroit, MI | 3.0 | 1.0 | 1050 | $1,250 | $1.19 | 24d | 1 | 1.05mi |
| 3840 Bart Ave Warren, MI | 3.0 | 1.0 | 1062 | $1,350 | $1.27 | 24d | 1 | 1.08mi |
| 20794 Audrey Ave Warren, MI | 3.0 | 1.0 | 954 | $1,350 | $1.42 | 43d | 1 | 1.12mi |
| 22580 Masch Ave Warren, MI | 3.0 | 1.0 | 988 | $1,450 | $1.47 | 24d | 1 | 1.18mi |
| 407 E Hayes Ave Hazel Park, MI | 3.0 | 1.0 | 1000 | $1,750 | $1.75 | 24d | 1 | 1.32mi |
| 1770 E Woodward Heights Blvd Hazel Park, MI | 2.0 | 1.0 | 850 | $1,525 | $1.79 | 12d | 1 | 1.35mi |
| 1770 E Woodward Heights Blvd Unit E3 Hazel Park, MI | 2.0 | 1.0 | 850 | $1,300 | $1.53 | 24d | 1 | 1.35mi |
| 1770 E Woodward Heights Blvd Hazel Park, MI | 1.0–2.0 | 1.0 | 712 | $1,400 | $1.96 | 5d | 1 | 1.35mi |
| 21410 Panama St Warren, MI | 3.0 | 1.0 | 900 | $1,600 | $1.78 | 24d | 1 | 1.35mi |
| 19450 Fenelon St Detroit, MI | 3.0 | 1.0 | 1062 | $1,384 | $1.30 | 5d | 1 | 1.40mi |
| 18882 Marx St Highland Park, MI | 2.0 | 1.0 | 1000 | $1,300 | $1.30 | 43d | 1 | 1.41mi |
| 18666 Joseph Campau St Detroit, MI | 3.0 | 1.0 | 1000 | $1,400 | $1.40 | 16d | 1 | 1.43mi |
| 21465 Syracuse Ave Warren, MI | 3.0 | 1.0 | 990 | $1,375 | $1.39 | 43d | 1 | 1.44mi |
| 20263 Caldwell St Detroit, MI | 3.0 | 1.0 | 909 | $1,350 | $1.49 | 16d | 1 | 1.45mi |
| 23115 Tawas Ave Hazel Park, MI | 2.0 | 1.0 | 706 | $1,375 | $1.95 | 24d | 1 | 1.45mi |
| 18629 Fleming St Detroit, MI | 3.0 | 1.5 | 900 | $1,150 | $1.28 | 24d | 1 | 1.46mi |
| 22622 Panama Ave Warren, MI | 3.0 | 1.5 | 920 | $1,395 | $1.52 | 11d | 1 | 1.50mi |
HOA detail
- Monthly dues
- $733 · $8,796/yr
Listing history 16 events
-
2026-06-18days on market $35,000 Active 22 DOM
-
2026-06-17days on market $35,000 Active 21 DOM
-
2026-06-16days on market $35,000 Active 20 DOM
-
2026-06-15days on market $35,000 Active 19 DOM
-
2026-06-13days on market $35,000 Active 17 DOM
-
2026-06-13days on market $35,000 Active 16 DOM
-
2026-06-09days on market $35,000 Active 13 DOM
-
2026-06-08days on market $35,000 Active 12 DOM
-
2026-06-07days on market $35,000 Active 11 DOM
-
2026-06-04days on market $35,000 Active 8 DOM
-
2026-06-03days on market $35,000 Active 7 DOM
-
2026-06-02days on market $35,000 Active 6 DOM
-
2026-06-01days on market $35,000 Active 5 DOM
-
2026-05-31days on market $35,000 Active 4 DOM
-
2026-05-27$35,000 Active
Show marketing remark (607 chars)
Discover the potential of 952 Cour Retta ST, a single family residence built in 2006 in Warren, MI. This property offers a compelling opportunity to create your ideal living space, blending functionality with the promise of a personalized touch. This home offers three bedrooms, providing flexible spaces for rest, recreation, or a dedicated home office. With two bathrooms, convenience and comfort are readily available for daily routines. Embrace the chance to craft a home that reflects your unique style and aspirations. Schedule a showing today to experience the possibilities of this Warren residence.
-
2026-05-27$35,000 Active 607-char remark
Show marketing remark (607 chars)
Discover the potential of 952 Cour Retta ST, a single family residence built in 2006 in Warren, MI. This property offers a compelling opportunity to create your ideal living space, blending functionality with the promise of a personalized touch. This home offers three bedrooms, providing flexible spaces for rest, recreation, or a dedicated home office. With two bathrooms, convenience and comfort are readily available for daily routines. Embrace the chance to craft a home that reflects your unique style and aspirations. Schedule a showing today to experience the possibilities of this Warren residence.
ⓘ Source: listings_history table (triggers on properties + properties_extension) + one-shot
backfill from property_details.listing_events for pre-trigger history.
Nearby sold comps map
Loading sold comps map…
Walkable amenities ~0.75 mi
Loading nearby amenities…
Taxation est. · year 1
- Rental income
- $16,667
- − Mortgage interest
- −$1,961
- − Property taxes
- −$525
- − Insurance
- −$175
- − Repairs & maintenance
- −$1,333
- − Management
- −$1,333
- − HOA
- −$8,796
- − Depreciation
- −$1,018
- Taxable income
- $1,526
- Est. tax owed @ 24.0%
- −$366
- After-tax cash flow
- $1,102/yr
For passive investors: Depreciation is non-cash, so a rental often shows a tax loss while cash-flowing — sheltering income. Rental losses are passive: they offset passive income freely, and up to $25,000/yr can offset ordinary (W-2) income if you actively participate and your MAGI is under $100k (phasing out to $0 by $150k); unused losses carry forward. On sale, claimed depreciation is recaptured at up to 25%, and gains may owe capital-gains tax (a 1031 exchange can defer both). Figures are a year-1 estimate at your 24.0% rate — not tax advice; consult a CPA.
Condition & rehab AI · 12 photos
This single-family home, built in 2006, offers a moderate level of renovation with average condition. It has three bedrooms and two bathrooms, and could benefit from some cosmetic updates to increase its resale and rental value.
Repairs flagged
- Minor Paint — Light-colored walls could benefit from a fresh coat.
- Minor Kitchen Countertops — White countertops could be replaced with a more modern material.
Value-add opportunities
- Both Paint the interior walls — Fresh paint can improve the overall appearance and value.
- Both Replace the kitchen countertops — Modern countertops can enhance the kitchen's appeal and functionality.
- Both Replace the shower curtain — A new shower curtain can improve the bathroom's appearance and functionality.
- Both Replace the ceiling fan — A new ceiling fan can improve air circulation and add to the home's overall appeal.
Renovation cost estimate screening
| Repair item | Severity | Est. cost |
|---|---|---|
| Paint · Light-colored walls could benefit from a fresh coat. | Minor | $500–3,000 |
| Kitchen Countertops · White countertops could be replaced with a more modern material. | Minor | $500–3,000 |
| Total estimated repair cost · 2 items | $1,000–6,000 |
Value-add ROI direction
- Both Paint the interior walls — Fresh paint can improve the overall appearance and value. ↑
- Both Replace the kitchen countertops — Modern countertops can enhance the kitchen's appeal and functionality. ↑
- Both Replace the shower curtain — A new shower curtain can improve the bathroom's appearance and functionality. ↑
- Both Replace the ceiling fan — A new ceiling fan can improve air circulation and add to the home's overall appeal. ↑
ⓘ Cost ranges are severity-bucket heuristics (US national rule-of-thumb). Get contractor quotes + a written scope before underwriting a rehab budget.
Schools (NCES district)
- District
- Fitzgerald Public Schools
- NCES district ID
- 2614460
- Math proficiency
- 8% ▼ -8.00%
- Reading proficiency
- 23% ▼ -11.00%
- Median HH income
- $34,828
- Composite
- 12.67/100
- National rank
- #9608
- State rank
- #503 of 540 in MI
Livability — Warren
- Score
- 74/100
- State rank
- #171
- US rank
- #4491
Category grades
Schools grade is shown separately in the Schools card above.
Census & demographics
- Census place
- Warren, MI
- County
- Macomb County · 638,552 people
- City population
- 114,937
- Metro
- Detroit-Warren-Dearborn, MI
- Population (ZIP)
- 30,696
- Household income
- $54,230
- Rent vs Own
- Severe rent burden
- 1296.0
Population outlook (Macomb County) Hauer SSP2
- Today (2025)
- 925,296 people
- By 2030
- 948,226 · +2.5%
- By 2040
- 983,961 · +6.3%
- By 2050
- 1,010,200 · +9.2%
- By 2075
- 1,076,222 · +16.3%
- By 2100
- 1,077,065 · +16.4%
Race, ethnicity, and origin ACS 2023
- Neighborhood character
- Diverse neighborhood (Simpson 0.68)
- Race & ethnicity
- White 47% Black 25% Asian 19% Two or more races 5% Hispanic / Latino 3% Native American 2%
- Common ancestry
- Romanian 7% Lithuanian 2% Slovak 1%
- Foreign-born
- 16% · Canada
- Languages at home
- 77% English-only · Other Indo-European 14% Other Asian/Pacific 3% Russian/Polish/Slavic 2%
Political lean MEDSL · Macomb
- 2024 margin
- R (+13.7) · D 42.2% · R 55.9% · Other 1.9%
- 2008→2024 swing
- -22.3pp toward R · 2008: 8.6pp · 2024: -13.7pp
- All cycles
- 2024: R+13.7 2020: R+8.1 2016: R+11.6 2012: D+4.0 2008: D+8.6
Not yet ingested
- Civics
- —
Market trends
- HPI YoY
- ▼ -199.66%
- Current HPI
- 177.9273
- Rent YoY
- ▲ 2.35%
- Metro
- Detroit-Warren-Dearborn, MI
- State GDP YoY
- ▲ 1.37%
- F500 in state
- 28
Industry mix (Fortune 500 HQ in MI)
| Industry | F500 HQs | Revenue |
|---|---|---|
| Automotive Parts | 3 | $48B |
|
||
| Automotive | 2 | $372B |
|
||
| Chemicals | 1 | $45B |
|
||
| Automotive Retail | 1 | $29B |
|
||
| Healthcare / Medical Devices | 1 | $23B |
|
||
| Automotive Technology | 1 | $20B |
|
||
Price history
+0.0% since first listed2 events — show timeline
- 2026-05-27 Listed $35,000 REALCOMP
- 2026-05-27 Listed $35,000 MiRealSource-MiMLS
Cash-flow waterfall
monthlySold comps — $/sqft
last 12 mo · ≤1 miLoading sold comps…