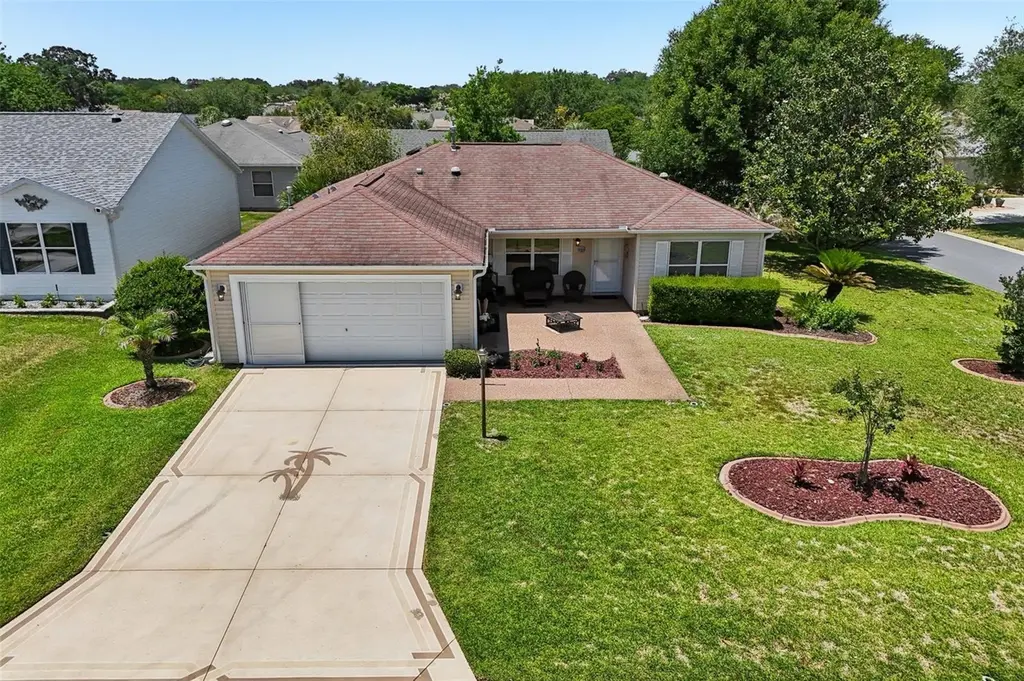
1000 Kenova Ave · The Villages, FL
Flood risk 1/10 · Minimal
- FEMA flood zone
- X (unshaded)
- Chance of flooding over 30 yrs
- 0.0%
- Est. flood insurance / yr
- $507 – $1,088
Fire risk 4/10 · Minor
- Est. fire insurance / yr
- $947 – $1,759
Heat risk 8/10 · Major
- Hot days now (above 109°F)
- 7 days/yr
- Hot days in 30 yrs
- 22 days/yr
Wind risk 9/10 · Severe
- Chance of severe wind over 30 yrs
- 99.0%
Air-quality risk 3/10 · Minor
- Unhealthy air days now
- 2 days/yr
- Unhealthy air days in 30 yrs
- 3 days/yr
Risk factors via First Street. Map © Google.
Why this score? — see what drove the C- grade
The composite is a weighted blend of 9 inputs, each scored 0–100. Each bar is that input's sub-score; the figure is the points it added to the 100-point composite (weight × sub-score).
- Cash flow +20.5/30.0
- ARV discount +6.7/15.0
- DSCR +6.5/10.0
- Schools +5.2/10.0
- 1% rule +4.4/10.0
- Rent growth +3.5/5.0
- Livability +3.5/5.0
- Condition / age +2.5/5.0
- Appreciation +0.0/10.0
$340,000
🖨 Deal sheet (PDF) 📄 Offer letter ✓ Due diligence
Listing remarks
No Bond on this 3 bedroom 2 Bath Amarillo in the sought after in the Village of Summerhill in The Villages. Home Features: HVAC 2017, Water Heater 2015, Roof 2011, Laminate Wood Floors in all Bedrooms, 15" Tile everywhere else, 12" Tile in lanai, high ceilings, a front and rear Patio, Stainless Steel Appliances, Enclosed Lanai, and Screens on the Garage Door. Home is plumbed for Gas at cooking, dryer, furnace, and water heater. Gas currently being used on furnace and water heater. New brush nickel remote controlled Ceiling Fan/LED Lights in all bedrooms plus living room, door knobs, hinges, vanity fixtures, window blinds, paint, and 5.25" base molding. There is a solar tube i
Key facts
- Roof 2011
- Laminate wood floors
- Hvac 2017
Tags
Property features AI
Finance
- Other: Unfurnished
- Financial info: CDD present; Lease restrictions apply
- HOA & community: Community features include: community mailbox, deed restrictions, dog park, fitness center, golf, park, playground, pool, street lights; Senior community; Pets allowed: cats and dogs; No association fee required (association approval not required)
Exterior
- Parking: Attached garage (2 spaces)
- Security: Community security
- Utilities: Public water; Public sewer; Electricity connected; Natural gas connected; Cable connected; Broadband/High-speed internet available; Underground utilities; Water connected; Sewer connected
- Home design: Single family residence; One story; Faces east; Residential property
- Construction: Vinyl siding; Shingle roof; Slab foundation; Built as part of existing building area (public records)
- Exterior features: Front porch; Rear porch; Mature landscaping; Irrigation system; Public maintained asphalt/paved road
Interior
- Kitchen: Dishwasher; Disposal; Microwave; Range; Refrigerator; Gas water heater
- Bedrooms: 3 bedrooms
- Flooring: Tile
- Bathrooms: 2 full bathrooms
- Heating & cooling: Central heating; Central air conditioning
- Interior features: High ceilings; Blinds
- Laundry & utility: Laundry room; Washer; Dryer
Neighborhood map
What this means for you Summary
Snapshot
- This is a 3-bed/2.0-bath single-family listed at $340k.
Deal economics
- At list price, monthly cash flow is $447 ($5k/yr) — positive.
- The deal already cash-flows at list — no discount required.
- To meet the 1% rule (rent ≥ 1% of price), the offer needs to be $321k (5.6% below list).
- Recommended offer: $321k (5.6% below list) — sets the bar for 1% rule.
- Cap rate 7.9% vs local median 5.0% in The Villages — top-decile yield for the area; either an underpriced asset or a hidden risk that comps aren't pricing in. Stress-test before assuming the spread holds.
Location & tenants
- Location reads 70/100 on livability (#431 in FL) — a middle-class / working-renter tenant base. Strengths: crime A+, housing A, employment B+; Watch: amenities F, commute F, health & safety F.
- Sumter (rural): math 61% / reading 61% proficiency, ranked #11 of 73 in FL (top 15%) — acceptable for families but not a draw, mixed tenant base, ~2y average lease.
- Zoned schools: Wildwood Elementary School (math 49% / reading 52%, grade D+, #1,055 of 2,144 statewide, top 50%, 940 students, 76% FRL); South Sumter Middle School (math 55% / reading 54%, grade B-, #183 of 571 statewide, top 34%, 897 students, 61% FRL) — zoned schools average 68% FRL vs 51% district-wide (18 pts higher); higher-poverty schools than district average — tighter screening recommended.
- Market conditions: Rents rising (+3.9%/yr); 551 active listings in the ZIP; 18 comparable units currently listed for rent nearby; rentals at typical pace (median 23d on market — plan ~3-4 weeks tenant-placement turnaround); 3,961 units permitted in Sumter County in 2024 (248 in 5+ unit buildings).
- At $3,209/mo this rent would consume 52% of the median local household income ($74k/yr) (locally 987% of renters already pay >50% of income on rent) — very limited rent-growth headroom before tenants either downsize or default.
Forward outlook
- Local home prices are declining (-3.0%/yr); year-one equity from $2k of loan paydown is wiped out by about $10k of value loss. Plan a longer hold.
- Sumter County population projected at +45% by 2050 — long-run rental-demand tailwind backs the buy-and-hold thesis.
Negotiation context
- It's been on market 38 days — a 3% lower offer ($330k) is reasonable based on typical stale-listing flexibility.
- Current owner paid $214k; list at $340k implies a 59% gain — meaningful room to come down on a strong offer.
Risks & watch-outs
- Climate carrying-cost: severe wind risk, 99% chance of damaging wind over 30y; extreme-heat days projected 7→22/yr by 2055 (HVAC capex compounding) — expect insurance premiums to compound above CPI over the hold.
Questions for the listing agent
- It's been on market 38 days. Have you received any prior offers? Is the seller open to a 6% concession, seller financing, or rate buy-down credit?
- Is there a deadline driving the sale (1031 exchange, divorce, estate, relocation)? That informs how much negotiation room exists.
- Schools are A-rated — typically a magnet for longer-tenancy family renters. What's the average tenant stay here, and is there a school-zone premium baked into asking?
- What's the average days-on-market for RENTAL listings here right now (not sales)? A rising rental-DOM trend means longer vacancies and softer asking-rent achievability than the comps imply.
- What's the recent tenant-quality profile in this submarket — average credit score on applications, eviction rate, late-payment / NSF rate, and stable-employment percentage? A property-management company in the area should have these aggregated.
- How much new for-sale + rental construction is in the pipeline within 1–3 miles? Heavy new supply typically softens prices + rents 12–24 months out; constrained supply supports both.
Investment metrics
- 1% rule
- 0.94% ✗
- Cap rate
- 7.87%
- Cash-on-cash
- 5.63%
- DSCR
- 1.25
- GRM
- 8.8
CMA / ARV
- ARV (on-the-fly)
- $334,080
- Comps found
- 12
Show comp detail 12 sales within ~0.75 mi
| Address | Dist | Beds/Ba | Sqft | Sold | Price | $/sf | Match |
|---|---|---|---|---|---|---|---|
| 3562 Auburndale Ave | 0.33mi | 3/2.0 | 1,392 (0%) | 2mo | $300,000 | $216 | 83 |
| 3248 Williams Rd | 0.40mi | 3/2.0 | 1,392 (0%) | 0mo | $375,000 | $269 | 81 |
| 1253 Addison Ave | 0.41mi | 3/2.0 | 1,437 (+3%) | 2mo | $348,000 | $242 | 74 |
| 935 Kenova Ave | 0.13mi | 3/2.0 | 1,572 (+13%) | 1mo | $397,000 | $253 | 72 |
| 3025 ST Thomas Ln | 0.62mi | 3/2.0 | 1,404 (+1%) | 1mo | $397,000 | $283 | 69 |
| 3189 Atwell Ave | 0.51mi | 3/2.0 | 1,477 (+6%) | 0mo | $315,000 | $213 | 66 |
| 1301 Oak Forest Dr | 0.71mi | 3/2.0 | 1,344 (-3%) | 0mo | $300,000 | $223 | 61 |
| 3249 Mansfield St | 0.50mi | 3/2.0 | 1,527 (+10%) | 1mo | $336,000 | $220 | 60 |
| 3001 Sandy Ln | 0.55mi | 3/2.0 | 1,542 (+11%) | 0mo | $320,220 | $208 | 56 |
| 3067 Melville Loop | 0.57mi | 3/2.0 | 1,527 (+10%) | 1mo | $370,000 | $242 | 56 |
| 1289 Addison Ave | 0.48mi | 2/2.0 (-1) | 1,248 (-10%) | 1mo | $300,000 | $240 | 55 |
| 3017 Hillside Ln | 0.71mi | 3/2.0 | 1,520 (+9%) | 1mo | $334,900 | $220 | 50 |
Match score weights: distance 35% · size 25% · config 20% · recency 20%. Top-matched comps best support the ARV.
Projected returns pro-forma
-3.0% appreciation · 3.92% rent growth · sell at horizon
- IRR
- -6.7%
- Equity multiple
- 0.75×
- Total profit
- $-23,764
- Equity at exit
- $50,695
- IRR
- 3.9%
- Equity multiple
- 1.29×
- Total profit
- $28,010
- Equity at exit
- $29,397
Cash invested: $95,200 (down + closing). Projections, not guarantees.
Landlord ↔ Tenant lean methodology
- Overall (STATE)
- 87 Strongly Landlord-Friendly
- State Florida
- 87 Strongly Landlord-Friendly · R+3
- County
- — inherits STATE
- City
- — inherits STATE
ZIP-level market 32162
- Home prices YoY
- -6.9%
- Rents YoY
- 3.9%
- Active inventory
- 551
- Price-to-rent
- 8.8×
Monthly cashflow live
- Estimated rent
- $3,209 high interval (Pro) →
- Mortgage (P&I)
- −$1,783
- Tax from tax record
- −$164 /mo · $1,963/yr
- Insurance
- −$142
- HOA
- −$0
- Vacancy / Maint / Mgmt
- −$674
- Net cashflow
- $447
Break-even live
Sensitivity live
| Price | -10% $639 | -5% $543 | +0% $447 | +5% $350 | +10% $254 |
|---|---|---|---|---|---|
| Rent | -10% $193 | -5% $320 | +0% $447 | +5% $573 | +10% $700 |
| Rate | -1.0pp $618 | -0.5pp $533 | base $447 | +0.5pp $359 | +1.0pp $269 |
UW: 25.0% down · 7.5% · 30yr · 1.5% tax · 5.0% vac · 8.0% maint · 8.0% mgmt
Financing live
Cash to close
- Down payment
- $85,000
- Closing costs
- $10,200
- Reserves months
- —
- Total cash needed
- —
Loan-product check · same deal, 3 products live
Conventional
25% down · 7.5% · 30yr
- Down + closing
- —
- Monthly P&I
- —
- Monthly cashflow
- —
- DSCR
- —
- Eligible?
- —
Personal DTI + credit; lowest rate.
DSCR
20% down · 8.5% · 30yr
- Down + closing
- —
- Monthly P&I
- —
- Monthly cashflow
- —
- DSCR
- —
- Eligible?
- —
No personal income docs; deal must DSCR.
Hard money
10% down · 12.0% · 12mo
- Down + closing
- —
- Monthly P&I
- —
- Monthly cashflow
- —
- DSCR
- —
- Eligible?
- —
Short-term bridge; refi at stabilization.
Rent comps 18 comps
| Address | Beds | Baths | Sqft | Rent | $/sqft | DOM | Units | Dist |
|---|---|---|---|---|---|---|---|---|
| 971 Kingmont Ter The Villages, FL | 3.0 | 2.0 | 1392 | $3,400 | $2.44 | 22d | 1 | 0.08mi |
| 888 Radclife Berea Pl The Villages, FL | 2.0 | 2.0 | 1288 | $4,200 | $3.26 | 22d | 1 | 0.26mi |
| 3545 Idlewood Loop The Villages, FL | 2.0 | 2.0 | 1240 | $4,500 | $3.63 | 22d | 1 | 0.36mi |
| 3207 Woodridge Dr The Villages, FL | 2.0 | 2.0 | 1148 | $4,200 | $3.66 | 22d | 1 | 0.38mi |
| 3489 Cambria Cir The Villages, FL | 2.0 | 2.0 | 1188 | $1,745 | $1.47 | 22d | 1 | 0.46mi |
| 3260 Atwell Ave The Villages, FL | 3.0 | 2.0 | 1392 | $2,500 | $1.80 | 22d | 1 | 0.47mi |
| 3292 Riverton Rd The Villages, FL | 2.0 | 2.0 | 1143 | $2,100 | $1.84 | 22d | 1 | 0.57mi |
| 1129 Santa Cruz Dr The Villages, FL | 2.0 | 2.0 | 1102 | $2,350 | $2.13 | 22d | 1 | 0.73mi |
| 2829 Burgos Dr The Villages, FL | 2.0 | 2.0 | 1156 | $1,850 | $1.60 | 22d | 1 | 0.81mi |
| 12388 NE 48th Loop Oxford, FL | 3.0 | 2.0 | 1426 | $1,700 | $1.19 | 22d | 1 | 0.84mi |
| 12020 Brush Hill Rd Oxford, FL | 1.0–3.0 | 1.0–2.0 | 947 | $2,295 | $2.42 | 22d | 15 | 0.85mi |
| 6367 NE 118th Ave The Villages, FL | 3.0–4.0 | 2.0–2.5 | 1645 | $1,925 | $1.17 | 22d | 10 | 1.06mi |
| 1648 Belle Grove Dr The Villages, FL | 2.0 | 2.0 | 1132 | $4,250 | $3.75 | 22d | 1 | 1.30mi |
| 2909 Meadow Lawn Ln The Villages, FL | 2.0 | 2.0 | 1132 | $4,300 | $3.80 | 22d | 1 | 1.38mi |
| 1808 Peachtree Ave The Villages, FL | 2.0 | 2.0 | 1182 | $2,500 | $2.12 | 22d | 1 | 1.41mi |
| 650 Richland Rd The Villages, FL | 2.0 | 2.0 | 1188 | $4,500 | $3.79 | 22d | 1 | 1.44mi |
| 2111 Thornton Ter The Villages, FL | 2.0 | 2.0 | 1156 | $4,400 | $3.81 | 22d | 1 | 1.47mi |
| 2864 Leicester Ter Unit 1525680P The Villages, FL | 2.0 | 2.0 | 1130 | $2,090 | $1.85 | 22d | 1 | 1.48mi |
Listing history 17 events
-
2026-06-19days on market $340,000 Active 38 DOM
-
2026-06-18days on market $340,000 Active 37 DOM
-
2026-06-17days on market $340,000 Active 36 DOM
-
2026-06-16days on market $340,000 Active 35 DOM
-
2026-06-15days on market $340,000 Active 34 DOM
-
2026-06-14days on market $340,000 Active 32 DOM
-
2026-06-13days on market $340,000 Active 31 DOM
-
2026-06-10days on market $340,000 Active 29 DOM
-
2026-06-09days on market $340,000 Active 28 DOM
-
2026-06-08days on market $340,000 Active 27 DOM
-
2026-06-07days on market $340,000 Active 26 DOM
-
2026-06-02days on market $340,000 Active 21 DOM
-
2026-06-01days on market $340,000 Active 20 DOM
-
2026-05-31days on market $340,000 Active 19 DOM
-
2026-05-30days on market $340,000 Active 18 DOM
-
2026-05-13$340,000 Active
-
2005-10-25soldstatus $214,000
ⓘ Source: listings_history table (triggers on properties + properties_extension) + one-shot
backfill from property_details.listing_events for pre-trigger history.
Tax reassessment forecast FL · Resets to sale price
- Current annual tax
- $1,963 · $164/mo
- Projected year-2 tax
- $2,822 · $235/mo
- Expected delta
- +$859/yr (+$72/mo · 43.7%)
ⓘ Screening estimate from a state-policy table — verify with the county assessor before closing.
Climate risk First Street
- Flood 1/10 Low FEMA zone X (unshaded) · 0% chance over 30 yrs
- Wildfire 4/10 Moderate
- Heat 8/10 Severe 7 d/yr ≥109°F today · 22 d/yr by 30 yrs out
- Wind 9/10 Extreme 99% chance of damaging wind over 30 yrs
- Air quality 3/10 Moderate 2 unhealthy d/yr today · 3 by 30 yrs out
Nearby sold comps map
Loading sold comps map…
Walkable amenities ~0.75 mi
Loading nearby amenities…
Taxation est. · year 1
- Rental income
- $38,505
- − Mortgage interest
- −$19,045
- − Property taxes
- −$1,963
- − Insurance
- −$1,700
- − Repairs & maintenance
- −$3,080
- − Management
- −$3,080
- − Depreciation
- −$9,891
- Taxable loss
- −$256
- Est. tax savings @ 24.0%
- +$61
- After-tax cash flow
- $5,421/yr
For passive investors: Depreciation is non-cash, so a rental often shows a tax loss while cash-flowing — sheltering income. Rental losses are passive: they offset passive income freely, and up to $25,000/yr can offset ordinary (W-2) income if you actively participate and your MAGI is under $100k (phasing out to $0 by $150k); unused losses carry forward. On sale, claimed depreciation is recaptured at up to 25%, and gains may owe capital-gains tax (a 1031 exchange can defer both). Figures are a year-1 estimate at your 24.0% rate — not tax advice; consult a CPA.
Schools (NCES district)
- District
- Sumter
- NCES district ID
- 1201800
- Math proficiency
- 61% ▼ -4.00%
- Reading proficiency
- 61% ▼ -2.00%
- Median HH income
- $48,240
- Composite
- 51.74/100
- National rank
- #1682
- State rank
- #11 of 73 in FL
Livability — The Villages
- Score
- 70/100
- State rank
- #431
- US rank
- #7363
Category grades
Schools grade is shown separately in the Schools card above.
Census & demographics
- Census place
- The Villages, FL
- County
- Sumter County · 110,591 people
- City population
- 83,973
- Metro
- The Villages, FL
- Population (ZIP)
- 55,424
- Household income
- $74,119
- Rent vs Own
- Severe rent burden
- 987.0
Population outlook (Sumter County) Hauer SSP2
- Today (2025)
- 161,172 people
- By 2030
- 180,083 · +11.7%
- By 2040
- 209,892 · +30.2%
- By 2050
- 234,186 · +45.3%
- By 2075
- 284,602 · +76.6%
- By 2100
- 317,039 · +96.7%
Race, ethnicity, and origin ACS 2023
- Neighborhood character
- Predominantly White (95%)
- Race & ethnicity
- White 95% Two or more races 2% Hispanic / Latino 2% Asian 1% Black 1%
- Common ancestry
- Romanian 7% Slovak 4% Lithuanian 4%
- Foreign-born
- 5% · Canada
- Languages at home
- 96% English-only · Spanish 1% Tagalog/Filipino 1%
Political lean MEDSL · Sumter
- 2024 margin
- Solid R (+37.6) · D 30.9% · R 68.6%
- 2008→2024 swing
- -10.6pp toward R · 2008: -27.0pp · 2024: -37.6pp
- All cycles
- 2024: R+37.6 2020: R+36.1 2016: R+39.2 2012: R+34.9 2008: R+27.0
Not yet ingested
- Civics
- —
Market trends
- HPI YoY
- ▼ -16.16%
- Current HPI
- 218.1956
- Rent YoY
- ▲ 3.92%
- Metro
- The Villages, FL
- State GDP YoY
- ▲ 3.28%
- F500 in state
- 36
Industry mix (Fortune 500 HQ in FL)
| Industry | F500 HQs | Revenue |
|---|---|---|
| Industrial Technology | 2 | $29B |
|
||
| Insurance | 2 | $17B |
|
||
| Retail | 1 | $60B |
|
||
| Technology Distribution | 1 | $58B |
|
||
| Homebuilding | 1 | $35B |
|
||
| Technology Manufacturing | 1 | $35B |
|
||
Price history
+58.9% since first listed2 events — show timeline
- 2026-05-13 Listed $340,000 Stellar MLS as Distributed by MLS Grid
- 2005-10-25 Sold (Public Records) $214,000 Public Records
Property tax history
-1.2%/yrLatest (2025): $1,963 · +1.4% YoY. Source: county tax records.
Cash-flow waterfall
monthlySold comps — $/sqft
last 12 mo · ≤1 miLoading sold comps…