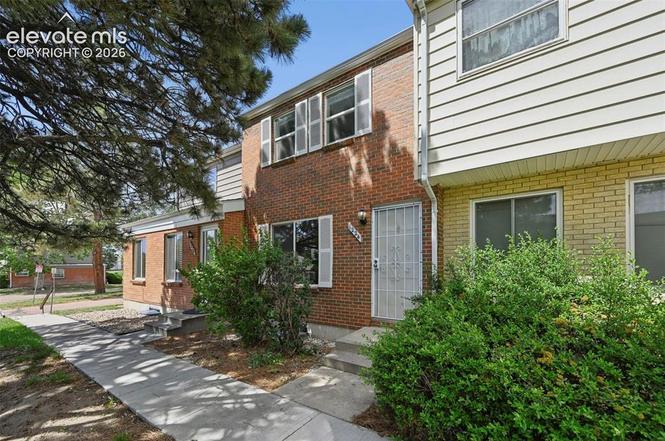
1224 Cree Dr · Cimarron Hills, CO
Flood risk 1/10 · Minimal
- FEMA flood zone
- X (unshaded)
- Chance of flooding over 30 yrs
- 0.0%
- Est. flood insurance / yr
- $473 – $860
Fire risk 5/10 · Moderate
- Est. fire insurance / yr
- $939 – $1,743
Heat risk 2/10 · Minimal
- Hot days now (above 89°F)
- 5 days/yr
- Hot days in 30 yrs
- 13 days/yr
Wind risk 2/10 · Minimal
- Chance of severe wind over 30 yrs
- —
Air-quality risk 1/10 · Minimal
- Unhealthy air days now
- 0 days/yr
- Unhealthy air days in 30 yrs
- 0 days/yr
Risk factors via First Street. Map © Google.
Why this score? — see what drove the D grade
The composite is a weighted blend of 9 inputs, each scored 0–100. Each bar is that input's sub-score; the figure is the points it added to the 100-point composite (weight × sub-score).
- Cash flow +13.1/30.0
- ARV discount +7.5/15.0
- 1% rule +5.6/10.0
- DSCR +3.9/10.0
- Livability +3.4/5.0
- Rent growth +2.9/5.0
- Schools +2.5/10.0
- Condition / age +2.5/5.0
- Appreciation +0.0/10.0
$224,900
🖨 Deal sheet 📄 Offer letter ✓ Due diligence
Key facts
- Finished basement
- Updated kitchen
- Private fenced yard
Tags
Property features AI
Finance
- Financial info: Acceptable financing: Cash, Conventional, FHA, VA
- HOA & community: HOA with monthly fee; HOA covers covenant enforcement, lawn care, exterior maintenance, management, snow removal, trash removal and water
Exterior
- Parking: Carport with 2 garage spaces
- Utilities: Municipal water; Cable available; Electricity available; Gas available
- Home design: Townhouse; Ground floor unit
- Construction: Framed on lot construction; Composite shingle roof; Aluminum/Vinyl/Steel siding; Full basement (about 90% finished); Existing home
- Exterior features: Concrete patio; Rear fence; Fully landscaped lot; Level lot with mountain view; Concrete driveway
Interior
- Kitchen: Dishwasher; Disposal; Microwave; Oven/Range (Gas/Electric); Refrigerator
- Bedrooms: Master bedroom located on the upper level
- Bathrooms: 1 full bathroom; 1 half bathroom
- Heating & cooling: Central air; Forced air heating
- Interior features: Central air conditioning; Forced air heating; Basement laundry
- Laundry & utility: Washer; Dryer; Laundry in basement
Neighborhood map
What this means for you Summary
Snapshot
- This is a 4-bed/2.0-bath condo listed at $225k.
Deal economics
- At list price, monthly cash flow is $-10 ($-119/yr) — negative.
- To cash-flow at today's rent, offer at most $223k (0.8% below list).
- Meets the 1% rule at list price ($2k rent vs $225k).
- Recommended offer: $223k (0.8% below list) — sets the bar for cash-flow.
- Cap rate 6.2% vs local median 3.9% in Cimarron Hills — top-decile yield for the area; either an underpriced asset or a hidden risk that comps aren't pricing in. Stress-test before assuming the spread holds.
Location & tenants
- Location reads 68/100 on livability (#111 in CO) — a middle-class / working-renter tenant base. Strengths: housing A+, health & safety A, employment A-; Watch: crime F, amenities F, commute F.
- Colorado Springs School District No. 11 In The County Of E (urban): math 20% / reading 37% proficiency, ranked #56 of 86 in CO (top 65%) — low school quality limits family demand, transient renter base, plan for 1-2y turnover.
- Market conditions: Rents rising (+1.6%/yr); 145 active listings in the ZIP; 18 comparable units currently listed for rent nearby; rentals leasing fast (median 3d on market — plan ~1-2 weeks tenant-placement turnaround); 3,906 units permitted in El Paso County in 2024 (872 in 5+ unit buildings).
- This rent runs 40% of the median local income ($72k/yr) — at the standard rent-burdened threshold; future hikes will face affordability resistance.
Forward outlook
- Local home prices are declining (-3.0%/yr); year-one equity from $2k of loan paydown is wiped out by about $7k of value loss. Plan a longer hold.
- El Paso County population projected at +28% by 2050 — long-run rental-demand tailwind backs the buy-and-hold thesis.
Negotiation context
- Only 7 days on market — expect competitive offers; lowballing is unlikely to land.
- 2 sale attempts with the ask held roughly flat each time — persistent listings suggest the price (not the market) is what's stuck; bring a comps-based counter.
- Current owner paid $93k; list at $225k implies a 142% gain — meaningful room to come down on a strong offer.
Risks & watch-outs
- Watch-outs: HOA is 22% of rent.
- Climate carrying-cost: moderate wildfire risk — expect insurance premiums to compound above CPI over the hold.
Questions for the listing agent
- What do current leases actually rent for vs. the listed asking? Can we see a recent rent roll and the last 12 months of T-12 income?
- Built in 1966 — when were the roof, HVAC, electrical panel, plumbing, and water heater last replaced?
- What does the HOA fee cover, when was the last increase, and are there any pending special assessments or reserve-fund shortfalls?
- Any open or pending special assessments — roof, HVAC, plumbing, elevator, façade? What's the per-unit balance and payoff schedule, and is the seller paying it off at close or rolling it to the buyer?
- Is there a deadline driving the sale (1031 exchange, divorce, estate, relocation)? That informs how much negotiation room exists.
- Schools are B-rated — typically a magnet for longer-tenancy family renters. What's the average tenant stay here, and is there a school-zone premium baked into asking?
- Crime grade is F in this area — have there been break-ins, vandalism, or insurance claims at this property in the last 3 years? What carrier currently insures it and at what premium?
- The area grade is low — what's the realistic commute time and amenity access for the typical tenant pool here? Any planned neighborhood developments (good or bad) we should know about?
- What's the average days-on-market for RENTAL listings here right now (not sales)? A rising rental-DOM trend means longer vacancies and softer asking-rent achievability than the comps imply.
- What's the recent tenant-quality profile in this submarket — average credit score on applications, eviction rate, late-payment / NSF rate, and stable-employment percentage? A property-management company in the area should have these aggregated.
- How much new apartment / multifamily construction is in the pipeline within 1–3 miles? Heavy new supply (>2% of stock underway) typically softens rents 12–24 months out; light construction supports rent growth.
Investment metrics
- 1% rule
- 1.06% ✓
- Cap rate
- 6.24%
- Cash-on-cash
- -0.19%
- DSCR
- 0.99
- GRM
- 7.8
CMA / ARV
No comps found within radius.
Projected returns pro-forma
-3.0% appreciation · 1.59% rent growth · sell at horizon
- IRR
- -18.4%
- Equity multiple
- 0.36×
- Total profit
- $-40,175
- Equity at exit
- $33,533
- IRR
- -14.3%
- Equity multiple
- 0.24×
- Total profit
- $-48,143
- Equity at exit
- $19,445
Cash invested: $62,972 (down + closing). Projections, not guarantees.
Landlord ↔ Tenant lean methodology
- Overall (STATE)
- 38 Tenant-Leaning
- State Colorado
- 38 Tenant-Leaning · D+4
- County
- — inherits STATE
- City
- — inherits STATE
ZIP-level market 80915
- Home prices YoY
- -30.2%
- Rents YoY
- 1.6%
- Active inventory
- 145
- Price-to-rent
- 7.8×
Monthly cashflow live
- Estimated rent
- $2,394 high interval (Pro) →
- Mortgage (P&I)
- −$1,179
- Tax from tax record
- −$95 /mo · $1,140/yr
- Insurance
- −$94
- HOA
- −$533
- Vacancy / Maint / Mgmt
- −$503
- Net cashflow
- $-10
Break-even live
UW: 25.0% down · 7.5% · 30yr · 1.5% tax · 5.0% vac · 8.0% maint · 8.0% mgmt
Financing live
Cash to close
- Down payment
- $56,225
- Closing costs
- $6,747
- Reserves months
- —
- Total cash needed
- —
Loan-product check · same deal, 3 products live
Conventional
25% down · 7.5% · 30yr
- Down + closing
- —
- Monthly P&I
- —
- Monthly cashflow
- —
- DSCR
- —
- Eligible?
- —
Personal DTI + credit; lowest rate.
DSCR
20% down · 8.5% · 30yr
- Down + closing
- —
- Monthly P&I
- —
- Monthly cashflow
- —
- DSCR
- —
- Eligible?
- —
No personal income docs; deal must DSCR.
Hard money
10% down · 12.0% · 12mo
- Down + closing
- —
- Monthly P&I
- —
- Monthly cashflow
- —
- DSCR
- —
- Eligible?
- —
Short-term bridge; refi at stabilization.
Rent comps 18 comps
| Address | Beds | Baths | Sqft | Rent | $/sqft | DOM | Units | Dist |
|---|---|---|---|---|---|---|---|---|
| 7010 Crossbuck Pt Colorado Springs, CO | 1.0–3.0 | 1.0–2.0 | 981 | $2,631 | $2.68 | 2d | 17 | 0.55mi |
| 6944 Palmer Park Blvd Colorado Springs, CO | 3.0 | 2.5 | 1280 | $1,950 | $1.52 | 2d | 1 | 0.70mi |
| 1020 Solace Pond Vw Colorado Springs, CO | 1.0–3.0 | 1.0–2.0 | 1158 | $2,632 | $2.27 | 2d | 12 | 0.74mi |
| 1350 Cascade Creek Vw Colorado Springs, CO | 1.0–3.0 | 1.0–2.0 | 1042 | $2,190 | $2.10 | 3d | 24 | 1.06mi |
| 5704 Ella VW Colorado Springs, CO | 1.0–3.0 | 1.0–3.0 | 1107 | $2,961 | $2.67 | 3d | 177 | 1.07mi |
| 1070 Branding Iron Dr Colorado Springs, CO | 3.0 | 2.0 | 1526 | $1,900 | $1.25 | 23d | 1 | 1.17mi |
| 2284 Reed Grass Way Colorado Springs, CO | 3.0 | 2.5 | 1853 | $2,500 | $1.35 | 3d | 1 | 1.19mi |
| 705 Grissom Dr Colorado Springs, CO | 3.0 | 2.5 | 1360 | $2,139 | $1.57 | 23d | 1 | 1.24mi |
| 5550 Cernan Hts Colorado Springs, CO | 1.0–3.0 | 1.0–2.0 | 892 | $2,225 | $2.49 | 3d | 19 | 1.27mi |
| 1885 Sandtoft Hts Colorado Springs, CO | 3.0 | 2.5 | 2080 | $2,200 | $1.06 | 21d | 1 | 1.28mi |
| 9520 Antora GRV Colorado Springs, CO | 1.0–3.0 | 1.0–2.5 | 1017 | $2,789 | $2.74 | 3d | 41 | 1.29mi |
| 7230 Constitution Square Hts Colorado Springs, CO | 1.0–3.0 | 1.0–2.0 | 992 | $1,700 | $1.71 | 2d | 12 | 1.31mi |
| 6364 Zermatt Dr Colorado Springs, CO | 3.0 | 2.0 | 1529 | $1,980 | $1.29 | 2d | 1 | 1.33mi |
| 5362 Hammond Dr Colorado Springs, CO | 4.0 | 2.5 | 1748 | $2,300 | $1.32 | 23d | 1 | 1.37mi |
| 2434 Vanhoutte Vw Colorado Springs, CO | 3.0 | 2.5 | 1438 | $2,800 | $1.95 | 2d | 1 | 1.38mi |
| 5518 Timeless Vw Colorado Springs, CO | 3.0 | 3.5 | 2191 | $2,250 | $1.03 | 14d | 1 | 1.40mi |
| 6247 Chantilly Pl Colorado Springs, CO | 4.0 | 2.0 | 1656 | $1,935 | $1.17 | 2d | 1 | 1.41mi |
| 7263 Hunter Jumper Dr Colorado Springs, CO | 3.0 | 3.5 | 2116 | $3,500 | $1.65 | 10d | 1 | 1.49mi |
HOA detail condo
- Monthly dues
- $533 · $6,396/yr
- Assessments
- None detected in remarks — confirm with the listing agent.
Listing history 5 events
-
2026-06-18days on market $224,900 Active 7 DOM
-
2026-06-17days on market $224,900 Active 6 DOM
-
2026-06-16days on market $224,900 Active 5 DOM
-
2026-06-15days on market $224,900 Active 4 DOM
-
2026-06-14$224,900 Active 2 DOM
ⓘ Source: listings_history table (triggers on properties + properties_extension) + one-shot
backfill from property_details.listing_events for pre-trigger history.
Tax reassessment forecast CO · Resets to sale price
- Current annual tax
- $1,140 · $95/mo
- Projected year-2 tax
- $1,237 · $103/mo
- Expected delta
- +$97/yr (+$8/mo · 8.5%)
ⓘ Screening estimate from a state-policy table — verify with the county assessor before closing.
Climate risk First Street
- Flood 1/10 Low FEMA zone X (unshaded) · 0% chance over 30 yrs
- Wildfire 5/10 Major
- Heat 2/10 Low 5 d/yr ≥89°F today · 13 d/yr by 30 yrs out
- Wind 2/10 Low
- Air quality 1/10 Low 0 unhealthy d/yr today · 0 by 30 yrs out
Nearby sold comps map
Loading sold comps map…
Walkable amenities ~0.75 mi
Loading nearby amenities…
Taxation est. · year 1
- Rental income
- $28,727
- − Mortgage interest
- −$12,598
- − Property taxes
- −$1,140
- − Insurance
- −$1,124
- − Repairs & maintenance
- −$2,298
- − Management
- −$2,298
- − HOA
- −$6,396
- − Depreciation
- −$6,543
- Taxable loss
- −$3,670
- Est. tax savings @ 24.0%
- +$881
- After-tax cash flow
- $762/yr
For passive investors: Depreciation is non-cash, so a rental often shows a tax loss while cash-flowing — sheltering income. Rental losses are passive: they offset passive income freely, and up to $25,000/yr can offset ordinary (W-2) income if you actively participate and your MAGI is under $100k (phasing out to $0 by $150k); unused losses carry forward. On sale, claimed depreciation is recaptured at up to 25%, and gains may owe capital-gains tax (a 1031 exchange can defer both). Figures are a year-1 estimate at your 24.0% rate — not tax advice; consult a CPA.
Schools (NCES district)
- District
- Colorado Springs School District No. 11 In The County Of E
- NCES district ID
- 0803060
- Math proficiency
- 20% ▼ -8.00%
- Reading proficiency
- 37% ▼ -4.00%
- Median HH income
- $47,884
- Composite
- 24.69/100
- National rank
- #7613
- State rank
- #56 of 86 in CO
Livability — Cimarron Hills
- Score
- 68/100
- State rank
- #111
- US rank
- #9580
Category grades
Schools grade is shown separately in the Schools card above.
Census & demographics
- Census place
- Cimarron Hills, CO
- County
- El Paso County · 689,348 people
- City population
- 23,570
- Metro
- Colorado Springs, CO
- Population (ZIP)
- 23,884
- Household income
- $72,352
- Rent vs Own
- Severe rent burden
- 650.0
Population outlook (El Paso County) Hauer SSP2
- Today (2025)
- 768,926 people
- By 2030
- 815,739 · +6.1%
- By 2040
- 903,489 · +17.5%
- By 2050
- 981,204 · +27.6%
- By 2075
- 1,155,542 · +50.3%
- By 2100
- 1,202,070 · +56.3%
Race, ethnicity, and origin ACS 2023
- Neighborhood character
- Diverse neighborhood (Simpson 0.57)
- Race & ethnicity
- White 59% Hispanic / Latino 27% Two or more races 15% Black 4% Asian 2% Native American 1%
- Hispanic origin (detail)
- Mexican 17% Puerto Rican 2%
- Common ancestry
- Italian 4% Slovak 3% Lithuanian 3%
- Foreign-born
- 6% · Canada, Dominican Republic
- Languages at home
- 88% English-only · Spanish 9% Tagalog/Filipino 1%
Political lean MEDSL · El Paso
- 2024 margin
- Lean R (+9.8) · D 43.8% · R 53.5% · Other 2.7%
- 2008→2024 swing
- +9.0pp toward D · 2008: -18.8pp · 2024: -9.8pp
- All cycles
- 2024: R+9.8 2020: R+10.8 2016: R+22.6 2012: R+21.4 2008: R+18.8
Not yet ingested
- Civics
- —
Market trends
- HPI YoY
- ▼ -122.65%
- Current HPI
- 283.9227
- Rent YoY
- ▲ 1.59%
- Metro
- Colorado Springs, CO
- State GDP YoY
- ▲ 1.95%
- F500 in state
- 14
Industry mix (Fortune 500 HQ in CO)
| Industry | F500 HQs | Revenue |
|---|---|---|
| Technology Distribution | 1 | $31B |
|
||
| Food / Agriculture | 1 | $18B |
|
||
| Packaging | 1 | $14B |
|
||
| Healthcare | 1 | $13B |
|
||
| Energy | 1 | $10B |
|
||
| Technology | 1 | $4B |
|
||
Price history
+141.8% since first listed4 events — show timeline
- 2026-06-12 Listed $224,900 elevateMLS
- 2025-08-21 Rental Removed $1,800 SHOWMOJO
- 2025-08-09 Listed for Rent $1,800 SHOWMOJO
- 2002-12-31 Sold (Public Records) $93,000 Public Records
Property tax history
+4.5%/yrLatest (2025): $1,140 · +26.7% YoY. Source: county tax records.
Cash-flow waterfall
monthlySold comps — $/sqft
last 12 mo · ≤1 miLoading sold comps…