200 Maple Rd · President, PA
Flood risk 1/10 · Minimal
- FEMA flood zone
- X (unshaded)
- Chance of flooding over 30 yrs
- 0.0%
- Est. flood insurance / yr
- $507 – $1,088
Fire risk 4/10 · Minor
- Est. fire insurance / yr
- $511 – $949
Heat risk 2/10 · Minimal
- Hot days now (above 92°F)
- 7 days/yr
- Hot days in 30 yrs
- 17 days/yr
Wind risk 1/10 · Minimal
- Chance of severe wind over 30 yrs
- —
Air-quality risk 2/10 · Minimal
- Unhealthy air days now
- 1 days/yr
- Unhealthy air days in 30 yrs
- 2 days/yr
Risk factors via First Street. Map © Google.
Why this score? — see what drove the B+ grade
The composite is a weighted blend of 9 inputs, each scored 0–100. Each bar is that input's sub-score; the figure is the points it added to the 100-point composite (weight × sub-score).
- Cash flow +30.0/30.0
- 1% rule +10.0/10.0
- DSCR +10.0/10.0
- ARV discount +7.5/15.0
- Appreciation +6.1/10.0
- Schools +4.4/10.0
- Rent growth +2.5/5.0
- Livability +2.5/5.0
- Condition / age +2.5/5.0
$49,500
🖨 Deal sheet (PDF) 📄 Offer letter ✓ Due diligence
Listing remarks MLS
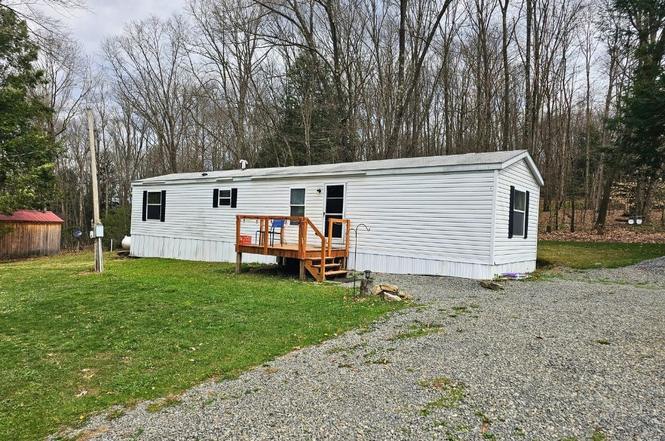
Well-mainained single-wide mobile home with large shed situated in a private, peaceful setting near Walnut Bend. This spacious lot offers convenient access to the scenic Allegheny River and abundant outdoor recreational opportunities including hiking and biking trails, fishing, and small-town charm.
Key facts
- Private setting
- Large shed
- 0.43 acre lot
Tags
Neighborhood map
What this means for you Summary
Snapshot
- This is a 3-bed/1.0-bath manufactured listed at $50k.
Deal economics
- At list price, monthly cash flow is $567 ($7k/yr) — positive.
- The deal already cash-flows at list — no discount required.
- Meets the 1% rule at list price ($1k rent vs $50k).
- Recommended offer: $48k (3.0% below list) — sets the bar for market timing.
Location & tenants
- Location reads: area grade B — affects rentability + tenant quality, not the cash-flow math above.
- Forest Area SD (rural): math 41% / reading 59% proficiency, ranked #415 of 658 in PA (top 63%) — acceptable for families but not a draw, mixed tenant base, ~2y average lease.
- Zoned schools: West Forest El Sch (math 32% / reading 47%, grade F, #947 of 1,518 statewide, top 65%, 114 students, 100% FRL); West Forest Jshs (math 15% / reading 24%, grade F, #391 of 437 statewide, top 89%, 109 students, 63% FRL) — zoned schools average 82% FRL vs 47% district-wide (35 pts higher); higher-poverty schools than district average — tighter screening recommended.
- Zoned-school proficiency averages 30% at this address vs 50% district-wide (-20 pts) — the specific schools serving this property underperform the Forest Area SD average; the district grade overstates school quality for this exact location.
- Market conditions: 52 active listings in the ZIP; 42 units permitted in Venango County in 2024 (0 in 5+ unit buildings).
Forward outlook
- In year one you build about $1k of equity ($342 loan paydown + $1k appreciation (2.2% local appreciation)).
- Venango County population projected at -30% by 2050 — secular population decline; favor cash flow + early exit over multi-decade hold.
- At projected returns (2.2% appreciation + 3.0% rent growth), your $14k cash investment doubles in ~2 years — after that, you're playing with house money.
Negotiation context
- It's been on market 35 days — a 3% lower offer ($48k) is reasonable based on typical stale-listing flexibility.
- Current owner paid $5k; list at $50k implies a 890% gain — meaningful room to come down on a strong offer.
Questions for the listing agent
- It's been on market 35 days. Have you received any prior offers? Is the seller open to a 3% concession, seller financing, or rate buy-down credit?
- Is there a deadline driving the sale (1031 exchange, divorce, estate, relocation)? That informs how much negotiation room exists.
- What's the average days-on-market for RENTAL listings here right now (not sales)? A rising rental-DOM trend means longer vacancies and softer asking-rent achievability than the comps imply.
- What's the recent tenant-quality profile in this submarket — average credit score on applications, eviction rate, late-payment / NSF rate, and stable-employment percentage? A property-management company in the area should have these aggregated.
- How much new for-sale + rental construction is in the pipeline within 1–3 miles? Heavy new supply typically softens prices + rents 12–24 months out; constrained supply supports both.
Investment metrics
- 1% rule
- 2.37% ✓
- Cap rate
- 20.05%
- Cash-on-cash
- 49.12%
- DSCR
- 3.19
- GRM
- 3.5
CMA / ARV
- ARV (median comp)
- $151,752
- List price
- $49,500
- Delta
- -67.38%
- Verdict
- UNDERPRICED
- Comps
- 1 within 2.0 mi
Projected returns pro-forma
2.18% appreciation · 3.0% rent growth · sell at horizon
- IRR
- 53.3%
- Equity multiple
- 3.89×
- Total profit
- $39,997
- Equity at exit
- $19,997
- IRR
- 53.7%
- Equity multiple
- 7.82×
- Total profit
- $94,534
- Equity at exit
- $29,163
Cash invested: $13,860 (down + closing). Projections, not guarantees.
Landlord ↔ Tenant lean methodology
- Overall (STATE)
- 62 Landlord-Friendly
- State Pennsylvania
- 62 Landlord-Friendly · EVEN
- County
- — inherits STATE
- City
- — inherits STATE
ZIP-level market 16301
- Home prices YoY
- 1.0%
- Active inventory
- 52
- Price-to-rent
- 3.5×
Monthly cashflow live
- Estimated rent
- $1,174 medium interval (Pro) →
- Mortgage (P&I)
- −$260
- Tax from tax record
- −$80 /mo · $960/yr
- Insurance
- −$21
- HOA
- −$0
- Vacancy / Maint / Mgmt
- −$247
- Net cashflow
- $567
Break-even live
Sensitivity live
| Price | -10% $595 | -5% $581 | +0% $567 | +5% $553 | +10% $539 |
|---|---|---|---|---|---|
| Rent | -10% $475 | -5% $521 | +0% $567 | +5% $614 | +10% $660 |
| Rate | -1.0pp $592 | -0.5pp $580 | base $567 | +0.5pp $554 | +1.0pp $541 |
UW: 25.0% down · 7.5% · 30yr · 1.5% tax · 5.0% vac · 8.0% maint · 8.0% mgmt
Financing live
Cash to close
- Down payment
- $12,375
- Closing costs
- $1,485
- Reserves months
- —
- Total cash needed
- —
Loan-product check · same deal, 3 products live
Conventional
25% down · 7.5% · 30yr
- Down + closing
- —
- Monthly P&I
- —
- Monthly cashflow
- —
- DSCR
- —
- Eligible?
- —
Personal DTI + credit; lowest rate.
DSCR
20% down · 8.5% · 30yr
- Down + closing
- —
- Monthly P&I
- —
- Monthly cashflow
- —
- DSCR
- —
- Eligible?
- —
No personal income docs; deal must DSCR.
Hard money
10% down · 12.0% · 12mo
- Down + closing
- —
- Monthly P&I
- —
- Monthly cashflow
- —
- DSCR
- —
- Eligible?
- —
Short-term bridge; refi at stabilization.
Listing history 18 events
-
2026-06-21days on market $49,500 Active 35 DOM
-
2026-06-21days on market $49,500 Active 34 DOM
-
2026-06-18days on market $49,500 Active 32 DOM
-
2026-06-17days on market $49,500 Active 31 DOM
-
2026-06-16days on market $49,500 Active 30 DOM
-
2026-06-15days on market $49,500 Active 29 DOM
-
2026-06-13days on market $49,500 Active 27 DOM
-
2026-06-12days on market $49,500 Active 26 DOM
-
2026-06-09days on market $49,500 Active 23 DOM
-
2026-06-08days on market $49,500 Active 22 DOM
-
2026-06-08days on market $49,500 Active 21 DOM
-
2026-06-07days on market $49,500 Active 20 DOM
-
2026-06-04days on market $49,500 Active 17 DOM
-
2026-06-02remarks 385-char remark
-
2026-06-02statusdays on market $49,500 Active 16 DOM
-
2026-05-03status Pending 300-char remark
Show marketing remark (300 chars)
Well-mainained single-wide mobile home with large shed situated in a private, peaceful setting near Walnut Bend. This spacious lot offers convenient access to the scenic Allegheny River and abundant outdoor recreational opportunities including hiking and biking trails, fishing, and small-town charm.
-
2026-04-17$49,500 Active 300-char remark
Show marketing remark (300 chars)
Well-mainained single-wide mobile home with large shed situated in a private, peaceful setting near Walnut Bend. This spacious lot offers convenient access to the scenic Allegheny River and abundant outdoor recreational opportunities including hiking and biking trails, fishing, and small-town charm.
-
2016-02-26soldstatus $5,000 100-char remark
Show marketing remark (100 chars)
This 3 bed 1 bath property is minutes away from the river. Would make a great camp. Being sold AS-IS
ⓘ Source: listings_history table (triggers on properties + properties_extension) + one-shot
backfill from property_details.listing_events for pre-trigger history.
Tax reassessment forecast PA · Partial reset (capped growth)
- Current annual tax
- $960 · $80/mo
- Projected year-2 tax
- $960 · $80/mo
- Expected delta
- $0/yr ($0/mo · 0.0%)
ⓘ Screening estimate from a state-policy table — verify with the county assessor before closing.
Climate risk First Street
- Flood 1/10 Low FEMA zone X (unshaded) · 0% chance over 30 yrs
- Wildfire 4/10 Moderate
- Heat 2/10 Low 7 d/yr ≥92°F today · 17 d/yr by 30 yrs out
- Wind 1/10 Low
- Air quality 2/10 Low 1 unhealthy d/yr today · 2 by 30 yrs out
Nearby sold comps map
Loading sold comps map…
Walkable amenities ~0.75 mi
Loading nearby amenities…
Taxation est. · year 1
- Rental income
- $14,088
- − Mortgage interest
- −$2,773
- − Property taxes
- −$960
- − Insurance
- −$248
- − Repairs & maintenance
- −$1,127
- − Management
- −$1,127
- − Depreciation
- −$1,440
- Taxable income
- $6,414
- Est. tax owed @ 24.0%
- −$1,539
- After-tax cash flow
- $5,268/yr
For passive investors: Depreciation is non-cash, so a rental often shows a tax loss while cash-flowing — sheltering income. Rental losses are passive: they offset passive income freely, and up to $25,000/yr can offset ordinary (W-2) income if you actively participate and your MAGI is under $100k (phasing out to $0 by $150k); unused losses carry forward. On sale, claimed depreciation is recaptured at up to 25%, and gains may owe capital-gains tax (a 1031 exchange can defer both). Figures are a year-1 estimate at your 24.0% rate — not tax advice; consult a CPA.
Schools (NCES district)
- District
- Forest Area SD
- NCES district ID
- 4208280
- Math proficiency
- 41% ▲ 4.00%
- Reading proficiency
- 59% ▲ 3.00%
- Median HH income
- $37,002
- Composite
- 43.52/100
- National rank
- #6452
- State rank
- #415 of 658 in PA
Livability — President
No livability data for this city. (Only ~50 U.S. cities are tracked.)
Census & demographics
- Population (ZIP)
- 15,067
Population outlook (Venango County) Hauer SSP2
- Today (2025)
- 48,827 people
- By 2030
- 46,061 · -5.7%
- By 2040
- 39,989 · -18.1%
- By 2050
- 34,094 · -30.2%
- By 2075
- 22,500 · -53.9%
- By 2100
- 13,659 · -72.0%
Race, ethnicity, and origin ACS 2023
- Neighborhood character
- Predominantly White (93%)
- Race & ethnicity
- White 93% Two or more races 4% Hispanic / Latino 1%
- Common ancestry
- Romanian 7% Iranian 3% Italian 2%
- Foreign-born
- 1%
Political lean MEDSL · Venango
- 2024 margin
- Solid R (+42.1) · D 28.5% · R 70.6%
- 2008→2024 swing
- -22.9pp toward R · 2008: -19.2pp · 2024: -42.1pp
- All cycles
- 2024: R+42.1 2020: R+41.4 2016: R+42.4 2012: R+26.3 2008: R+19.2
Not yet ingested
- Civics
- —
Market trends
- HPI YoY
- ▲ 2.18%
- Current HPI
- 218.0124
- Rent YoY
- —
- Metro
- —
- State GDP YoY
- ▲ 1.68%
- F500 in state
- 34
Industry mix (Fortune 500 HQ in PA)
| Industry | F500 HQs | Revenue |
|---|---|---|
| Healthcare | 2 | $309B |
|
||
| Insurance | 2 | $27B |
|
||
| Telecommunications / Media | 1 | $124B |
|
||
| Industrial Distribution | 1 | $22B |
|
||
| Financial Services | 1 | $20B |
|
||
| Chemicals / Materials | 1 | $18B |
|
||
Price history
+890.0% since first listed3 events — show timeline
- 2026-05-03 Pending — West Penn MLS
- 2026-04-17 Listed $49,500 West Penn MLS
- 2016-02-26 Sold (MLS) $5,000 AVBREALTORS
Property tax history
-1.3%/yrLatest (2026): $960 · -1.8% YoY. Source: county tax records.
Cash-flow waterfall
monthlySold comps — $/sqft
last 12 mo · ≤1 miLoading sold comps…