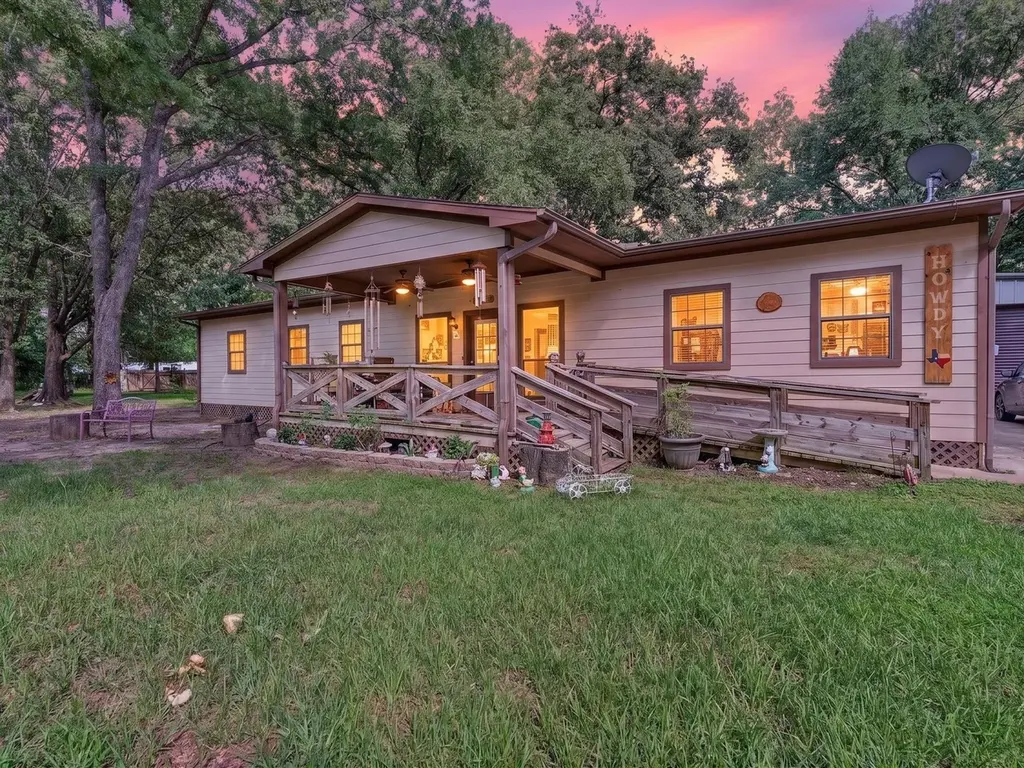
285 Mini Ln · West Livingston, TX
Flood risk 1/10 · Minimal
- FEMA flood zone
- X (unshaded)
- Chance of flooding over 30 yrs
- 0.0%
- Est. flood insurance / yr
- $507 – $1,088
Fire risk 3/10 · Minor
- Est. fire insurance / yr
- $1,222 – $2,270
Heat risk 8/10 · Major
- Hot days now (above 112°F)
- 7 days/yr
- Hot days in 30 yrs
- 24 days/yr
Wind risk 8/10 · Major
- Chance of severe wind over 30 yrs
- 99.0%
Air-quality risk 1/10 · Minimal
- Unhealthy air days now
- 0 days/yr
- Unhealthy air days in 30 yrs
- 0 days/yr
Risk factors via First Street. Map © Google.
Why this score? — see what drove the D+ grade
The composite is a weighted blend of 9 inputs, each scored 0–100. Each bar is that input's sub-score; the figure is the points it added to the 100-point composite (weight × sub-score).
- ARV discount +15.0/15.0
- Cash flow +14.6/30.0
- 1% rule +4.4/10.0
- DSCR +4.4/10.0
- Schools +3.2/10.0
- Rent growth +2.5/5.0
- Livability +2.5/5.0
- Condition / age +2.5/5.0
- Appreciation +0.0/10.0
$165,000
🖨 Deal sheet (PDF) 📄 Offer letter ✓ Due diligence
Listing remarks
Charming and thoughtfully updated 2-bedroom, 2-bath home situated on an expansive ~0.5-acre road-to-road lot in Livingston. Rebuilt in 2010, this home offers a warm and inviting feel with sheetrock walls, granite countertops, oak cabinetry, tile flooring, spacious bedrooms, and an open living layout with abundant natural light. Enjoy peaceful outdoor living from the oversized covered front porch or the more private backyard surrounded by mature shade trees. The property also features a wheelchair ramp, plenty of room for a future pool or outdoor additions, and a large detached garage/workshop with electricity, water, dual garage doors, and a separate private room ideal for guests, hobbies,
Key facts
- Expansive lot
- Private backyard
- Updated home
Tags
Property features AI
Finance
- Other: Seller disclosure available
- HOA & community: Association: Foresters Retreat; Annual association fee of $72; Association covers common areas and recreation facilities
Exterior
- Parking: Detached oversized garage; 4 garage spaces
- Utilities: Public water; Septic tank sewer
- Home design: Residential property; Built in 2010; Block foundation
- Construction: Cement siding and wood siding; Composition roof
- Exterior features: Cleared lot
Interior
- Bedrooms: Primary bedroom on first floor; Additional bedroom on first floor; Total of 3 rooms (includes living room and bedrooms)
- Bathrooms: 2 full bathrooms
- Heating & cooling: Central heating (electric); Central air conditioning (electric)
- Interior features: Ceiling fans
Neighborhood map
What this means for you Summary
Snapshot
- This is a 3-bed/2.0-bath single-family listed at $165k.
Deal economics
- At list price, monthly cash flow is $39 ($466/yr) — positive.
- The deal already cash-flows at list — no discount required.
- To meet the 1% rule (rent ≥ 1% of price), the offer needs to be $155k (6.3% below list).
- Recommended offer: $155k (6.3% below list) — sets the bar for 1% rule.
- Cap rate 6.6% vs local median 2.4% in West Livingston — top-decile yield for the area; either an underpriced asset or a hidden risk that comps aren't pricing in. Stress-test before assuming the spread holds.
Location & tenants
- Location reads 50/100 on livability (#1,501 in TX) — a working-class tenant base; expect higher turnover. Strengths: cost of living A+, housing A+; Watch: crime F, amenities F, commute F.
- Livingston ISD (rural): math 38% / reading 39% proficiency, ranked #459 of 826 in TX (top 56%) — families likely to look elsewhere, expect single-tenant / working-renter base with shorter leases.
- Zoned schools: Timber Creek El (math 56% / reading 47%, grade C-, #808 of 4,322 statewide, top 19%, 522 students, 74% FRL); Livingston J H (math 30% / reading 32%, grade F, #1,015 of 1,662 statewide, top 62%, 893 students, 62% FRL); Livingston H S (math 35% / reading 46%, grade F, #798 of 1,632 statewide, top 49%, 1,128 students, 51% FRL) — zoned schools at 63% FRL track the district average.
- Market conditions: 1202 active listings in the ZIP; 2 comparable units currently listed for rent nearby; 769 units permitted in Polk County in 2024 (0 in 5+ unit buildings).
Forward outlook
- Local home prices are declining (-3.0%/yr); year-one equity from $1k of loan paydown is wiped out by about $5k of value loss. Plan a longer hold.
- Polk County population projected at +16% by 2050 — long-run rental-demand tailwind backs the buy-and-hold thesis.
Negotiation context
- It's been on market 22 days — a 2% lower offer ($163k) is reasonable based on typical stale-listing flexibility.
- 2 sale attempts with the ask held roughly flat each time — persistent listings suggest the price (not the market) is what's stuck; bring a comps-based counter.
- Current owner paid $20k; list at $165k implies a 725% gain — meaningful room to come down on a strong offer.
Risks & watch-outs
- Climate carrying-cost: severe wind risk, 99% chance of damaging wind over 30y; extreme-heat days projected 7→24/yr by 2055 (HVAC capex compounding) — expect insurance premiums to compound above CPI over the hold.
Questions for the listing agent
- What does the HOA fee cover, when was the last increase, and are there any pending special assessments or reserve-fund shortfalls?
- Is there a deadline driving the sale (1031 exchange, divorce, estate, relocation)? That informs how much negotiation room exists.
- Schools are F-rated, which usually means shorter tenancies and higher turnover. Who's the typical renter profile here, and what's been the actual vacancy rate?
- Crime grade is F in this area — have there been break-ins, vandalism, or insurance claims at this property in the last 3 years? What carrier currently insures it and at what premium?
- The area grade is low — what's the realistic commute time and amenity access for the typical tenant pool here? Any planned neighborhood developments (good or bad) we should know about?
- What's the average days-on-market for RENTAL listings here right now (not sales)? A rising rental-DOM trend means longer vacancies and softer asking-rent achievability than the comps imply.
- What's the recent tenant-quality profile in this submarket — average credit score on applications, eviction rate, late-payment / NSF rate, and stable-employment percentage? A property-management company in the area should have these aggregated.
- How much new for-sale + rental construction is in the pipeline within 1–3 miles? Heavy new supply typically softens prices + rents 12–24 months out; constrained supply supports both.
Investment metrics
- 1% rule
- 0.94% ✗
- Cap rate
- 6.58%
- Cash-on-cash
- 1.01%
- DSCR
- 1.04
- GRM
- 8.9
CMA / ARV
- ARV (median comp)
- $306,929
- List price
- $165,000
- Delta
- -23.44%
- Verdict
- UNDERPRICED
- Comps
- 9 within 2.0 mi
Show comp detail 8 sales within ~0.75 mi
| Address | Dist | Beds/Ba | Sqft | Sold | Price | $/sf | Match |
|---|---|---|---|---|---|---|---|
| 3183 Mangum Rd | 0.26mi | 3/2.0 | 1,273 (-2%) | 20mo | $179,000 | $141 | 68 |
| 450 Windwood Dr | 0.45mi | 3/2.0 | 1,340 (+3%) | 13mo | $218,000 | $163 | 63 |
| 738 Windwood Dr | 0.26mi | 3/2.0 | 1,240 (-5%) | 22mo | $90,000 | $73 | 61 |
| 3195 Mangum Rd | 0.25mi | 3/2.0 | 1,200 (-8%) | 21mo | $179,000 | $149 | 58 |
| 1090 Meridian | 0.54mi | 3/2.0 | 1,240 (-5%) | 16mo | $79,900 | $64 | 54 |
| 2787 Mangum Rd | 0.56mi | 2/1.5 (-1) | 1,400 (+8%) | 9mo | $290,000 | $207 | 47 |
| 178 Windwood Dr | 0.65mi | 2/2.0 (-1) | 1,386 (+7%) | 17mo | $165,000 | $119 | 40 |
| 115 Dick | 0.50mi | 2/2.0 (-1) | 1,112 (-14%) | 14mo | $165,000 | $148 | 36 |
Match score weights: distance 35% · size 25% · config 20% · recency 20%. Top-matched comps best support the ARV.
Projected returns pro-forma
-3.0% appreciation · 3.0% rent growth · sell at horizon
- IRR
- -14.7%
- Equity multiple
- 0.48×
- Total profit
- $-24,215
- Equity at exit
- $24,602
- IRR
- -5.9%
- Equity multiple
- 0.62×
- Total profit
- $-17,702
- Equity at exit
- $14,266
Cash invested: $46,200 (down + closing). Projections, not guarantees.
Landlord ↔ Tenant lean methodology
- Overall (STATE)
- 87 Strongly Landlord-Friendly
- State Texas
- 87 Strongly Landlord-Friendly · R+5
- County
- — inherits STATE
- City
- — inherits STATE
ZIP-level market 77351
- Home prices YoY
- -14.8%
- Active inventory
- 1202
- Price-to-rent
- 8.9×
Monthly cashflow live
- Estimated rent
- $1,546 medium interval (Pro) →
- Mortgage (P&I)
- −$865
- Tax from tax record
- −$243 /mo · $2,912/yr
- Insurance
- −$69
- HOA
- −$6
- Vacancy / Maint / Mgmt
- −$325
- Net cashflow
- $39
Break-even live
Sensitivity live
| Price | -10% $132 | -5% $86 | +0% $39 | +5% $-8 | +10% $-55 |
|---|---|---|---|---|---|
| Rent | -10% $-83 | -5% $-22 | +0% $39 | +5% $100 | +10% $161 |
| Rate | -1.0pp $122 | -0.5pp $81 | base $39 | +0.5pp $-4 | +1.0pp $-47 |
UW: 25.0% down · 7.5% · 30yr · 1.5% tax · 5.0% vac · 8.0% maint · 8.0% mgmt
Financing live
Cash to close
- Down payment
- $41,250
- Closing costs
- $4,950
- Reserves months
- —
- Total cash needed
- —
Loan-product check · same deal, 3 products live
Conventional
25% down · 7.5% · 30yr
- Down + closing
- —
- Monthly P&I
- —
- Monthly cashflow
- —
- DSCR
- —
- Eligible?
- —
Personal DTI + credit; lowest rate.
DSCR
20% down · 8.5% · 30yr
- Down + closing
- —
- Monthly P&I
- —
- Monthly cashflow
- —
- DSCR
- —
- Eligible?
- —
No personal income docs; deal must DSCR.
Hard money
10% down · 12.0% · 12mo
- Down + closing
- —
- Monthly P&I
- —
- Monthly cashflow
- —
- DSCR
- —
- Eligible?
- —
Short-term bridge; refi at stabilization.
Rent comps 2 comps
| Address | Beds | Baths | Sqft | Rent | $/sqft | DOM | Units | Dist |
|---|---|---|---|---|---|---|---|---|
| 446 Lexington Livingston, TX | 4.0 | 2.0 | 900 | $1,200 | $1.33 | 6d | 1 | 0.54mi |
| 360 Terlingua Livingston, TX | 3.0 | 2.0 | 1680 | $1,575 | $0.94 | 26d | 1 | 0.58mi |
HOA detail
- Monthly dues
- $6 · $72/yr
- Likely covers
- waterelectricpool
Listing history 12 events
-
2026-06-13days on market $165,000 Pending 22 DOM
-
2026-06-09days on market $165,000 Pending 21 DOM
-
2026-06-08days on market $165,000 Pending 20 DOM
-
2026-06-07statusdays on market $165,000 Pending 19 DOM
-
2026-06-04days on market $165,000 Active 16 DOM
-
2026-06-03days on market $165,000 Active 15 DOM
-
2026-06-02days on market $165,000 Active 14 DOM
-
2026-06-01days on market $165,000 Active 13 DOM
-
2026-05-31days on market $165,000 Active 12 DOM
-
2026-05-03historical
-
2026-04-29$235,000 Active
-
2003-06-02soldstatus $20,000
ⓘ Source: listings_history table (triggers on properties + properties_extension) + one-shot
backfill from property_details.listing_events for pre-trigger history.
Tax reassessment forecast TX · Resets to sale price
- Current annual tax
- $2,912 · $243/mo
- Projected year-2 tax
- $3,020 · $252/mo
- Expected delta
- +$107/yr (+$9/mo · 3.7%)
ⓘ Screening estimate from a state-policy table — verify with the county assessor before closing.
Climate risk First Street
- Flood 1/10 Low FEMA zone X (unshaded) · 0% chance over 30 yrs
- Wildfire 3/10 Moderate
- Heat 8/10 Severe 7 d/yr ≥112°F today · 24 d/yr by 30 yrs out
- Wind 8/10 Severe 99% chance of damaging wind over 30 yrs
- Air quality 1/10 Low 0 unhealthy d/yr today · 0 by 30 yrs out
Nearby sold comps map
Loading sold comps map…
Walkable amenities ~0.75 mi
Loading nearby amenities…
Taxation est. · year 1
- Rental income
- $18,555
- − Mortgage interest
- −$9,243
- − Property taxes
- −$2,912
- − Insurance
- −$825
- − Repairs & maintenance
- −$1,484
- − Management
- −$1,484
- − HOA
- −$72
- − Depreciation
- −$4,800
- Taxable loss
- −$2,266
- Est. tax savings @ 24.0%
- +$544
- After-tax cash flow
- $1,010/yr
For passive investors: Depreciation is non-cash, so a rental often shows a tax loss while cash-flowing — sheltering income. Rental losses are passive: they offset passive income freely, and up to $25,000/yr can offset ordinary (W-2) income if you actively participate and your MAGI is under $100k (phasing out to $0 by $150k); unused losses carry forward. On sale, claimed depreciation is recaptured at up to 25%, and gains may owe capital-gains tax (a 1031 exchange can defer both). Figures are a year-1 estimate at your 24.0% rate — not tax advice; consult a CPA.
Schools (NCES district)
- District
- Livingston ISD
- NCES district ID
- 4827780
- Math proficiency
- 38% ▼ -1.00%
- Reading proficiency
- 39% ▲ 3.00%
- Median HH income
- $39,531
- Composite
- 32.25/100
- National rank
- #5767
- State rank
- #459 of 826 in TX
Livability — West Livingston
- Score
- 50/100
- State rank
- #1501
- US rank
- #25668
Category grades
Schools grade is shown separately in the Schools card above.
Census & demographics
- Census place
- West Livingston, TX
- County
- Polk County · 37,143 people
- Metro
- nan
- Population (ZIP)
- 37,143
- Household income
- $66,834
- Rent vs Own
- Severe rent burden
- 608.0
Population outlook (Polk County) Hauer SSP2
- Today (2025)
- 51,049 people
- By 2030
- 53,243 · +4.3%
- By 2040
- 56,528 · +10.7%
- By 2050
- 59,243 · +16.1%
- By 2075
- 63,528 · +24.4%
- By 2100
- 60,376 · +18.3%
Race, ethnicity, and origin ACS 2023
- Neighborhood character
- Predominantly White (72%)
- Race & ethnicity
- White 72% Hispanic / Latino 14% Two or more races 9% Black 8% Native American 2%
- Hispanic origin (detail)
- Mexican 11%
- Common ancestry
- Lithuanian 2% Italian 2% Portuguese 2%
- Foreign-born
- 5% · Canada
- Languages at home
- 88% English-only · Spanish 10%
Political lean MEDSL · Polk
- 2024 margin
- Solid R (+58.9) · D 20.2% · R 79.1%
- 2008→2024 swing
- -21.7pp toward R · 2008: -37.2pp · 2024: -58.9pp
- All cycles
- 2024: R+58.9 2020: R+54.5 2016: R+56.5 2012: R+48.2 2008: R+37.2
Not yet ingested
- Civics
- —
Market trends
- HPI YoY
- ▼ -31.11%
- Current HPI
- 178.5316
- Rent YoY
- —
- Metro
- nan
- State GDP YoY
- ▲ 3.95%
- F500 in state
- 110
Industry mix (Fortune 500 HQ in TX)
| Industry | F500 HQs | Revenue |
|---|---|---|
| Energy | 16 | $1,198B |
|
||
| Technology | 5 | $198B |
|
||
| Engineering / Construction | 4 | $72B |
|
||
| Energy Services | 3 | $60B |
|
||
| Utilities | 3 | $41B |
|
||
| Healthcare | 2 | $330B |
|
||
Price history
+725.0% since first listed6 events — show timeline
- 2026-06-11 Pending — HARMLS
- 2026-06-06 Pending — HARMLS
- 2026-05-19 Listed $165,000 HARMLS
- 2026-05-03 Listing Removed — HARMLS
- 2026-04-29 Listed $235,000 HARMLS
- 2003-06-02 Sold (Public Records) $20,000 Public Records
Property tax history
+5.8%/yrLatest (2025): $2,912 · +7.3% YoY. Source: county tax records.
Cash-flow waterfall
monthlySold comps — $/sqft
last 12 mo · ≤1 miLoading sold comps…