 🏗️ New Construction
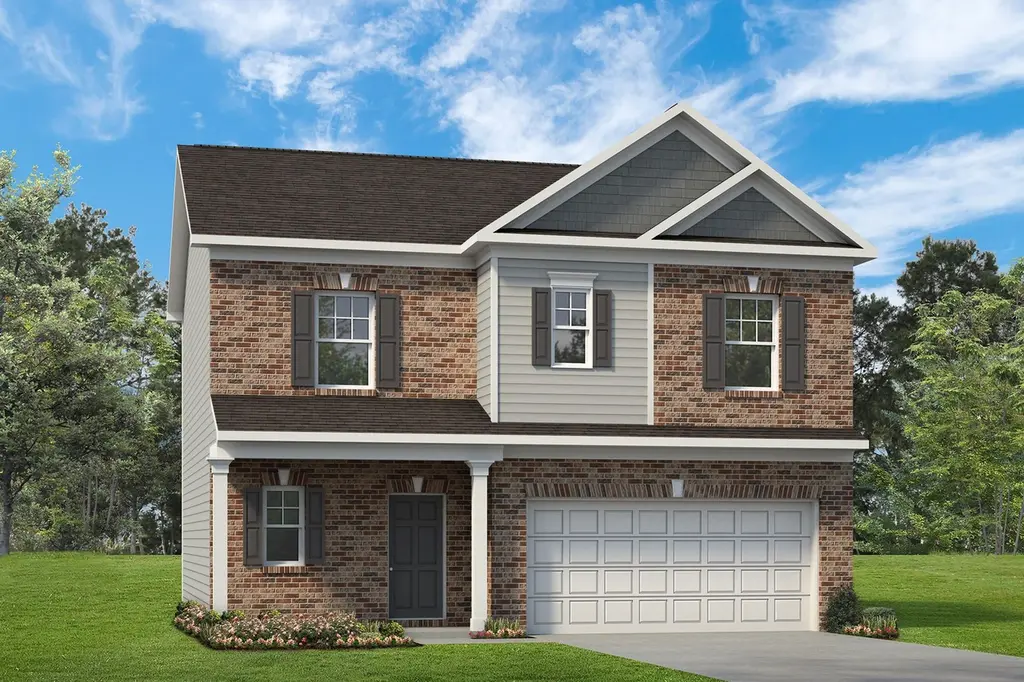
The Benson II Plan · New Market, AL
Flood risk 1/10 · Minimal
- FEMA flood zone
- X (unshaded)
- Chance of flooding over 30 yrs
- 0.0%
- Est. flood insurance / yr
- $507 – $1,088
Fire risk 3/10 · Minor
- Est. fire insurance / yr
- $916 – $1,700
Heat risk 5/10 · Moderate
- Hot days now (above 104°F)
- 7 days/yr
- Hot days in 30 yrs
- 21 days/yr
Wind risk 4/10 · Minor
- Chance of severe wind over 30 yrs
- 15.0%
Air-quality risk 2/10 · Minimal
- Unhealthy air days now
- 1 days/yr
- Unhealthy air days in 30 yrs
- 2 days/yr
Risk factors via First Street. Map © Google.
Why this score? — see what drove the F grade
The composite is a weighted blend of 9 inputs, each scored 0–100. Each bar is that input's sub-score; the figure is the points it added to the 100-point composite (weight × sub-score).
- ARV discount +7.5/15.0
- Cash flow +7.1/30.0
- Schools +3.7/10.0
- Livability +3.0/5.0
- Rent growth +2.5/5.0
- Condition / age +2.5/5.0
- 1% rule +1.9/10.0
- DSCR +1.3/10.0
- Appreciation +0.0/10.0
$246,900
🖨 Deal sheet (PDF) 📄 Offer letter ✓ Due diligence
Listing remarks MLS
A wide, light-filled entry welcomes you into the Benson II and leads to a connected living-dining-kitchen layout that spans the entire width of the home. Its well-designed kitchen maximizes efficiency with a countertop workspace, a center island with a sink, a pantry, and an optional planning desk. Upstairs, you'll find the owner's ensuite with a spacious closet, two additional bedrooms, a bath with a conveniently located laundry room, and a loft with a storage closet that can be optioned to a fourth bedroom.
Key facts
- Pantry
- Light-filled entry
- Countertop workspace
Tags
Neighborhood map
What this means for you Summary
Snapshot
- This is a 3-bed/2.5-bath single-family listed at $247k.
Deal economics
- At list price, monthly cash flow is $-394 ($-5k/yr) — negative.
- To cash-flow at today's rent, offer at most $220k (10.7% below list).
- To meet the 1% rule (rent ≥ 1% of price), the offer needs to be $193k (21.9% below list).
- Recommended offer: $193k (21.9% below list) — sets the bar for 1% rule.
Location & tenants
- Location reads 60/100 on livability (#304 in AL) — a middle-class / working-renter tenant base. Strengths: crime A+, cost of living A+, housing B; Watch: schools D+, amenities F, commute F.
- Madison County (rural): math 27% / reading 56% proficiency, ranked #19 of 129 in AL (top 15%) — families likely to look elsewhere, expect single-tenant / working-renter base with shorter leases.
- Market conditions: 391 active listings in the ZIP; 9 comparable units currently listed for rent nearby; rentals at typical pace (median 25d on market — plan ~3-4 weeks tenant-placement turnaround); 44% of comp listings sitting > 30 days — soft ceiling on asking rent; solid renter incomes; 4,709 units permitted in Madison County in 2024 (1,186 in 5+ unit buildings).
Forward outlook
- Local home prices are declining (-3.0%/yr); year-one equity from $2k of loan paydown is wiped out by about $8k of value loss. Plan a longer hold.
- Madison County population projected at +18% by 2050 — long-run rental-demand tailwind backs the buy-and-hold thesis.
Negotiation context
- It's been on market 231 days — a 12% lower offer ($217k) is reasonable based on typical stale-listing flexibility.
Risks & watch-outs
- Climate carrying-cost: extreme-heat days projected 7→21/yr by 2055 (HVAC capex compounding) — expect insurance premiums to compound above CPI over the hold.
Questions for the listing agent
- What do current leases actually rent for vs. the listed asking? Can we see a recent rent roll and the last 12 months of T-12 income?
- It's been on market 231 days. Have you received any prior offers? Is the seller open to a 22% concession, seller financing, or rate buy-down credit?
- Why hasn't it sold? Are there any deal-killer items the seller is aware of (foundation, flood, title, zoning, code violations)?
- Is there a deadline driving the sale (1031 exchange, divorce, estate, relocation)? That informs how much negotiation room exists.
- Schools are D-rated, which usually means shorter tenancies and higher turnover. Who's the typical renter profile here, and what's been the actual vacancy rate?
- The area grade is low — what's the realistic commute time and amenity access for the typical tenant pool here? Any planned neighborhood developments (good or bad) we should know about?
- What's the average days-on-market for RENTAL listings here right now (not sales)? A rising rental-DOM trend means longer vacancies and softer asking-rent achievability than the comps imply.
- What's the recent tenant-quality profile in this submarket — average credit score on applications, eviction rate, late-payment / NSF rate, and stable-employment percentage? A property-management company in the area should have these aggregated.
- How much new for-sale + rental construction is in the pipeline within 1–3 miles? Heavy new supply typically softens prices + rents 12–24 months out; constrained supply supports both.
Investment metrics
- 1% rule
- 0.69% ✗
- Cap rate
- 4.59%
- Cash-on-cash
- -6.09%
- DSCR
- 0.73
- GRM
- 12.0
CMA / ARV
- ARV (median comp)
- $277,500
- List price
- $246,900
- Delta
- -11.03%
- Verdict
- UNDERPRICED
- Comps
- 20 within 1.0 mi
Show comp detail 12 sales within ~0.75 mi
| Address | Dist | Beds/Ba | Sqft | Sold | Price | $/sf | Match |
|---|---|---|---|---|---|---|---|
| 221 Roman Randall Rd | 0.02mi | 3/2.5 | 1,813 (0%) | 1mo | $270,365 | $149 | 99 |
| 218 Roman Randall Rd | 0.00mi | 3/2.5 | 1,813 (0%) | 3mo | $268,495 | $148 | 98 |
| 156 County Lake Rd | 0.17mi | 3/2.0 | 1,768 (-2%) | 4mo | $275,000 | $156 | 83 |
| 215 Roman Randall Rd | 0.03mi | 3/2.0 | 1,676 (-8%) | 2mo | $280,000 | $167 | 83 |
| 213 Roman Randall Rd | 0.04mi | 4/2.0 (+1) | 1,748 (-4%) | 10mo | $299,800 | $172 | 77 |
| 205 Roman Randall Rd | 0.08mi | 3/2.0 | 1,947 (+7%) | 9mo | $320,000 | $164 | 75 |
| 5655 Maysville Rd | 0.39mi | 3/2.0 | 1,939 (+7%) | 9mo | $450,000 | $232 | 60 |
| 3492 Winchester Rd E | 0.48mi | 3/2.0 | 1,559 (-14%) | 0mo | $235,000 | $151 | 52 |
| 5734 Maysville Rd | 0.57mi | 3/2.0 | 1,700 (-6%) | 12mo | $300,000 | $176 | 51 |
| 147 Rose Valley Dr | 0.62mi | 3/2.0 | 1,620 (-11%) | 7mo | $291,780 | $180 | 45 |
| 152 Rose Valley Dr | 0.63mi | 3/2.0 | 1,620 (-11%) | 9mo | $264,900 | $164 | 43 |
| 122 Burdine St | 0.62mi | 4/2.0 (+1) | 1,964 (+8%) | 8mo | $297,900 | $152 | 43 |
Match score weights: distance 35% · size 25% · config 20% · recency 20%. Top-matched comps best support the ARV.
Projected returns pro-forma
-3.0% appreciation · 3.0% rent growth · sell at horizon
- IRR
- -26.8%
- Equity multiple
- 0.10×
- Total profit
- $-70,044
- Equity at exit
- $41,376
- IRR
- -24.2%
- Equity multiple
- -0.20×
- Total profit
- $-93,202
- Equity at exit
- $23,993
Cash invested: $77,700 (down + closing). Projections, not guarantees.
Landlord ↔ Tenant lean methodology
- Overall (STATE)
- 90 Strongly Landlord-Friendly
- State Alabama
- 90 Strongly Landlord-Friendly · R+15
- County
- — inherits STATE
- City
- — inherits STATE
ZIP-level market 35761
- Home prices YoY
- -9.3%
- Active inventory
- 391
- Price-to-rent
- 10.7×
Monthly cashflow live
- Estimated rent
- $1,929 high interval (Pro) →
- Mortgage (P&I)
- −$1,455
- Tax est. 1.5%
- −$347 /mo · $4,162/yr
- Insurance
- −$116
- HOA
- −$0
- Vacancy / Maint / Mgmt
- −$405
- Net cashflow
- $-394
Break-even live
Sensitivity live
| Price | -10% $-202 | -5% $-298 | +0% $-394 | +5% $-490 | +10% $-586 |
|---|---|---|---|---|---|
| Rent | -10% $-547 | -5% $-470 | +0% $-394 | +5% $-318 | +10% $-242 |
| Rate | -1.0pp $-254 | -0.5pp $-324 | base $-394 | +0.5pp $-466 | +1.0pp $-539 |
UW: 25.0% down · 7.5% · 30yr · 1.5% tax · 5.0% vac · 8.0% maint · 8.0% mgmt
Financing live
Cash to close
- Down payment
- $69,375
- Closing costs
- $8,325
- Reserves months
- —
- Total cash needed
- —
Loan-product check · same deal, 3 products live
Conventional
25% down · 7.5% · 30yr
- Down + closing
- —
- Monthly P&I
- —
- Monthly cashflow
- —
- DSCR
- —
- Eligible?
- —
Personal DTI + credit; lowest rate.
DSCR
20% down · 8.5% · 30yr
- Down + closing
- —
- Monthly P&I
- —
- Monthly cashflow
- —
- DSCR
- —
- Eligible?
- —
No personal income docs; deal must DSCR.
Hard money
10% down · 12.0% · 12mo
- Down + closing
- —
- Monthly P&I
- —
- Monthly cashflow
- —
- DSCR
- —
- Eligible?
- —
Short-term bridge; refi at stabilization.
Rent comps 9 comps
| Address | Beds | Baths | Sqft | Rent | $/sqft | DOM | Units | Dist |
|---|---|---|---|---|---|---|---|---|
| 104 Grove Hill Cir New Market, AL | 3.0 | 2.0 | 2400 | $2,095 | $0.87 | 22d | 1 | 0.52mi |
| 127 Tine Ln New Market, AL | 3.0 | 2.0 | 1542 | $2,100 | $1.36 | 15d | 1 | 0.61mi |
| 108 Eagles Watch Ct New Market, AL | 3.0 | 2.0 | 1551 | $1,795 | $1.16 | 24d | 1 | 0.87mi |
| 105 Fawn Forest Dr New Market, AL | 4.0 | 2.0 | 1800 | $1,700 | $0.94 | 45d | 1 | 0.90mi |
| 101 Fawn Forest Dr New Market, AL | 3.0 | 2.0 | 1630 | $1,750 | $1.07 | 45d | 1 | 0.93mi |
| 157 Olde Hearth Rd New Market, AL | 3.0 | 2.0 | 1466 | $1,664 | $1.14 | 22d | 1 | 0.95mi |
| 165 Olde Hearth Rd New Market, AL | 3.0 | 2.0 | 1355 | $1,684 | $1.24 | 45d | 1 | 0.95mi |
| 174 River Pointe Dr New Market, AL | 3.0 | 2.0 | 1620 | $1,719 | $1.06 | 24d | 1 | 1.06mi |
| 156 Cranbrook Dr New Market, AL | 3.0 | 3.0 | 1687 | $1,556 | $0.92 | 45d | 1 | 1.17mi |
Listing history 16 events
-
2026-06-18days on market $246,900 Active 231 DOM
-
2026-06-17days on market $246,900 Active 230 DOM
-
2026-06-16days on market $246,900 Active 229 DOM
-
2026-06-15days on market $246,900 Active 228 DOM
-
2026-06-14days on market $246,900 Active 226 DOM
-
2026-06-10days on market $246,900 Active 223 DOM
-
2026-06-09days on market $246,900 Active 222 DOM
-
2026-06-08days on market $246,900 Active 221 DOM
-
2026-06-07days on market $246,900 Active 220 DOM
-
2026-06-02days on market $246,900 Active 215 DOM
-
2026-06-01days on market $246,900 Active 214 DOM
-
2026-05-31days on market $246,900 Active 213 DOM
-
2026-05-30pricedays on market $246,900 Active 212 DOM
-
2026-04-01price $251,900 514-char remark
Show marketing remark (514 chars)
A wide, light-filled entry welcomes you into the Benson II and leads to a connected living-dining-kitchen layout that spans the entire width of the home. Its well-designed kitchen maximizes efficiency with a countertop workspace, a center island with a sink, a pantry, and an optional planning desk. Upstairs, you'll find the owner's ensuite with a spacious closet, two additional bedrooms, a bath with a conveniently located laundry room, and a loft with a storage closet that can be optioned to a fourth bedroom.
-
2026-03-17price $250,900 514-char remark
Show marketing remark (514 chars)
A wide, light-filled entry welcomes you into the Benson II and leads to a connected living-dining-kitchen layout that spans the entire width of the home. Its well-designed kitchen maximizes efficiency with a countertop workspace, a center island with a sink, a pantry, and an optional planning desk. Upstairs, you'll find the owner's ensuite with a spacious closet, two additional bedrooms, a bath with a conveniently located laundry room, and a loft with a storage closet that can be optioned to a fourth bedroom.
-
2025-10-31$249,900 Active 514-char remark
Show marketing remark (514 chars)
A wide, light-filled entry welcomes you into the Benson II and leads to a connected living-dining-kitchen layout that spans the entire width of the home. Its well-designed kitchen maximizes efficiency with a countertop workspace, a center island with a sink, a pantry, and an optional planning desk. Upstairs, you'll find the owner's ensuite with a spacious closet, two additional bedrooms, a bath with a conveniently located laundry room, and a loft with a storage closet that can be optioned to a fourth bedroom.
ⓘ Source: listings_history table (triggers on properties + properties_extension) + one-shot
backfill from property_details.listing_events for pre-trigger history.
Climate risk First Street
- Flood 1/10 Low FEMA zone X (unshaded) · 0% chance over 30 yrs
- Wildfire 3/10 Moderate
- Heat 5/10 Major 7 d/yr ≥104°F today · 21 d/yr by 30 yrs out
- Wind 4/10 Moderate 15% chance of damaging wind over 30 yrs
- Air quality 2/10 Low 1 unhealthy d/yr today · 2 by 30 yrs out
Nearby sold comps map
Loading sold comps map…
Walkable amenities ~0.75 mi
Loading nearby amenities…
Taxation est. · year 1
- Rental income
- $23,143
- − Mortgage interest
- −$15,544
- − Property taxes
- −$4,162
- − Insurance
- −$1,388
- − Repairs & maintenance
- −$1,851
- − Management
- −$1,851
- − Depreciation
- −$8,073
- Taxable loss
- −$9,727
- Est. tax savings @ 24.0%
- +$2,335
- After-tax cash flow
- $-2,396/yr
For passive investors: Depreciation is non-cash, so a rental often shows a tax loss while cash-flowing — sheltering income. Rental losses are passive: they offset passive income freely, and up to $25,000/yr can offset ordinary (W-2) income if you actively participate and your MAGI is under $100k (phasing out to $0 by $150k); unused losses carry forward. On sale, claimed depreciation is recaptured at up to 25%, and gains may owe capital-gains tax (a 1031 exchange can defer both). Figures are a year-1 estimate at your 24.0% rate — not tax advice; consult a CPA.
Schools (NCES district)
- District
- Madison County
- NCES district ID
- 0102220
- Math proficiency
- 27% ▼ -32.00%
- Reading proficiency
- 56% ▼ -1.00%
- Median HH income
- $66,058
- Composite
- 37.15/100
- National rank
- #4483
- State rank
- #19 of 129 in AL
Livability — New Market
- Score
- 60/100
- State rank
- #304
- US rank
- #19258
Category grades
Schools grade is shown separately in the Schools card above.
Census & demographics
- County
- Madison County · 380,832 people
- City population
- 13,557
- Metro
- Huntsville, AL
- Population (ZIP)
- 13,557
- Household income
- $79,440
- Rent vs Own
- Severe rent burden
- 220.0
Population outlook (Madison County) Hauer SSP2
- Today (2025)
- 392,086 people
- By 2030
- 409,788 · +4.5%
- By 2040
- 440,557 · +12.4%
- By 2050
- 460,990 · +17.6%
- By 2075
- 502,872 · +28.3%
- By 2100
- 513,623 · +31.0%
Race, ethnicity, and origin ACS 2023
- Neighborhood character
- Predominantly White (76%)
- Race & ethnicity
- White 76% Black 15% Two or more races 6% Hispanic / Latino 3%
- Common ancestry
- Italian 3% Serbian 2% Iranian 2%
- Foreign-born
- 2% · Canada
- Languages at home
- 98% English-only · German/W. Germanic 1% Spanish 1%
Political lean MEDSL · Madison
- 2024 margin
- Lean R (+9.0) · D 44.7% · R 53.7% · Other 1.6%
- 2008→2024 swing
- +6.0pp toward D · 2008: -14.9pp · 2024: -9.0pp
- All cycles
- 2024: R+9.0 2020: R+8.0 2016: R+16.8 2012: R+18.7 2008: R+14.9
Not yet ingested
- Civics
- —
Market trends
- HPI YoY
- ▼ -26.88%
- Current HPI
- 261.8281
- Rent YoY
- —
- Metro
- Huntsville, AL
- State GDP YoY
- ▲ 2.94%
- F500 in state
- 4
Industry mix (Fortune 500 HQ in AL)
| Industry | F500 HQs | Revenue |
|---|---|---|
| Financial Services | 1 | $8B |
|
||
| Healthcare | 1 | $5B |
|
||
Price history
+0.8% since first listed3 events — show timeline
- 2026-04-01 Price Changed $251,900 Zillow
- 2026-03-17 Price Changed $250,900 Zillow
- 2025-10-31 Listed $249,900 Zillow
Cash-flow waterfall
monthlySold comps — $/sqft
last 12 mo · ≤1 miLoading sold comps…