5225 Woodsey Way · Columbus, GA
Flood risk 1/10 · Minimal
- FEMA flood zone
- X (unshaded)
- Chance of flooding over 30 yrs
- 0.0%
- Est. flood insurance / yr
- $507 – $1,088
Fire risk 1/10 · Minimal
- Est. fire insurance / yr
- $963 – $1,789
Heat risk 7/10 · Major
- Hot days now (above 107°F)
- 7 days/yr
- Hot days in 30 yrs
- 18 days/yr
Wind risk 6/10 · Moderate
- Chance of severe wind over 30 yrs
- 76.0%
Air-quality risk 4/10 · Minor
- Unhealthy air days now
- 5 days/yr
- Unhealthy air days in 30 yrs
- 6 days/yr
Risk factors via First Street. Map © Google.
Why this score? — see what drove the D grade
The composite is a weighted blend of 9 inputs, each scored 0–100. Each bar is that input's sub-score; the figure is the points it added to the 100-point composite (weight × sub-score).
- Cash flow +15.9/30.0
- ARV discount +7.5/15.0
- DSCR +4.9/10.0
- 1% rule +3.9/10.0
- Rent growth +3.2/5.0
- Livability +3.2/5.0
- Condition / age +2.5/5.0
- Schools +2.2/10.0
- Appreciation +0.0/10.0
$160,000
🖨 Deal sheet (PDF) 📄 Offer letter ✓ Due diligence
Listing remarks
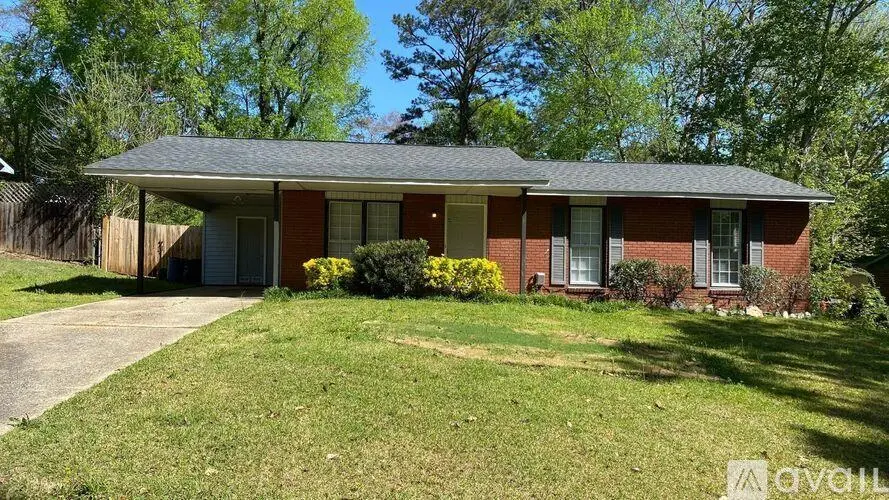
Welcome to this beautifully renovated 3-bedroom, 1.5-bath home located in north Columbus! Offering 1,025 square feet of comfortable living space and updated with modern touches throughout, this move-in ready property features a bright and inviting layout designed for everyday living. The fully fenced backyard is ideal for pets, gatherings, or outdoor enjoyment. Conveniently located and full of charm, this home is a great opportunity for first-time buyers, downsizers, or investors looking for a turnkey property. Don't miss your chance to make this newly renovated gem your own!
Key facts
- Move-in ready
- 0.23 acre lot
- Listed 11 days
Tags
Property features AI
Exterior
- Home design: Single-family residence; Residential property
- Exterior features: Lot size about 0.23 acres
Interior
- Bathrooms: 1 full bathroom; 1 half bathroom
- Interior features: Subdivision: SPRING VALLEY; Directions available to property
Neighborhood map
What this means for you Summary
Snapshot
- This is a 3-bed/1.5-bath single-family listed at $160k.
Deal economics
- At list price, monthly cash flow is $76 ($914/yr) — positive.
- The deal already cash-flows at list — no discount required.
- To meet the 1% rule (rent ≥ 1% of price), the offer needs to be $142k (11.2% below list).
- Recommended offer: $142k (11.2% below list) — sets the bar for 1% rule.
- Cap rate 6.9% vs local median 4.7% in Columbus — top-decile yield for the area; either an underpriced asset or a hidden risk that comps aren't pricing in. Stress-test before assuming the spread holds.
Location & tenants
- Location reads 64/100 on livability (#254 in GA) — a middle-class / working-renter tenant base. Strengths: cost of living A+, housing A+, health & safety B; Watch: amenities D+, crime F, commute F.
- Muscogee County (urban): math 21% / reading 30% proficiency, ranked #120 of 174 in GA (top 69%) — low school quality limits family demand, transient renter base, plan for 1-2y turnover; 61% free/reduced lunch — lower-income household profile, screen leases tightly.
- Zoned schools: Midland Academy (math 21% / reading 32%, grade F, #718 of 1,228 statewide, top 59%, 663 students, 96% FRL); Midland Middle School (math 13% / reading 26%, grade F, #356 of 470 statewide, top 78%, 441 students, 97% FRL); Shaw High School (math 12% / reading 5%, grade F, #376 of 424 statewide, top 89%, 1,234 students, 97% FRL) — zoned schools average 97% FRL vs 61% district-wide (36 pts higher); higher-poverty schools than district average — tighter screening recommended.
- Market conditions: Rents rising (+2.8%/yr); 163 active listings in the ZIP; 15 comparable units currently listed for rent nearby; rentals lingering (median 46d on market — plan ~5-8 weeks vacancy on turnover, expect pricing pressure); 67% of comp listings sitting > 30 days — soft ceiling on asking rent; 291 units permitted in Muscogee County in 2024 (30 in 5+ unit buildings).
Forward outlook
- Local home prices are declining (-3.0%/yr); year-one equity from $1k of loan paydown is wiped out by about $5k of value loss. Plan a longer hold.
- Muscogee County population projected at +15% by 2050 — modest demand growth; plan on rents tracking national, not racing it.
Negotiation context
- Only 11 days on market — expect competitive offers; lowballing is unlikely to land.
- Current owner paid $90k; list at $160k implies a 78% gain — meaningful room to come down on a strong offer.
Risks & watch-outs
- Climate carrying-cost: major wind risk, 76% chance of damaging wind over 30y; extreme-heat days projected 7→18/yr by 2055 (HVAC capex compounding) — expect insurance premiums to compound above CPI over the hold.
Questions for the listing agent
- Built in 1970 — when were the roof, HVAC, electrical panel, plumbing, and water heater last replaced?
- Is there a deadline driving the sale (1031 exchange, divorce, estate, relocation)? That informs how much negotiation room exists.
- Schools are F-rated, which usually means shorter tenancies and higher turnover. Who's the typical renter profile here, and what's been the actual vacancy rate?
- Crime grade is F in this area — have there been break-ins, vandalism, or insurance claims at this property in the last 3 years? What carrier currently insures it and at what premium?
- The area grade is low — what's the realistic commute time and amenity access for the typical tenant pool here? Any planned neighborhood developments (good or bad) we should know about?
- What's the average days-on-market for RENTAL listings here right now (not sales)? A rising rental-DOM trend means longer vacancies and softer asking-rent achievability than the comps imply.
- What's the recent tenant-quality profile in this submarket — average credit score on applications, eviction rate, late-payment / NSF rate, and stable-employment percentage? A property-management company in the area should have these aggregated.
- How much new for-sale + rental construction is in the pipeline within 1–3 miles? Heavy new supply typically softens prices + rents 12–24 months out; constrained supply supports both.
Investment metrics
- 1% rule
- 0.89% ✗
- Cap rate
- 6.86%
- Cash-on-cash
- 2.04%
- DSCR
- 1.09
- GRM
- 9.4
CMA / ARV
- ARV (on-the-fly)
- $159,900
- Comps found
- 12
Show comp detail 12 sales within ~0.75 mi
| Address | Dist | Beds/Ba | Sqft | Sold | Price | $/sf | Match |
|---|---|---|---|---|---|---|---|
| 6100 Stony Creek Dr | 0.19mi | 3/1.5 | 984 (-4%) | 3mo | $178,900 | $182 | 82 |
| 5318 Misty Ln | 0.09mi | 3/1.0 | 1,053 (+3%) | 9mo | $138,000 | $131 | 82 |
| 5324 Colony Dr | 0.26mi | 3/2.0 | 1,056 (+3%) | 6mo | $189,000 | $179 | 76 |
| 6108 King William Dr | 0.49mi | 3/1.5 | 1,008 (-2%) | 2mo | $122,500 | $122 | 73 |
| 5408 Old Dominion Rd | 0.31mi | 3/1.5 | 1,080 (+5%) | 6mo | $200,000 | $185 | 71 |
| 5423 Colony Dr | 0.28mi | 3/2.0 | 1,056 (+3%) | 12mo | $205,000 | $194 | 70 |
| 6251 Rockefeller Dr | 0.52mi | 3/1.5 | 1,008 (-2%) | 7mo | $157,500 | $156 | 68 |
| 6221 Rockefeller Dr | 0.49mi | 3/1.5 | 1,008 (-2%) | 12mo | $165,000 | $164 | 64 |
| 5791 Bishop Dr | 0.64mi | 3/1.0 | 1,050 (+2%) | 7mo | $145,000 | $138 | 58 |
| 6333 Stony Creek Dr | 0.26mi | 4/1.5 (+1) | 1,160 (+13%) | 6mo | $174,900 | $151 | 56 |
| 5800 Bishop Dr | 0.63mi | 3/1.5 | 1,128 (+10%) | 10mo | $155,000 | $137 | 45 |
| 5861 Highpoint Dr | 0.49mi | 2/1.0 (-1) | 910 (-11%) | 11mo | $132,000 | $145 | 42 |
Match score weights: distance 35% · size 25% · config 20% · recency 20%. Top-matched comps best support the ARV.
Projected returns pro-forma
-3.0% appreciation · 2.78% rent growth · sell at horizon
- IRR
- -13.3%
- Equity multiple
- 0.52×
- Total profit
- $-21,406
- Equity at exit
- $23,857
- IRR
- -4.7%
- Equity multiple
- 0.69×
- Total profit
- $-13,739
- Equity at exit
- $13,834
Cash invested: $44,800 (down + closing). Projections, not guarantees.
Landlord ↔ Tenant lean methodology
- Overall (STATE)
- 90 Strongly Landlord-Friendly
- State Georgia
- 90 Strongly Landlord-Friendly · R+3
- County
- — inherits STATE
- City
- — inherits STATE
ZIP-level market 31909
- Rents YoY
- 2.8%
- Active inventory
- 163
- Price-to-rent
- 9.4×
Monthly cashflow live
- Estimated rent
- $1,420 high interval (Pro) →
- Mortgage (P&I)
- −$839
- Tax from tax record
- −$140 /mo · $1,681/yr
- Insurance
- −$67
- HOA
- −$0
- Vacancy / Maint / Mgmt
- −$298
- Net cashflow
- $76
Break-even live
Sensitivity live
| Price | -10% $167 | -5% $121 | +0% $76 | +5% $31 | +10% $-14 |
|---|---|---|---|---|---|
| Rent | -10% $-36 | -5% $20 | +0% $76 | +5% $132 | +10% $188 |
| Rate | -1.0pp $157 | -0.5pp $117 | base $76 | +0.5pp $35 | +1.0pp $-7 |
UW: 25.0% down · 7.5% · 30yr · 1.5% tax · 5.0% vac · 8.0% maint · 8.0% mgmt
Financing live
Cash to close
- Down payment
- $40,000
- Closing costs
- $4,800
- Reserves months
- —
- Total cash needed
- —
Loan-product check · same deal, 3 products live
Conventional
25% down · 7.5% · 30yr
- Down + closing
- —
- Monthly P&I
- —
- Monthly cashflow
- —
- DSCR
- —
- Eligible?
- —
Personal DTI + credit; lowest rate.
DSCR
20% down · 8.5% · 30yr
- Down + closing
- —
- Monthly P&I
- —
- Monthly cashflow
- —
- DSCR
- —
- Eligible?
- —
No personal income docs; deal must DSCR.
Hard money
10% down · 12.0% · 12mo
- Down + closing
- —
- Monthly P&I
- —
- Monthly cashflow
- —
- DSCR
- —
- Eligible?
- —
Short-term bridge; refi at stabilization.
Rent comps 15 comps
| Address | Beds | Baths | Sqft | Rent | $/sqft | DOM | Units | Dist |
|---|---|---|---|---|---|---|---|---|
| 6015 Warm Springs Ct Unit B Columbus, GA | 2.0 | 1.0 | 825 | $850 | $1.03 | 45d | 1 | 0.46mi |
| 6015 Warm Springs Ct Unit A * Columbus, GA | 2.0 | 1.0 | 825 | $850 | $1.03 | 23d | 1 | 0.46mi |
| 30 Sugar Mill Ct Columbus, GA | 3.0 | 2.0 | 1322 | $1,750 | $1.32 | 45d | 1 | 0.60mi |
| 4560 Nan Leah Ln Columbus, GA | 3.0 | 2.0 | 1342 | $1,600 | $1.19 | 45d | 1 | 0.66mi |
| 6418 Charter Oaks Cir Columbus, GA | 3.0 | 2.0 | 1450 | $1,550 | $1.07 | 15d | 1 | 0.68mi |
| 4518 Randall Dr Columbus, GA | 3.0 | 2.0 | 1348 | $1,500 | $1.11 | 45d | 1 | 0.86mi |
| 7005 Robins Nest Dr Columbus, GA | 3.0 | 2.0 | 1362 | $1,675 | $1.23 | 45d | 1 | 1.04mi |
| 5941 Reed Ave Columbus, GA | 3.0 | 2.0 | 1280 | $1,550 | $1.21 | 45d | 1 | 1.14mi |
| 7108 Cross Tie Dr Apt 4 Columbus, GA | 2.0 | 2.0 | 1248 | $1,400 | $1.12 | 45d | 1 | 1.35mi |
| 6515 Thea Ln Columbus, GA | 1.0–2.0 | 1.0–2.0 | 999 | $1,220 | $1.22 | 15d | 19 | 1.36mi |
| 6233 Cross Tie Ct Unit 4 Columbus, GA | 3.0 | 2.0 | 1238 | $1,500 | $1.21 | 45d | 1 | 1.38mi |
| 7801 Cross Tie Dr Unit 4 Columbus, GA | 2.0 | 2.0 | 1238 | $1,400 | $1.13 | 46d | 1 | 1.39mi |
| 4343 Warm Springs Rd Columbus, GA | 2.0–3.0 | 2.0 | 1242 | $1,535 | $1.24 | 15d | 10 | 1.39mi |
| 6320 Olde Towne Dr Columbus, GA | 3.0 | 2.5 | 1500 | $1,150 | $0.77 | 15d | 1 | 1.42mi |
| 4845 Burt Mar Dr Unit G1 Columbus, GA | 2.0 | 2.0 | 1060 | $805 | $0.76 | 45d | 1 | 1.42mi |
Listing history 7 events
-
2026-06-03statusdays on market $160,000 Pending 11 DOM
-
2026-06-02days on market $160,000 Active 10 DOM
-
2026-06-01days on market $160,000 Active 9 DOM
-
2026-05-31days on market $160,000 Active 8 DOM
-
2026-05-30days on market $160,000 Active 7 DOM
-
2026-05-23$160,000 Active
-
2021-12-07soldstatus $90,000
ⓘ Source: listings_history table (triggers on properties + properties_extension) + one-shot
backfill from property_details.listing_events for pre-trigger history.
Tax reassessment forecast GA · Resets to sale price
- Current annual tax
- $1,681 · $140/mo
- Projected year-2 tax
- $1,681 · $140/mo
- Expected delta
- $0/yr ($0/mo · 0.0%)
ⓘ Screening estimate from a state-policy table — verify with the county assessor before closing.
Climate risk First Street
- Flood 1/10 Low FEMA zone X (unshaded) · 0% chance over 30 yrs
- Wildfire 1/10 Low
- Heat 7/10 Severe 7 d/yr ≥107°F today · 18 d/yr by 30 yrs out
- Wind 6/10 Major 76% chance of damaging wind over 30 yrs
- Air quality 4/10 Moderate 5 unhealthy d/yr today · 6 by 30 yrs out
Nearby sold comps map
Loading sold comps map…
Walkable amenities ~0.75 mi
Loading nearby amenities…
Taxation est. · year 1
- Rental income
- $17,042
- − Mortgage interest
- −$8,962
- − Property taxes
- −$1,681
- − Insurance
- −$800
- − Repairs & maintenance
- −$1,363
- − Management
- −$1,363
- − Depreciation
- −$4,655
- Taxable loss
- −$1,782
- Est. tax savings @ 24.0%
- +$428
- After-tax cash flow
- $1,342/yr
For passive investors: Depreciation is non-cash, so a rental often shows a tax loss while cash-flowing — sheltering income. Rental losses are passive: they offset passive income freely, and up to $25,000/yr can offset ordinary (W-2) income if you actively participate and your MAGI is under $100k (phasing out to $0 by $150k); unused losses carry forward. On sale, claimed depreciation is recaptured at up to 25%, and gains may owe capital-gains tax (a 1031 exchange can defer both). Figures are a year-1 estimate at your 24.0% rate — not tax advice; consult a CPA.
Schools (NCES district)
- District
- Muscogee County
- NCES district ID
- 1303870
- Math proficiency
- 21% ▼ -11.00%
- Reading proficiency
- 30% ▼ -7.00%
- Median HH income
- $41,176
- Composite
- 21.6/100
- National rank
- #8297
- State rank
- #120 of 174 in GA
Livability — Columbus
- Score
- 64/100
- State rank
- #254
- US rank
- #14102
Category grades
Schools grade is shown separately in the Schools card above.
Census & demographics
- Census place
- Columbus, GA
- County
- Muscogee County · 180,764 people
- City population
- 180,764
- Metro
- Columbus, GA-AL
- Population (ZIP)
- 39,364
- Household income
- $69,166
- Rent vs Own
- Severe rent burden
- 1819.0
Population outlook (Muscogee County) Hauer SSP2
- Today (2025)
- 216,729 people
- By 2030
- 224,504 · +3.6%
- By 2040
- 238,318 · +10.0%
- By 2050
- 249,027 · +14.9%
- By 2075
- 264,862 · +22.2%
- By 2100
- 254,786 · +17.6%
Race, ethnicity, and origin ACS 2023
- Neighborhood character
- Diverse neighborhood (Simpson 0.64)
- Race & ethnicity
- White 53% Black 24% Hispanic / Latino 12% Two or more races 9% Asian 4%
- Hispanic origin (detail)
- Mexican 3% Puerto Rican 4% Dominican 1%
- Common ancestry
- Italian 3% Serbian 2% Lithuanian 2%
- Foreign-born
- 8% · Canada, Vietnam, Jamaica
- Languages at home
- 89% English-only · Spanish 7% Other Indo-European 2% Other Asian/Pacific 1%
Political lean MEDSL · Muscogee
- 2024 margin
- Strong D (+23.4) · D 61.4% · R 38.0%
- 2008→2024 swing
- +3.7pp toward D · 2008: 19.7pp · 2024: 23.4pp
- All cycles
- 2024: D+23.4 2020: D+24.0 2016: D+18.6 2012: D+21.3 2008: D+19.7
Not yet ingested
- Civics
- —
Market trends
- HPI YoY
- ▼ -146.90%
- Current HPI
- 203.1499
- Rent YoY
- ▲ 2.78%
- Metro
- Columbus, GA-AL
- State GDP YoY
- ▲ 2.66%
- F500 in state
- 28
Industry mix (Fortune 500 HQ in GA)
| Industry | F500 HQs | Revenue |
|---|---|---|
| Paper / Packaging | 2 | $29B |
|
||
| Retail | 1 | $160B |
|
||
| Transportation / Logistics | 1 | $91B |
|
||
| Airlines | 1 | $62B |
|
||
| Consumer Goods | 1 | $47B |
|
||
| Utilities | 1 | $25B |
|
||
Price history
+77.8% since first listed2 events — show timeline
- 2026-05-23 Listed $160,000 CBOR
- 2021-12-07 Sold (Public Records) $90,000 Public Records
Property tax history
+11.1%/yrLatest (2025): $1,681 · -0.9% YoY. Source: county tax records.
Cash-flow waterfall
monthlySold comps — $/sqft
last 12 mo · ≤1 miLoading sold comps…