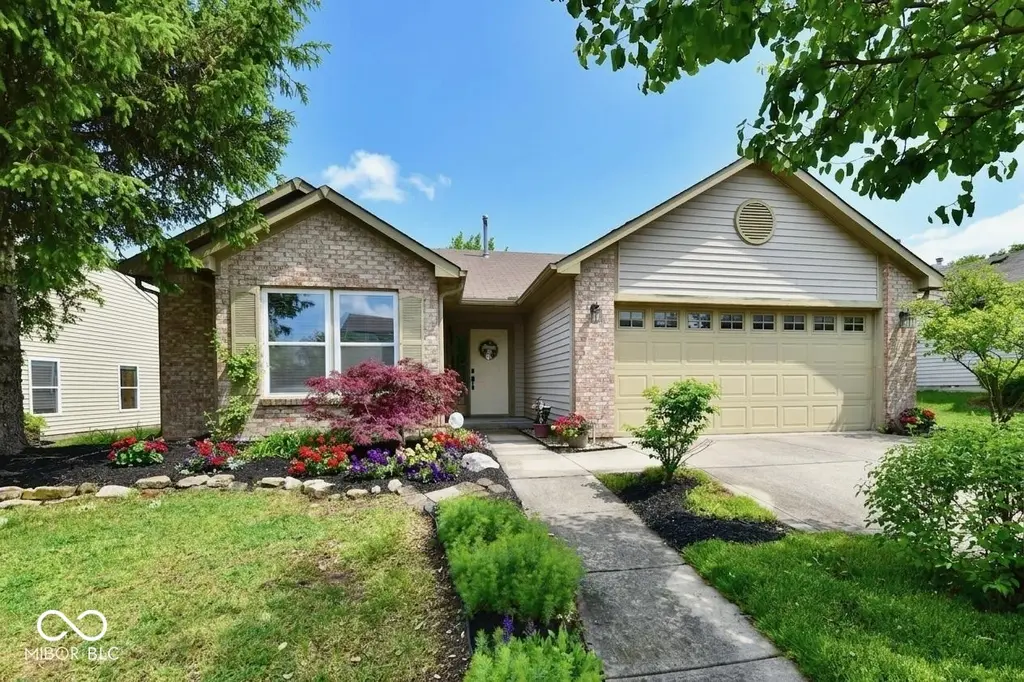
11240 Blue Meadow Dr · Fishers, IN
Flood risk 1/10 · Minimal
- FEMA flood zone
- X (unshaded)
- Chance of flooding over 30 yrs
- 0.0%
- Est. flood insurance / yr
- $507 – $1,088
Fire risk 1/10 · Minimal
- Est. fire insurance / yr
- $717 – $1,331
Heat risk 3/10 · Minor
- Hot days now (above 101°F)
- 7 days/yr
- Hot days in 30 yrs
- 18 days/yr
Wind risk 2/10 · Minimal
- Chance of severe wind over 30 yrs
- 1.0%
Air-quality risk 2/10 · Minimal
- Unhealthy air days now
- 1 days/yr
- Unhealthy air days in 30 yrs
- 1 days/yr
Risk factors via First Street. Map © Google.
Why this score? — see what drove the D- grade
The composite is a weighted blend of 9 inputs, each scored 0–100. Each bar is that input's sub-score; the figure is the points it added to the 100-point composite (weight × sub-score).
- ARV discount +9.3/15.0
- Cash flow +9.2/30.0
- Schools +5.3/10.0
- Rent growth +4.2/5.0
- Livability +4.2/5.0
- DSCR +2.6/10.0
- Condition / age +2.5/5.0
- 1% rule +2.2/10.0
- Appreciation +0.0/10.0
$330,000
🖨 Deal sheet 📄 Offer letter ✓ Due diligence
Listing remarks MLS
A little jewel! Ready to move in tomorrow. Newly painted w new carpet, ceramic. All appliances stay. Mstr closet w built ins. Mstr Bath has new tile thruout. Dbl vanities in mstr bath. Charming well landscaped yard w black picket fencing in rear. Fabulous 530 sq. ft.deck for entertaining. House wired for surround sound. Kitchen has honey finished solid maple cabinetry, great triple window seat and new ceramic floor. 4 ceiling fans thruout. Vaulted ceilings. Exterior painted in 2010.
Key facts
- Aquatics center
- Fitness center
- Workout classes
Tags
Property features AI
Finance
- Other: Property on approximately 0.17 acre (<1/4 acre)
- HOA & community: Homeowners association with annual fee (approximately $350); HOA covers entrance common areas, insurance, management, snow removal and trash; HOA has covenants & restrictions, rules & regulations, and a transfer fee
Exterior
- Parking: Attached 2-car garage (approximately 400 sq ft)
- Utilities: Public water; Municipal sewer connected; Cable connected; Solid waste service available
- Home design: Single-family residence; One story
- Construction: Wood and brick construction; Slab foundation
- Exterior features: Deck; Small trees on lot
Interior
- Kitchen: Electric oven; Microwave; Dishwasher; Garbage disposal; Refrigerator; Eat-in kitchen layout
- Bedrooms: Primary bedroom with walk-in closet; 3 bedrooms on the main level
- Bathrooms: 2 full bathrooms; Primary bathroom with full shower stall
- Heating & cooling: Forced air heating (natural gas); Central air conditioning; Gas log fireplace in the great room
- Interior features: Attic with pull-down stairs; Cathedral/vaulted ceilings; Eat-in kitchen; Pantry; Woodwork painted
- Laundry & utility: Washer; Dryer; Gas water heater
Neighborhood map
What this means for you Summary
Snapshot
- This is a 4-bed/2.0-bath single-family listed at $330k.
Deal economics
- At list price, monthly cash flow is $-250 ($-3k/yr) — negative.
- To cash-flow at today's rent, offer at most $286k (13.4% below list).
- To meet the 1% rule (rent ≥ 1% of price), the offer needs to be $238k (27.9% below list).
- Recommended offer: $238k (27.9% below list) — sets the bar for 1% rule.
- Cap rate 5.4% vs local median 3.6% in Fishers — top-decile yield for the area; either an underpriced asset or a hidden risk that comps aren't pricing in. Stress-test before assuming the spread holds.
Location & tenants
- Location reads 83/100 on livability (#11 in IN, #898 nationally) — a professional / high-income tenant draw. Strengths: schools A+, crime A+, amenities A+; Watch: commute F.
- Hamilton Southeastern Schools (suburban): math 57% / reading 59% proficiency, ranked #14 of 301 in IN (top 5%) — acceptable for families but not a draw, mixed tenant base, ~2y average lease; only 10% free/reduced lunch — higher-income household profile.
- Market conditions: Rents rising fast (+6.7%/yr); 322 active listings in the ZIP; 5 comparable units currently listed for rent nearby; rentals at typical pace (median 22d on market — plan ~3-4 weeks tenant-placement turnaround); high-income renter base; 4,661 units permitted in Hamilton County in 2024 (1,528 in 5+ unit buildings).
Forward outlook
- Local home prices are declining (-3.0%/yr); year-one equity from $2k of loan paydown is wiped out by about $10k of value loss. Plan a longer hold.
- Hamilton County population projected at +44% by 2050 — long-run rental-demand tailwind backs the buy-and-hold thesis.
Negotiation context
- It's been on market 21 days — a 2% lower offer ($325k) is reasonable based on typical stale-listing flexibility.
- 3 sale attempts since 15y ago with the ask held roughly flat each time — persistent listings suggest the price (not the market) is what's stuck; bring a comps-based counter.
- Current owner paid $155k; list at $330k implies a 113% gain — meaningful room to come down on a strong offer.
Questions for the listing agent
- What do current leases actually rent for vs. the listed asking? Can we see a recent rent roll and the last 12 months of T-12 income?
- What does the HOA fee cover, when was the last increase, and are there any pending special assessments or reserve-fund shortfalls?
- Is there a deadline driving the sale (1031 exchange, divorce, estate, relocation)? That informs how much negotiation room exists.
- Schools are A-rated — typically a magnet for longer-tenancy family renters. What's the average tenant stay here, and is there a school-zone premium baked into asking?
- The area grade is low — what's the realistic commute time and amenity access for the typical tenant pool here? Any planned neighborhood developments (good or bad) we should know about?
- What's the average days-on-market for RENTAL listings here right now (not sales)? A rising rental-DOM trend means longer vacancies and softer asking-rent achievability than the comps imply.
- What's the recent tenant-quality profile in this submarket — average credit score on applications, eviction rate, late-payment / NSF rate, and stable-employment percentage? A property-management company in the area should have these aggregated.
- How much new for-sale + rental construction is in the pipeline within 1–3 miles? Heavy new supply typically softens prices + rents 12–24 months out; constrained supply supports both.
Investment metrics
- 1% rule
- 0.72% ✗
- Cap rate
- 5.38%
- Cash-on-cash
- -3.24%
- DSCR
- 0.86
- GRM
- 11.6
CMA / ARV
- ARV (median comp)
- $343,908
- List price
- $330,000
- Delta
- -4.04%
- Verdict
- FAIR
- Comps
- 20 within 1.0 mi
Show comp detail 12 sales within ~0.75 mi
| Address | Dist | Beds/Ba | Sqft | Sold | Price | $/sf | Match |
|---|---|---|---|---|---|---|---|
| 11689 Silver Meadow Ct | 0.14mi | 3/2.0 (-1) | 1,622 (-1%) | 2mo | $345,000 | $213 | 85 |
| 12256 Sagamore Woods Dr | 0.55mi | 4/2.0 | 1,656 (+1%) | 12mo | $325,000 | $196 | 63 |
| 12220 Sweet Creek Trl | 0.63mi | 3/2.0 (-1) | 1,724 (+5%) | 1mo | $311,000 | $180 | 56 |
| 10603 Cedar Dr | 0.69mi | 3/2.0 (-1) | 1,722 (+5%) | 2mo | $336,000 | $195 | 53 |
| 12202 Hoosier Rd | 0.47mi | 3/2.0 (-1) | 1,576 (-4%) | 20mo | $650,000 | $412 | 50 |
| 12110 Rising Sun Way | 0.56mi | 3/2.0 (-1) | 1,680 (+2%) | 19mo | $335,000 | $199 | 49 |
| 12438 Berry Patch Ln | 0.68mi | 3/2.0 (-1) | 1,492 (-9%) | 5mo | $295,000 | $198 | 44 |
| 10969 Haig Point Dr | 0.67mi | 3/2.0 (-1) | 1,592 (-3%) | 18mo | $355,000 | $223 | 44 |
| 12351 Tuckaway Ct | 0.67mi | 3/2.0 (-1) | 1,468 (-10%) | 17mo | $275,000 | $187 | 32 |
| 10940 Sweet Creek Trl | 0.62mi | 3/2.0 (-1) | 1,425 (-13%) | 15mo | $300,000 | $211 | 31 |
| 12458 Berry Patch Ln | 0.70mi | 3/2.0 (-1) | 1,501 (-8%) | 21mo | $310,000 | $207 | 31 |
| 11026 Cool Winds Way | 0.72mi | 3/2.0 (-1) | 1,409 (-14%) | 14mo | $310,000 | $220 | 26 |
Match score weights: distance 35% · size 25% · config 20% · recency 20%. Top-matched comps best support the ARV.
Projected returns pro-forma
-3.0% appreciation · 6.71% rent growth · sell at horizon
- IRR
- -18.0%
- Equity multiple
- 0.35×
- Total profit
- $-60,226
- Equity at exit
- $49,204
- IRR
- -4.6%
- Equity multiple
- 0.65×
- Total profit
- $-32,339
- Equity at exit
- $28,532
Cash invested: $92,400 (down + closing). Projections, not guarantees.
Landlord ↔ Tenant lean methodology
- Overall (STATE)
- 90 Strongly Landlord-Friendly
- State Indiana
- 90 Strongly Landlord-Friendly · R+11
- County
- — inherits STATE
- City
- — inherits STATE
ZIP-level market 46037
- Home prices YoY
- -18.6%
- Rents YoY
- 6.7%
- Active inventory
- 322
- Price-to-rent
- 11.6×
Monthly cashflow live
- Estimated rent
- $2,380 medium interval (Pro) →
- Mortgage (P&I)
- −$1,731
- Tax from tax record
- −$233 /mo · $2,799/yr
- Insurance
- −$138
- HOA
- −$29
- Vacancy / Maint / Mgmt
- −$500
- Net cashflow
- $-250
Break-even live
UW: 25.0% down · 7.5% · 30yr · 1.5% tax · 5.0% vac · 8.0% maint · 8.0% mgmt
Financing live
Cash to close
- Down payment
- $82,500
- Closing costs
- $9,900
- Reserves months
- —
- Total cash needed
- —
Loan-product check · same deal, 3 products live
Conventional
25% down · 7.5% · 30yr
- Down + closing
- —
- Monthly P&I
- —
- Monthly cashflow
- —
- DSCR
- —
- Eligible?
- —
Personal DTI + credit; lowest rate.
DSCR
20% down · 8.5% · 30yr
- Down + closing
- —
- Monthly P&I
- —
- Monthly cashflow
- —
- DSCR
- —
- Eligible?
- —
No personal income docs; deal must DSCR.
Hard money
10% down · 12.0% · 12mo
- Down + closing
- —
- Monthly P&I
- —
- Monthly cashflow
- —
- DSCR
- —
- Eligible?
- —
Short-term bridge; refi at stabilization.
Rent comps 5 comps
| Address | Beds | Baths | Sqft | Rent | $/sqft | DOM | Units | Dist |
|---|---|---|---|---|---|---|---|---|
| 11289 Hamilton Crest Blvd E Fishers, IN | 1.0–3.0 | 1.0–2.5 | 1084 | $3,095 | $2.86 | 4d | 13 | 0.48mi |
| 12273 Rambling Rd Fishers, IN | 4.0 | 2.5 | 1650 | $2,145 | $1.30 | 21d | 1 | 0.57mi |
| 12259 Slate Dr Fishers, IN | 3.0 | 2.0 | 1406 | $2,300 | $1.64 | 23d | 1 | 1.12mi |
| 12208 Weathered Edge Dr Fishers, IN | 3.0 | 2.0 | 1444 | $2,000 | $1.39 | 4d | 1 | 1.18mi |
| 10031 E 126th St Fishers, IN | 4.0 | 2.0 | 1974 | $2,100 | $1.06 | 43d | 1 | 1.45mi |
HOA detail
- Monthly dues
- $29 · $348/yr
Listing history 7 events
-
2026-06-18days on market $330,000 Active 21 DOM
-
2026-06-17status $330,000 Active 20 DOM
-
2026-05-07price $330,000 849-char remark
-
2026-04-30$340,000 Active 849-char remark
-
2011-08-26historical 487-char remark
Show marketing remark (487 chars)
A little jewel! Ready to move in tomorrow. Newly painted w new carpet, ceramic. All appliances stay. Mstr closet w built ins. Mstr Bath has new tile thruout. Dbl vanities in mstr bath. Charming well landscaped yard w black picket fencing in rear. Fabulous 530 sq. ft.deck for entertaining. House wired for surround sound. Kitchen has honey finished solid maple cabinetry, great triple window seat and new ceramic floor. 4 ceiling fans thruout. Vaulted ceilings. Exterior painted in 2010.
-
2011-08-19soldstatus $155,000 487-char remark
Show marketing remark (487 chars)
A little jewel! Ready to move in tomorrow. Newly painted w new carpet, ceramic. All appliances stay. Mstr closet w built ins. Mstr Bath has new tile thruout. Dbl vanities in mstr bath. Charming well landscaped yard w black picket fencing in rear. Fabulous 530 sq. ft.deck for entertaining. House wired for surround sound. Kitchen has honey finished solid maple cabinetry, great triple window seat and new ceramic floor. 4 ceiling fans thruout. Vaulted ceilings. Exterior painted in 2010.
-
2011-05-16$163,900 487-char remark
Show marketing remark (487 chars)
A little jewel! Ready to move in tomorrow. Newly painted w new carpet, ceramic. All appliances stay. Mstr closet w built ins. Mstr Bath has new tile thruout. Dbl vanities in mstr bath. Charming well landscaped yard w black picket fencing in rear. Fabulous 530 sq. ft.deck for entertaining. House wired for surround sound. Kitchen has honey finished solid maple cabinetry, great triple window seat and new ceramic floor. 4 ceiling fans thruout. Vaulted ceilings. Exterior painted in 2010.
ⓘ Source: listings_history table (triggers on properties + properties_extension) + one-shot
backfill from property_details.listing_events for pre-trigger history.
Tax reassessment forecast IN · Partial reset (capped growth)
- Current annual tax
- $2,799 · $233/mo
- Projected year-2 tax
- $2,802 · $233/mo
- Expected delta
- +$3/yr ($0/mo · 0.1%)
ⓘ Screening estimate from a state-policy table — verify with the county assessor before closing.
Climate risk First Street
- Flood 1/10 Low FEMA zone X (unshaded) · 0% chance over 30 yrs
- Wildfire 1/10 Low
- Heat 3/10 Moderate 7 d/yr ≥101°F today · 18 d/yr by 30 yrs out
- Wind 2/10 Low 100% chance of damaging wind over 30 yrs
- Air quality 2/10 Low 1 unhealthy d/yr today · 1 by 30 yrs out
Nearby sold comps map
Loading sold comps map…
Walkable amenities ~0.75 mi
Loading nearby amenities…
Taxation est. · year 1
- Rental income
- $28,564
- − Mortgage interest
- −$18,485
- − Property taxes
- −$2,799
- − Insurance
- −$1,650
- − Repairs & maintenance
- −$2,285
- − Management
- −$2,285
- − HOA
- −$348
- − Depreciation
- −$9,600
- Taxable loss
- −$8,888
- Est. tax savings @ 24.0%
- +$2,133
- After-tax cash flow
- $-865/yr
For passive investors: Depreciation is non-cash, so a rental often shows a tax loss while cash-flowing — sheltering income. Rental losses are passive: they offset passive income freely, and up to $25,000/yr can offset ordinary (W-2) income if you actively participate and your MAGI is under $100k (phasing out to $0 by $150k); unused losses carry forward. On sale, claimed depreciation is recaptured at up to 25%, and gains may owe capital-gains tax (a 1031 exchange can defer both). Figures are a year-1 estimate at your 24.0% rate — not tax advice; consult a CPA.
Schools (NCES district)
- District
- Hamilton Southeastern Schools
- NCES district ID
- 1810650
- Math proficiency
- 57% ▼ -11.00%
- Reading proficiency
- 59% ▼ -7.00%
- Median HH income
- $87,726
- Composite
- 53.02/100
- National rank
- #1520
- State rank
- #14 of 301 in IN
Livability — Fishers
- Score
- 83/100
- State rank
- #11
- US rank
- #898
Category grades
Schools grade is shown separately in the Schools card above.
Census & demographics
- Census place
- Fishers, IN
- County
- Hamilton County · 337,479 people
- City population
- 92,467
- Metro
- Indianapolis-Carmel-Anderson, IN
- Population (ZIP)
- 48,713
- Household income
- $141,810
- Rent vs Own
- Severe rent burden
- 738.0
Population outlook (Hamilton County) Hauer SSP2
- Today (2025)
- 381,938 people
- By 2030
- 417,496 · +9.3%
- By 2040
- 486,684 · +27.4%
- By 2050
- 549,805 · +44.0%
- By 2075
- 687,078 · +79.9%
- By 2100
- 754,495 · +97.5%
Race, ethnicity, and origin ACS 2023
- Neighborhood character
- Predominantly White (79%)
- Race & ethnicity
- White 79% Asian 10% Two or more races 5% Hispanic / Latino 3% Black 3%
- Common ancestry
- Romanian 2% Slovak 2% Iranian 1%
- Foreign-born
- 10% · Canada, China, South Korea
- Languages at home
- 87% English-only · Other Indo-European 4% Other Asian/Pacific 4% Spanish 2%
Political lean MEDSL · Hamilton
- 2024 margin
- Lean R (+6.1) · D 46.0% · R 52.1% · Other 1.9%
- 2008→2024 swing
- +16.2pp toward D · 2008: -22.2pp · 2024: -6.1pp
- All cycles
- 2024: R+6.1 2020: R+6.8 2016: R+19.6 2012: R+34.3 2008: R+22.2
Not yet ingested
- Civics
- —
Market trends
- HPI YoY
- ▼ -48.93%
- Current HPI
- 213.5424
- Rent YoY
- ▲ 6.71%
- Metro
- Indianapolis-Carmel-Anderson, IN
- State GDP YoY
- ▲ 2.90%
- F500 in state
- 18
Industry mix (Fortune 500 HQ in IN)
| Industry | F500 HQs | Revenue |
|---|---|---|
| Industrial Machinery | 2 | $37B |
|
||
| Healthcare | 1 | $177B |
|
||
| Pharmaceuticals | 1 | $45B |
|
||
| Metals / Steel | 1 | $18B |
|
||
| Agriculture | 1 | $17B |
|
||
| Packaging | 1 | $12B |
|
||
Price history
+101.3% since first listed7 events — show timeline
- 2026-06-17 Relisted — MIBOR as Distributed by MLS Grid
- 2026-05-20 Pending — MIBOR as Distributed by MLS Grid
- 2026-05-07 Price Changed $330,000 MIBOR as Distributed by MLS Grid
- 2026-04-30 Listed $340,000 MIBOR as Distributed by MLS Grid
- 2011-08-26 Listing Removed — MIBOR as Distributed by MLS Grid
- 2011-08-19 Sold (MLS) $155,000 MIBOR as Distributed by MLS Grid
- 2011-05-16 Listed $163,900 MIBOR as Distributed by MLS Grid
Property tax history
+6.0%/yrLatest (2025): $2,799 · +3.0% YoY. Source: county tax records.
Cash-flow waterfall
monthlySold comps — $/sqft
last 12 mo · ≤1 miLoading sold comps…