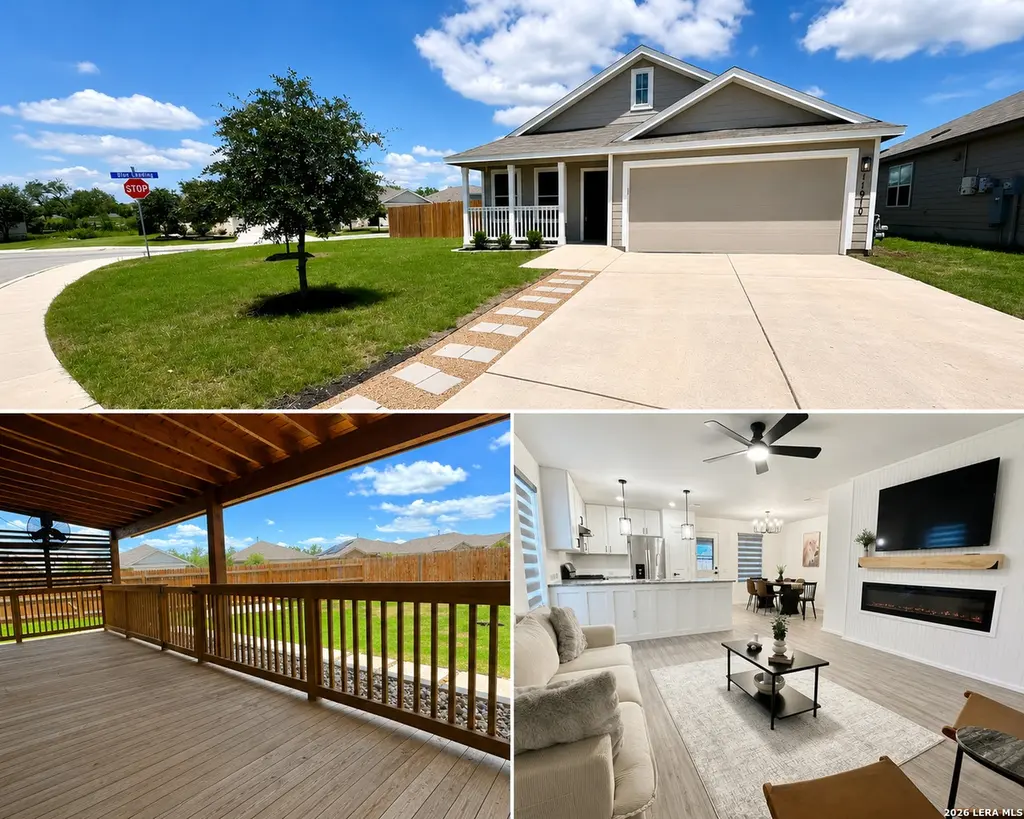
11910 Kingfisher · San Antonio, TX
Flood risk 1/10 · Minimal
- FEMA flood zone
- X (unshaded)
- Chance of flooding over 30 yrs
- 0.0%
- Est. flood insurance / yr
- $507 – $1,088
Fire risk 5/10 · Moderate
- Est. fire insurance / yr
- $1,222 – $2,270
Heat risk 8/10 · Major
- Hot days now (above 109°F)
- 7 days/yr
- Hot days in 30 yrs
- 22 days/yr
Wind risk 8/10 · Major
- Chance of severe wind over 30 yrs
- 80.0%
Air-quality risk 2/10 · Minimal
- Unhealthy air days now
- 0 days/yr
- Unhealthy air days in 30 yrs
- 1 days/yr
Risk factors via First Street. Map © Google.
Why this score? — see what drove the D grade
The composite is a weighted blend of 9 inputs, each scored 0–100. Each bar is that input's sub-score; the figure is the points it added to the 100-point composite (weight × sub-score).
- ARV discount +15.0/15.0
- Cash flow +6.9/30.0
- Appreciation +6.0/10.0
- Livability +4.0/5.0
- 1% rule +2.9/10.0
- Condition / age +2.5/5.0
- Schools +1.8/10.0
- DSCR +1.1/10.0
- Rent growth +0.7/5.0
$199,000
🖨 Deal sheet (PDF) 📄 Offer letter ✓ Due diligence
Listing remarks
Priced to Sell!! Oversized corner lot with upgrades inside and out. Features include fresh interior paint, new carpet, custom trim details, a cozy electric fireplace, upgraded lighting and ceiling fans throughout, plus modern black hardware and bathroom fixtures. Enjoy entertaining on the covered patio with the added convenience of a storage shed. Stylish, functional, and move-in ready! Owner/Agent.
Key facts
- Oversized corner lot
- Covered patio
- Storage shed
Tags
Property features AI
Finance
- Other: Possession at closing/funding; Listing handled by Keller Williams City-View
- Financial info: Association transfer fee applies
- HOA & community: Mandatory HOA; Annual HOA fee; Community amenities include pool, golf course, park/playground, jogging trails, sports court and bike trails
Exterior
- Parking: Attached 2-car garage
- Utilities: Water system; Sewer system; Energy Star certified; Low-flow toilet
- Home design: Single-family property (pre-owned); Built by Lennar (approx. 6 years old); Siding and cement fiber exterior; Slab foundation; Composition roof
- Construction: Siding and cement fiber exterior; Composition roof; Slab foundation; Approximately 6 years old; Pre-owned
- Exterior features: Covered patio; Deck/balcony; Privacy fence; Double-pane windows; Solar screens; Corner lot; Storage building / shed
Interior
- Kitchen: Cooktop; Stove/Range; Dishwasher; Refrigerator; Garbage disposal; Island
- Bedrooms: Master bedroom with walk-in closet, ceiling fan and full bath (approx. 12 x 12); Bedroom 2 (approx. 10 x 11); Bedroom 3 (approx. 12 x 10); Split bedroom layout
- Flooring: Carpeting; Vinyl flooring
- Bathrooms: Two full bathrooms; Master bath with tub/shower combination (approx. 10 x 6)
- Heating & cooling: Central heating (electric); Central air conditioning
- Interior features: Ceiling fans; Chandelier; Central vacuum; Smoke alarms; Carbon monoxide detector; Garage door opener; Island kitchen; Open floor plan; Ground level / no steps; Separate dining room; Attic partially floored with pull-down stairs; Some window coverings remain; Laundry room; Walk-in closets; Storage building / shed
- Laundry & utility: Laundry room; Central vacuum
Neighborhood map
What this means for you Summary
Snapshot
- This is a 3-bed/2.0-bath single-family listed at $199k.
Deal economics
- At list price, monthly cash flow is $-299 ($-4k/yr) — negative.
- To cash-flow at today's rent, offer at most $146k (26.5% below list).
- To meet the 1% rule (rent ≥ 1% of price), the offer needs to be $158k (20.6% below list).
- Recommended offer: $146k (26.5% below list) — sets the bar for cash-flow.
Location & tenants
- Location reads 80/100 on livability (#31 in TX, #1,616 nationally) — a professional / high-income tenant draw. Strengths: amenities A+, commute A+, cost of living A+; Watch: crime F.
- Southside ISD (rural): math 16% / reading 25% proficiency, ranked #771 of 826 in TX (top 93%) — low school quality limits family demand, transient renter base, plan for 1-2y turnover; 76% free/reduced lunch — lower-income household profile, screen leases tightly.
- Zoned schools: Julian C Gallardo El (math 13% / reading 22%, grade F, #3,805 of 4,322 statewide, top 89%, 544 students, 87% FRL); Julius L Matthey Middle (math 17% / reading 25%, grade F, #1,387 of 1,662 statewide, top 85%, 604 students, 92% FRL); Southside H S (math 18% / reading 25%, grade F, #1,377 of 1,632 statewide, top 85%, 1,685 students, 85% FRL).
- Market conditions: Rents falling (-7.2%/yr); 389 active listings in the ZIP; 19 comparable units currently listed for rent nearby; rentals at typical pace (median 24d on market — plan ~3-4 weeks tenant-placement turnaround); 8,308 units permitted in Bexar County in 2024 (2,506 in 5+ unit buildings).
Forward outlook
- In year one you build about $5k of equity ($1k loan paydown + $4k appreciation (2.0% local appreciation)).
- Bexar County population projected at +50% by 2050 — long-run rental-demand tailwind backs the buy-and-hold thesis.
- By year 7, paydown + projected appreciation supports a ~$35k cash-out refi (75% LTV) — recoverable capital for the next deal without selling this one.
Negotiation context
- It's been on market 15 days — a 2% lower offer ($196k) is reasonable based on typical stale-listing flexibility.
Risks & watch-outs
- Climate carrying-cost: severe wind risk, 80% chance of damaging wind over 30y; moderate wildfire risk; extreme-heat days projected 7→22/yr by 2055 (HVAC capex compounding) — expect insurance premiums to compound above CPI over the hold.
Questions for the listing agent
- What do current leases actually rent for vs. the listed asking? Can we see a recent rent roll and the last 12 months of T-12 income?
- What does the HOA fee cover, when was the last increase, and are there any pending special assessments or reserve-fund shortfalls?
- Is there a deadline driving the sale (1031 exchange, divorce, estate, relocation)? That informs how much negotiation room exists.
- Crime grade is F in this area — have there been break-ins, vandalism, or insurance claims at this property in the last 3 years? What carrier currently insures it and at what premium?
- The area grade is low — what's the realistic commute time and amenity access for the typical tenant pool here? Any planned neighborhood developments (good or bad) we should know about?
- What's the average days-on-market for RENTAL listings here right now (not sales)? A rising rental-DOM trend means longer vacancies and softer asking-rent achievability than the comps imply.
- What's the recent tenant-quality profile in this submarket — average credit score on applications, eviction rate, late-payment / NSF rate, and stable-employment percentage? A property-management company in the area should have these aggregated.
- How much new for-sale + rental construction is in the pipeline within 1–3 miles? Heavy new supply typically softens prices + rents 12–24 months out; constrained supply supports both.
Investment metrics
- 1% rule
- 0.79% ✗
- Cap rate
- 4.49%
- Cash-on-cash
- -6.43%
- DSCR
- 0.71
- GRM
- 10.5
CMA / ARV
- ARV (median comp)
- $253,394
- List price
- $199,000
- Delta
- -21.47%
- Verdict
- UNDERPRICED
- Comps
- 20 within 1.0 mi
Show comp detail 12 sales within ~0.75 mi
| Address | Dist | Beds/Ba | Sqft | Sold | Price | $/sf | Match |
|---|---|---|---|---|---|---|---|
| 11910 Kingfisher | 0.00mi | 3/2.0 | 1,192 (0%) | 0mo | $199,000 | $167 | 100 |
| 11934 Catbird | 0.14mi | 3/2.0 | 1,211 (+2%) | 10mo | $210,000 | $173 | 83 |
| 711 Cook Bnd | 0.28mi | 3/2.0 | 1,276 (+7%) | 4mo | $154,000 | $121 | 71 |
| 711 Vermilion | 0.21mi | 3/2.0 | 1,021 (-14%) | 3mo | $184,900 | $181 | 64 |
| 2052 Organ Pipe Cactus | 0.71mi | 3/2.0 | 1,206 (+1%) | 10mo | $201,849 | $167 | 57 |
| 2030 Organ Pipe Cactus | 0.71mi | 3/2.0 | 1,206 (+1%) | 11mo | $199,999 | $166 | 56 |
| 13375 Furyk Dr | 0.74mi | 3/2.0 | 1,213 (+2%) | 9mo | $202,999 | $167 | 55 |
| 822 Eight Iron | 0.54mi | 3/2.0 | 1,106 (-7%) | 11mo | $182,900 | $165 | 53 |
| 11231 Five Iron | 0.68mi | 3/2.0 | 1,106 (-7%) | 7mo | $150,000 | $136 | 51 |
| 13119 Club House Blvd | 0.74mi | 3/2.0 | 1,242 (+4%) | 10mo | $208,410 | $168 | 50 |
| 1111 Crenshaw Way | 0.53mi | 3/2.0 | 1,266 (+6%) | 18mo | $190,999 | $151 | 50 |
| 13438 Laffoon Way | 0.74mi | 3/2.0 | 1,354 (+14%) | 17mo | $192,999 | $143 | 28 |
Match score weights: distance 35% · size 25% · config 20% · recency 20%. Top-matched comps best support the ARV.
Projected returns pro-forma
2.03% appreciation · 0.0% rent growth · sell at horizon
- IRR
- -3.2%
- Equity multiple
- 0.83×
- Total profit
- $-9,582
- Equity at exit
- $78,797
- IRR
- 0.0%
- Equity multiple
- 1.01×
- Total profit
- $304
- Equity at exit
- $113,705
Cash invested: $55,720 (down + closing). Projections, not guarantees.
Landlord ↔ Tenant lean methodology
- Overall (STATE)
- 87 Strongly Landlord-Friendly
- State Texas
- 87 Strongly Landlord-Friendly · R+5
- County
- — inherits STATE
- City
- — inherits STATE
ZIP-level market 78221
- Home prices YoY
- 0.8%
- Rents YoY
- -7.2%
- Active inventory
- 389
- Price-to-rent
- 10.5×
Monthly cashflow live
- Estimated rent
- $1,580 high interval (Pro) →
- Mortgage (P&I)
- −$1,044
- Tax from tax record
- −$391 /mo · $4,692/yr
- Insurance
- −$83
- HOA
- −$29
- Vacancy / Maint / Mgmt
- −$332
- Net cashflow
- $-299
Break-even live
Sensitivity live
| Price | -10% $-186 | -5% $-242 | +0% $-299 | +5% $-355 | +10% $-411 |
|---|---|---|---|---|---|
| Rent | -10% $-423 | -5% $-361 | +0% $-299 | +5% $-236 | +10% $-174 |
| Rate | -1.0pp $-198 | -0.5pp $-248 | base $-299 | +0.5pp $-350 | +1.0pp $-403 |
UW: 25.0% down · 7.5% · 30yr · 1.5% tax · 5.0% vac · 8.0% maint · 8.0% mgmt
Financing live
Cash to close
- Down payment
- $49,750
- Closing costs
- $5,970
- Reserves months
- —
- Total cash needed
- —
Loan-product check · same deal, 3 products live
Conventional
25% down · 7.5% · 30yr
- Down + closing
- —
- Monthly P&I
- —
- Monthly cashflow
- —
- DSCR
- —
- Eligible?
- —
Personal DTI + credit; lowest rate.
DSCR
20% down · 8.5% · 30yr
- Down + closing
- —
- Monthly P&I
- —
- Monthly cashflow
- —
- DSCR
- —
- Eligible?
- —
No personal income docs; deal must DSCR.
Hard money
10% down · 12.0% · 12mo
- Down + closing
- —
- Monthly P&I
- —
- Monthly cashflow
- —
- DSCR
- —
- Eligible?
- —
Short-term bridge; refi at stabilization.
Rent comps 19 comps
| Address | Beds | Baths | Sqft | Rent | $/sqft | DOM | Units | Dist |
|---|---|---|---|---|---|---|---|---|
| 12030 Picard Bnd San Antonio, TX | 3.0 | 2.0 | 1450 | $1,495 | $1.03 | 5d | 1 | 0.23mi |
| 718 Albatross Way San Antonio, TX | 3.0 | 2.0 | 1436 | $1,650 | $1.15 | 14d | 1 | 0.25mi |
| 12055 Links Pkwy San Antonio, TX | 3.0 | 2.0 | 1479 | $1,625 | $1.10 | 25d | 1 | 0.30mi |
| 11963 Sand Wedge Way San Antonio, TX | 3.0 | 3.5 | 1474 | $1,575 | $1.07 | 6d | 1 | 0.33mi |
| 1327 Mission Grande Unit 710 San Antonio, TX | 2.0 | 2.0 | 945 | $1,073 | $1.14 | 0d | 1 | 0.45mi |
| 12910 Clubhouse Blvd San Antonio, TX | 1.0–3.0 | 1.0–2.0 | 920 | $1,364 | $1.48 | 0d | 26 | 0.47mi |
| 1343 Art Wall Way San Antonio, TX | 3.0 | 2.0 | 1440 | $1,395 | $0.97 | 45d | 1 | 0.48mi |
| 13222 Dutra Rd San Antonio, TX | 3.0 | 2.0 | 1266 | $1,595 | $1.26 | 25d | 1 | 0.59mi |
| 907 Stricker Path San Antonio, TX | 3.0 | 2.0 | 1129 | $1,500 | $1.33 | 25d | 1 | 0.67mi |
| 1119 Jordan Xing San Antonio, TX | 3.0 | 2.0 | 1276 | $1,795 | $1.41 | 45d | 1 | 0.68mi |
| 1019 Magrum Way San Antonio, TX | 3.0 | 2.0 | 1300 | $1,445 | $1.11 | 12d | 1 | 0.70mi |
| 2203 Cielo Rio, Lot 102 San Antonio, TX | 2.0–4.0 | 2.0–2.5 | 1574 | $2,360 | $1.50 | 0d | 150 | 0.74mi |
| 1038 Janzen Rd San Antonio, TX | 3.0 | 2.0 | 1125 | $1,725 | $1.53 | 23d | 1 | 0.75mi |
| 1115 Janzen Rd San Antonio, TX | 3.0 | 2.0 | 1300 | $1,595 | $1.23 | 45d | 1 | 0.76mi |
| 1019 Snedeker Dr San Antonio, TX | 3.0 | 2.0 | 1200 | $1,449 | $1.21 | 25d | 1 | 0.78mi |
| 1015 Catalonia Pass San Antonio, TX | 3.0 | 2.0 | 1280 | $1,600 | $1.25 | 6d | 1 | 1.20mi |
| 1011 Catalonia Pass San Antonio, TX | 3.0 | 2.5 | 1470 | $1,700 | $1.16 | 25d | 1 | 1.20mi |
| 1003 Beck Rd San Antonio, TX | 3.0 | 2.0 | 1213 | $1,490 | $1.23 | 6d | 1 | 1.21mi |
| 1030 Snedeker DR San Antonio, TX | 4.0 | 2.0 | 1500 | $1,499 | $1.00 | 25d | 1 | 1.21mi |
HOA detail
- Monthly dues
- $29 · $348/yr
- Likely covers
- electric
Listing history 3 events
-
2026-05-18historical Active Option 402-char remark
-
2026-05-14price $199,000 402-char remark
-
2026-05-12$212,500 New 402-char remark
ⓘ Source: listings_history table (triggers on properties + properties_extension) + one-shot
backfill from property_details.listing_events for pre-trigger history.
Tax reassessment forecast TX · Resets to sale price
- Current annual tax
- $4,692 · $391/mo
- Projected year-2 tax
- $4,692 · $391/mo
- Expected delta
- $0/yr ($0/mo · 0.0%)
ⓘ Screening estimate from a state-policy table — verify with the county assessor before closing.
Climate risk First Street
- Flood 1/10 Low FEMA zone X (unshaded) · 0% chance over 30 yrs
- Wildfire 5/10 Major
- Heat 8/10 Severe 7 d/yr ≥109°F today · 22 d/yr by 30 yrs out
- Wind 8/10 Severe 80% chance of damaging wind over 30 yrs
- Air quality 2/10 Low 0 unhealthy d/yr today · 1 by 30 yrs out
Nearby sold comps map
Loading sold comps map…
Walkable amenities ~0.75 mi
Loading nearby amenities…
Taxation est. · year 1
- Rental income
- $18,956
- − Mortgage interest
- −$11,147
- − Property taxes
- −$4,692
- − Insurance
- −$995
- − Repairs & maintenance
- −$1,516
- − Management
- −$1,516
- − HOA
- −$348
- − Depreciation
- −$5,789
- Taxable loss
- −$7,048
- Est. tax savings @ 24.0%
- +$1,691
- After-tax cash flow
- $-1,891/yr
For passive investors: Depreciation is non-cash, so a rental often shows a tax loss while cash-flowing — sheltering income. Rental losses are passive: they offset passive income freely, and up to $25,000/yr can offset ordinary (W-2) income if you actively participate and your MAGI is under $100k (phasing out to $0 by $150k); unused losses carry forward. On sale, claimed depreciation is recaptured at up to 25%, and gains may owe capital-gains tax (a 1031 exchange can defer both). Figures are a year-1 estimate at your 24.0% rate — not tax advice; consult a CPA.
Schools (NCES district)
- District
- Southside ISD
- NCES district ID
- 4840920
- Math proficiency
- 16% ▼ -15.00%
- Reading proficiency
- 25% ▼ -2.00%
- Median HH income
- $43,526
- Composite
- 17.68/100
- National rank
- #9027
- State rank
- #771 of 826 in TX
Livability — San Antonio
- Score
- 80/100
- State rank
- #31
- US rank
- #1616
Category grades
Schools grade is shown separately in the Schools card above.
Census & demographics
- Census place
- San Antonio, TX
- County
- Bexar County · 1,990,555 people
- City population
- 1,806,925
- Metro
- San Antonio-New Braunfels, TX
- Population (ZIP)
- 42,178
- Household income
- $63,811
- Rent vs Own
- Severe rent burden
- 1180.0
Population outlook (Bexar County) Hauer SSP2
- Today (2025)
- 2,336,851 people
- By 2030
- 2,560,728 · +9.6%
- By 2040
- 3,020,569 · +29.3%
- By 2050
- 3,493,522 · +49.5%
- By 2075
- 4,668,459 · +99.8%
- By 2100
- 5,533,242 · +136.8%
Race, ethnicity, and origin ACS 2023
- Neighborhood character
- Predominantly Hispanic (89%)
- Race & ethnicity
- Hispanic / Latino 89% Two or more races 28% White 9% Native American 2%
- Hispanic origin (detail)
- Mexican 74%
- Common ancestry
- Lithuanian 1% Romanian 1%
- Foreign-born
- 16% · Canada
- Languages at home
- 45% English-only · Spanish 54%
Political lean MEDSL · Bexar
- 2024 margin
- Lean D (+9.8) · D 54.3% · R 44.6% · Other 1.1%
- 2008→2024 swing
- +4.2pp toward D · 2008: 5.6pp · 2024: 9.8pp
- All cycles
- 2024: D+9.8 2020: D+18.2 2016: D+13.5 2012: D+4.6 2008: D+5.6
Not yet ingested
- Civics
- —
Market trends
- HPI YoY
- ▲ 2.03%
- Current HPI
- 251.1635
- Rent YoY
- ▼ -7.21%
- Metro
- San Antonio-New Braunfels, TX
- State GDP YoY
- ▲ 3.95%
- F500 in state
- 110
Industry mix (Fortune 500 HQ in TX)
| Industry | F500 HQs | Revenue |
|---|---|---|
| Energy | 16 | $1,198B |
|
||
| Technology | 5 | $198B |
|
||
| Engineering / Construction | 4 | $72B |
|
||
| Energy Services | 3 | $60B |
|
||
| Utilities | 3 | $41B |
|
||
| Healthcare | 2 | $330B |
|
||
Price history
-6.4% since first listed5 events — show timeline
- 2026-06-12 Sold (MLS) — LERA
- 2026-05-28 Pending — LERA
- 2026-05-18 Contingent — LERA
- 2026-05-14 Price Changed $199,000 LERA
- 2026-05-12 Listed $212,500 LERA
Property tax history
+45.4%/yrLatest (2025): $4,692 · -3.4% YoY. Source: county tax records.
Cash-flow waterfall
monthlySold comps — $/sqft
last 12 mo · ≤1 miLoading sold comps…