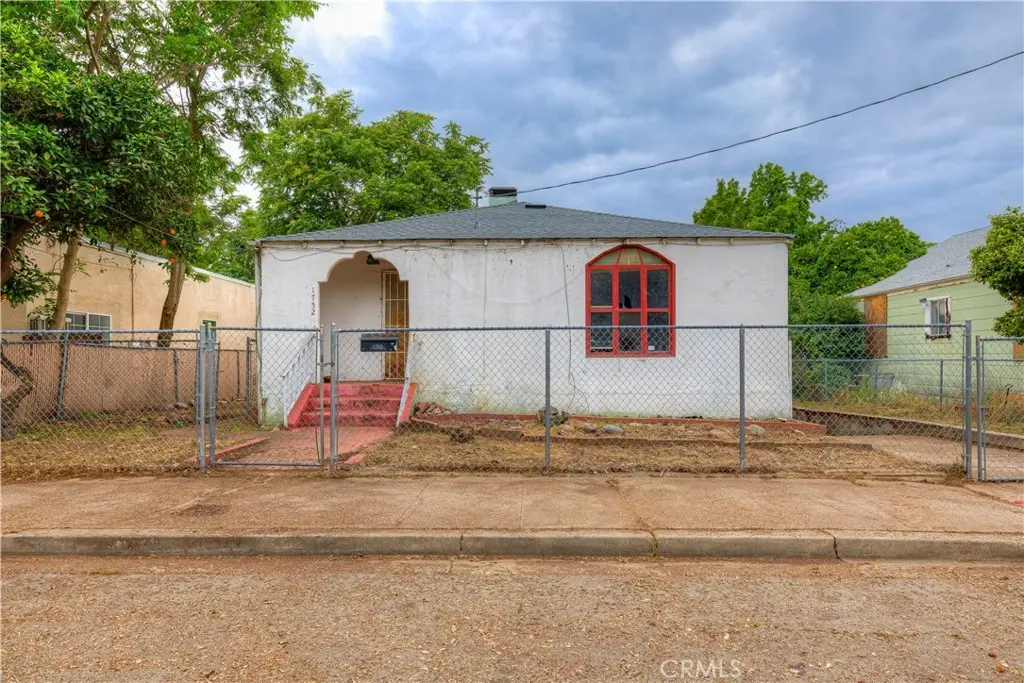
1752 Gray · Oroville, CA
Flood risk 1/10 · Minimal
- FEMA flood zone
- X (unshaded)
- Chance of flooding over 30 yrs
- 0.0%
- Est. flood insurance / yr
- $507 – $1,088
Fire risk 9/10 · Severe
- Est. fire insurance / yr
- $659 – $1,223
Heat risk 8/10 · Major
- Hot days now (above 105°F)
- 7 days/yr
- Hot days in 30 yrs
- 16 days/yr
Wind risk 1/10 · Minimal
- Chance of severe wind over 30 yrs
- —
Air-quality risk 10/10 · Severe
- Unhealthy air days now
- 34 days/yr
- Unhealthy air days in 30 yrs
- 39 days/yr
Risk factors via First Street. Map © Google.
Why this score? — see what drove the C+ grade
The composite is a weighted blend of 9 inputs, each scored 0–100. Each bar is that input's sub-score; the figure is the points it added to the 100-point composite (weight × sub-score).
- Cash flow +26.4/30.0
- DSCR +9.0/10.0
- 1% rule +7.6/10.0
- ARV discount +7.5/15.0
- Rent growth +3.0/5.0
- Schools +2.8/10.0
- Livability +2.5/5.0
- Condition / age +2.5/5.0
- Appreciation +0.0/10.0
$149,000
🖨 Deal sheet 📄 Offer letter ✓ Due diligence
Listing remarks
New roof on this fixer upper. New shingled roof and new foam installed on the flat portion. Single car garage with an attached basement that can be used as a work shop area and the backyard has a green house perfect for a future gardener. This one is all cleaned out and is a clean slate ready for a fix and flip rehab. Come take a look, do the numbers and submit your offer!!
Key facts
- Work shop area
- Attached basement
- Green house
Tags
Property features AI
Finance
- Other: Lot density approximately 2–5 units per acre; Living area and lot size sourced from assessor/public records
Exterior
- Parking: Attached garage (1-car)
- Utilities: Public sewer; District/public water
- Home design: Single-family house; Single-story; No attached ADU
- Construction: Year built reported from public records; No common walls
- Exterior features: No pool; Has a view; Curbs
Interior
- Bedrooms: Three bedrooms on the main level
- Bathrooms: One full bathroom
- Heating & cooling: Central heating (furnace); Central cooling
- Interior features: One-story layout; All bedrooms on the main level; Main-level entry
- Laundry & utility: Dedicated laundry room
Neighborhood map
What this means for you Summary
Snapshot
- This is a 2-bed/1.0-bath single-family listed at $149k.
Deal economics
- At list price, monthly cash flow is $390 ($5k/yr) — positive.
- The deal already cash-flows at list — no discount required.
- Meets the 1% rule at list price ($2k rent vs $149k).
- Recommended offer: $145k (3.0% below list) — sets the bar for market timing.
- Cap rate 9.4% vs local median 4.6% in Oroville — top-decile yield for the area; either an underpriced asset or a hidden risk that comps aren't pricing in. Stress-test before assuming the spread holds.
Location & tenants
- Location reads 50/100 on livability (#1,136 in CA) — a working-class tenant base; expect higher turnover. Watch: schools D, cost of living D, crime F.
- Oroville Union High (town): math 19% / reading 49% proficiency, ranked #300 of 517 in CA (top 58%) — families likely to look elsewhere, expect single-tenant / working-renter base with shorter leases.
- Market conditions: Rents rising (+1.9%/yr); 167 active listings in the ZIP; 3 comparable units currently listed for rent nearby; rentals leasing fast (median 14d on market — plan ~1-2 weeks tenant-placement turnaround); 946 units permitted in Butte County in 2024 (254 in 5+ unit buildings).
- This rent runs 42% of the median local income ($53k/yr) — at the standard rent-burdened threshold; future hikes will face affordability resistance.
Forward outlook
- Local home prices are declining (-3.0%/yr); year-one equity from $1k of loan paydown is wiped out by about $4k of value loss. Plan a longer hold.
- Butte County population projected at +10% by 2050 — modest demand growth; plan on rents tracking national, not racing it.
Negotiation context
- It's been on market 39 days — a 3% lower offer ($145k) is reasonable based on typical stale-listing flexibility.
- Current owner paid $77k; list at $149k implies a 94% gain — meaningful room to come down on a strong offer.
Risks & watch-outs
- Watch-outs: built in 1945 — expect roof / HVAC / electrical / plumbing capex.
- Climate carrying-cost: severe wildfire risk; extreme-heat days projected 7→16/yr by 2055 (HVAC capex compounding) — expect insurance premiums to compound above CPI over the hold.
Questions for the listing agent
- It's been on market 39 days. Have you received any prior offers? Is the seller open to a 3% concession, seller financing, or rate buy-down credit?
- Built in 1945 — when were the roof, HVAC, electrical panel, plumbing, and water heater last replaced?
- Is there a deadline driving the sale (1031 exchange, divorce, estate, relocation)? That informs how much negotiation room exists.
- Schools are D-rated, which usually means shorter tenancies and higher turnover. Who's the typical renter profile here, and what's been the actual vacancy rate?
- Crime grade is F in this area — have there been break-ins, vandalism, or insurance claims at this property in the last 3 years? What carrier currently insures it and at what premium?
- What's the average days-on-market for RENTAL listings here right now (not sales)? A rising rental-DOM trend means longer vacancies and softer asking-rent achievability than the comps imply.
- What's the recent tenant-quality profile in this submarket — average credit score on applications, eviction rate, late-payment / NSF rate, and stable-employment percentage? A property-management company in the area should have these aggregated.
- How much new for-sale + rental construction is in the pipeline within 1–3 miles? Heavy new supply typically softens prices + rents 12–24 months out; constrained supply supports both.
Investment metrics
- 1% rule
- 1.26% ✓
- Cap rate
- 9.44%
- Cash-on-cash
- 11.23%
- DSCR
- 1.50
- GRM
- 6.6
CMA / ARV
- ARV (on-the-fly)
- $298,508
- Comps found
- 12
Show comp detail 12 sales within ~0.75 mi
| Address | Dist | Beds/Ba | Sqft | Sold | Price | $/sf | Match |
|---|---|---|---|---|---|---|---|
| 1233 1st | 0.32mi | 2/1.0 | 1,452 (-5%) | 1mo | $285,000 | $196 | 77 |
| 2025 Gray St | 0.11mi | 2/2.0 | 1,396 (-8%) | 8mo | $175,000 | $125 | 70 |
| 1645 High St | 0.11mi | 3/2.5 (+1) | 1,570 (+3%) | 14mo | $385,000 | $245 | 67 |
| 785 Bird St | 0.46mi | 2/1.0 | 1,361 (-11%) | 4mo | $246,000 | $181 | 58 |
| 2226 Perkins Ave | 0.55mi | 3/2.0 (+1) | 1,507 (-1%) | 10mo | $370,000 | $246 | 55 |
| 1215 Robinson St | 0.19mi | 3/2.0 (+1) | 1,318 (-14%) | 8mo | $213,000 | $162 | 53 |
| 1330 Pomona Ave | 0.09mi | 2/2.0 | 1,327 (-13%) | 22mo | $265,000 | $200 | 52 |
| 2050 Pine St | 0.12mi | 3/1.0 (+1) | 1,712 (+12%) | 23mo | $279,900 | $163 | 49 |
| 2231 Spencer Ave | 0.55mi | 3/2.0 (+1) | 1,500 (-2%) | 21mo | $310,000 | $207 | 46 |
| 1155 1st Ave | 0.37mi | 2/1.0 | 1,350 (-11%) | 24mo | $255,000 | $189 | 44 |
| 758 Bird St | 0.49mi | 3/1.0 (+1) | 1,683 (+10%) | 23mo | $250,000 | $149 | 36 |
| 2060 Perkins Ave | 0.54mi | 3/1.5 (+1) | 1,326 (-13%) | 20mo | $290,000 | $219 | 29 |
Match score weights: distance 35% · size 25% · config 20% · recency 20%. Top-matched comps best support the ARV.
Projected returns pro-forma
-3.0% appreciation · 1.88% rent growth · sell at horizon
- IRR
- -0.8%
- Equity multiple
- 0.97×
- Total profit
- $-1,304
- Equity at exit
- $22,216
- IRR
- 7.6%
- Equity multiple
- 1.55×
- Total profit
- $22,758
- Equity at exit
- $12,883
Cash invested: $41,720 (down + closing). Projections, not guarantees.
Landlord ↔ Tenant lean methodology
- Overall (STATE)
- 18 Strongly Tenant-Friendly
- State California
- 18 Strongly Tenant-Friendly · D+13
- County
- — inherits STATE
- City
- — inherits STATE
ZIP-level market 95965
- Home prices YoY
- -31.6%
- Rents YoY
- 1.9%
- Active inventory
- 167
- Price-to-rent
- 6.6×
Monthly cashflow live
- Estimated rent
- $1,879 medium interval (Pro) →
- Mortgage (P&I)
- −$781
- Tax from tax record
- −$251 /mo · $3,007/yr
- Insurance
- −$62
- HOA
- −$0
- Vacancy / Maint / Mgmt
- −$395
- Net cashflow
- $390
Break-even live
UW: 25.0% down · 7.5% · 30yr · 1.5% tax · 5.0% vac · 8.0% maint · 8.0% mgmt
Financing live
Cash to close
- Down payment
- $37,250
- Closing costs
- $4,470
- Reserves months
- —
- Total cash needed
- —
Loan-product check · same deal, 3 products live
Conventional
25% down · 7.5% · 30yr
- Down + closing
- —
- Monthly P&I
- —
- Monthly cashflow
- —
- DSCR
- —
- Eligible?
- —
Personal DTI + credit; lowest rate.
DSCR
20% down · 8.5% · 30yr
- Down + closing
- —
- Monthly P&I
- —
- Monthly cashflow
- —
- DSCR
- —
- Eligible?
- —
No personal income docs; deal must DSCR.
Hard money
10% down · 12.0% · 12mo
- Down + closing
- —
- Monthly P&I
- —
- Monthly cashflow
- —
- DSCR
- —
- Eligible?
- —
Short-term bridge; refi at stabilization.
Rent comps 3 comps
| Address | Beds | Baths | Sqft | Rent | $/sqft | DOM | Units | Dist |
|---|---|---|---|---|---|---|---|---|
| 1189 High St Oroville, CA | 3.0 | 2.0 | 1462 | $1,850 | $1.27 | 13d | 1 | 0.18mi |
| 1481 Montgomery St Oroville, CA | 2.0 | 2.0 | 1440 | $2,400 | $1.67 | 13d | 1 | 0.23mi |
| 2850 Myers St Oroville, CA | 3.0 | 2.0 | 1095 | $2,200 | $2.01 | 13d | 1 | 0.70mi |
Listing history 18 events
-
2026-06-19days on market $149,000 Active 39 DOM
-
2026-06-18days on market $149,000 Active 38 DOM
-
2026-06-17days on market $149,000 Active 37 DOM
-
2026-06-16days on market $149,000 Active 36 DOM
-
2026-06-15days on market $149,000 Active 35 DOM
-
2026-06-14days on market $149,000 Active 33 DOM
-
2026-06-13days on market $149,000 Active 32 DOM
-
2026-06-10days on market $149,000 Active 30 DOM
-
2026-06-09days on market $149,000 Active 29 DOM
-
2026-06-09price $149,000 Active 28 DOM
-
2026-06-08days on market $159,000 Active 28 DOM
-
2026-06-07days on market $159,000 Active 27 DOM
-
2026-06-02days on market $159,000 Active 22 DOM
-
2026-06-01days on market $159,000 Active 21 DOM
-
2026-05-31days on market $159,000 Active 20 DOM
-
2026-05-30days on market $159,000 Active 19 DOM
-
2026-05-11$159,000 Active
-
2001-07-24soldstatus $77,000
ⓘ Source: listings_history table (triggers on properties + properties_extension) + one-shot
backfill from property_details.listing_events for pre-trigger history.
Tax reassessment forecast CA · Resets to sale price
- Current annual tax
- $3,007 · $251/mo
- Projected year-2 tax
- $3,007 · $251/mo
- Expected delta
- $0/yr ($0/mo · 0.0%)
ⓘ Screening estimate from a state-policy table — verify with the county assessor before closing.
Climate risk First Street
- Flood 1/10 Low FEMA zone X (unshaded) · 0% chance over 30 yrs
- Wildfire 9/10 Extreme
- Heat 8/10 Severe 7 d/yr ≥105°F today · 16 d/yr by 30 yrs out
- Wind 1/10 Low
- Air quality 10/10 Extreme 34 unhealthy d/yr today · 39 by 30 yrs out
Nearby sold comps map
Loading sold comps map…
Walkable amenities ~0.75 mi
Loading nearby amenities…
Taxation est. · year 1
- Rental income
- $22,548
- − Mortgage interest
- −$8,346
- − Property taxes
- −$3,007
- − Insurance
- −$745
- − Repairs & maintenance
- −$1,804
- − Management
- −$1,804
- − Depreciation
- −$4,335
- Taxable income
- $2,508
- Est. tax owed @ 24.0%
- −$602
- After-tax cash flow
- $4,083/yr
For passive investors: Depreciation is non-cash, so a rental often shows a tax loss while cash-flowing — sheltering income. Rental losses are passive: they offset passive income freely, and up to $25,000/yr can offset ordinary (W-2) income if you actively participate and your MAGI is under $100k (phasing out to $0 by $150k); unused losses carry forward. On sale, claimed depreciation is recaptured at up to 25%, and gains may owe capital-gains tax (a 1031 exchange can defer both). Figures are a year-1 estimate at your 24.0% rate — not tax advice; consult a CPA.
Schools (NCES district)
- District
- Oroville Union High
- NCES district ID
- 0629130
- Math proficiency
- 19% ▼ -2.00%
- Reading proficiency
- 49% ▼ -4.00%
- Median HH income
- $38,085
- Composite
- 28.26/100
- National rank
- #6794
- State rank
- #300 of 517 in CA
Livability — Oroville
- Score
- 50/100
- State rank
- #1136
- US rank
- #25715
Category grades
Schools grade is shown separately in the Schools card above.
Census & demographics
- Census place
- Oroville, CA
- County
- Butte County · 175,030 people
- City population
- 49,684
- Metro
- Chico, CA
- Population (ZIP)
- 21,181
- Household income
- $53,198
- Rent vs Own
- Severe rent burden
- 892.0
Population outlook (Butte County) Hauer SSP2
- Today (2025)
- 237,527 people
- By 2030
- 243,804 · +2.6%
- By 2040
- 253,899 · +6.9%
- By 2050
- 262,561 · +10.5%
- By 2075
- 283,709 · +19.4%
- By 2100
- 282,689 · +19.0%
Race, ethnicity, and origin ACS 2023
- Neighborhood character
- Diverse neighborhood (Simpson 0.68)
- Race & ethnicity
- White 50% Hispanic / Latino 20% Asian 16% Two or more races 13% Black 3% Native American 3%
- Hispanic origin (detail)
- Mexican 19%
- Common ancestry
- Lithuanian 2% Iranian 2% Russian 1%
- Foreign-born
- 12% · Canada
- Languages at home
- 75% English-only · Spanish 13% Other Asian/Pacific 10% Tagalog/Filipino 1%
Political lean MEDSL · Butte
- 2024 margin
- Toss-up / Even · D 46.8% · R 49.9% · Other 3.3%
- 2008→2024 swing
- -5.5pp toward R · 2008: 2.4pp · 2024: -3.1pp
- All cycles
- 2024: R+3.1 2020: D+1.7 2016: R+4.0 2012: R+3.9 2008: D+2.4
Not yet ingested
- Civics
- —
Market trends
- HPI YoY
- ▼ -146.76%
- Current HPI
- 317.0277
- Rent YoY
- ▲ 1.88%
- Metro
- Chico, CA
- State GDP YoY
- ▲ 3.21%
- F500 in state
- 116
Industry mix (Fortune 500 HQ in CA)
| Industry | F500 HQs | Revenue |
|---|---|---|
| Technology | 27 | $1,492B |
|
||
| Financial Services | 3 | $174B |
|
||
| Retail | 3 | $44B |
|
||
| Insurance | 3 | $26B |
|
||
| Media / Entertainment | 2 | $115B |
|
||
| Pharmaceuticals / Biotech | 2 | $62B |
|
||
Price history
+106.5% since first listed2 events — show timeline
- 2026-05-11 Listed $159,000 CRMLS
- 2001-07-24 Sold (Public Records) $77,000 Public Records
Property tax history
+5.2%/yrLatest (2025): $3,007 · +2.1% YoY. Source: county tax records.
Cash-flow waterfall
monthlySold comps — $/sqft
last 12 mo · ≤1 miLoading sold comps…