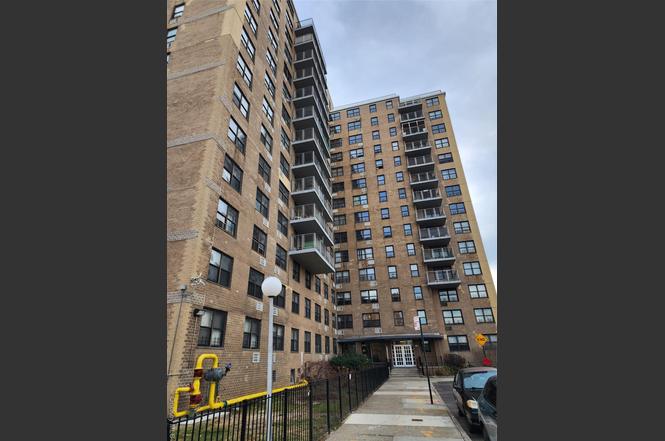
1966 Newbold Ave #1502 · New York, NY
Flood risk 1/10 · Minimal
- FEMA flood zone
- X (unshaded)
- Chance of flooding over 30 yrs
- 0.0%
- Est. flood insurance / yr
- $507 – $1,088
Fire risk 1/10 · Minimal
- Est. fire insurance / yr
- $691 – $1,283
Heat risk 6/10 · Moderate
- Hot days now (above 99°F)
- 7 days/yr
- Hot days in 30 yrs
- 15 days/yr
Wind risk 6/10 · Moderate
- Chance of severe wind over 30 yrs
- 27.0%
Air-quality risk 4/10 · Minor
- Unhealthy air days now
- 5 days/yr
- Unhealthy air days in 30 yrs
- 6 days/yr
Risk factors via First Street. Map © Google.
Why this score? — see what drove the B+ grade
The composite is a weighted blend of 9 inputs, each scored 0–100. Each bar is that input's sub-score; the figure is the points it added to the 100-point composite (weight × sub-score).
- Cash flow +29.0/30.0
- 1% rule +10.0/10.0
- DSCR +10.0/10.0
- ARV discount +7.5/15.0
- Appreciation +7.0/10.0
- Schools +5.0/10.0
- Livability +3.8/5.0
- Rent growth +2.5/5.0
- Condition / age +2.5/5.0
$180,000
🖨 Deal sheet 📄 Offer letter ✓ Due diligence
Listing remarks
LOCATION, CONVENIENCE, AND POTENTIAL ALL IN ONE! This bright 2-bedroom HDFC co-op at Hugh Grant Gardens sits right in the center of Hugh Grant Circle in the vibrant Parkchester area. Enjoy a spacious layout with a living room, dining area, galley kitchen, 1 bath, great closet space, and your own private balcony. Bring your vision and make this home truly yours! The complex offers beautifully landscaped grounds, laundry, a community room, handicap-accessible entry, and nearby parking (waiting list). You're close to EVERYTHING — supermarkets, shopping, restaurants, major highways, and transportation galore, including the #6 train and buses Bx4A, Bx4, Bx36, Bx39, and Q44. Renting allowed
Key facts
- Landscaped grounds
- Private balcony
- Nearby parking
Tags
Neighborhood map
What this means for you Summary
Snapshot
- This is a 2-bed/1.0-bath condo listed at $180k.
Deal economics
- At list price, monthly cash flow is $615 ($7k/yr) — positive.
- The deal already cash-flows at list — no discount required.
- Meets the 1% rule at list price ($4k rent vs $180k).
- Recommended offer: $175k (3.0% below list) — sets the bar for market timing.
- Cap rate 10.4% vs local median 2.6% in New York — top-decile yield for the area; either an underpriced asset or a hidden risk that comps aren't pricing in. Stress-test before assuming the spread holds.
Location & tenants
- Location reads 75/100 on livability (#268 in NY, #4,188 nationally) — a middle-class / working-renter tenant base. Strengths: amenities A+, commute A+, health & safety A; Watch: crime F, cost of living F.
- Market conditions: 53 active listings in the ZIP; 1 comparable units currently listed for rent nearby; 6,929 units permitted in Bronx County in 2024 (6,829 in 5+ unit buildings).
Forward outlook
- In year one you build about $9k of equity ($1k loan paydown + $7k appreciation (4.1% local appreciation)).
- Bronx County population projected at +21% by 2050 — long-run rental-demand tailwind backs the buy-and-hold thesis.
- At projected returns (4.1% appreciation + 3.0% rent growth), your $50k cash investment doubles in ~3 years — after that, you're playing with house money.
- By year 5, paydown + projected appreciation supports a ~$37k cash-out refi (75% LTV) — recoverable capital for the next deal without selling this one.
Negotiation context
- It's been on market 55 days — a 3% lower offer ($175k) is reasonable based on typical stale-listing flexibility.
Risks & watch-outs
- Watch-outs: HOA is 28% of rent.
- Climate carrying-cost: major wind risk, 27% chance of damaging wind over 30y; extreme-heat days projected 7→15/yr by 2055 (HVAC capex compounding) — expect insurance premiums to compound above CPI over the hold.
Questions for the listing agent
- It's been on market 55 days. Have you received any prior offers? Is the seller open to a 3% concession, seller financing, or rate buy-down credit?
- Built in 1967 — when were the roof, HVAC, electrical panel, plumbing, and water heater last replaced?
- What does the HOA fee cover, when was the last increase, and are there any pending special assessments or reserve-fund shortfalls?
- Any open or pending special assessments — roof, HVAC, plumbing, elevator, façade? What's the per-unit balance and payoff schedule, and is the seller paying it off at close or rolling it to the buyer?
- Is there a deadline driving the sale (1031 exchange, divorce, estate, relocation)? That informs how much negotiation room exists.
- Schools are B-rated — typically a magnet for longer-tenancy family renters. What's the average tenant stay here, and is there a school-zone premium baked into asking?
- Crime grade is F in this area — have there been break-ins, vandalism, or insurance claims at this property in the last 3 years? What carrier currently insures it and at what premium?
- What's the average days-on-market for RENTAL listings here right now (not sales)? A rising rental-DOM trend means longer vacancies and softer asking-rent achievability than the comps imply.
- What's the recent tenant-quality profile in this submarket — average credit score on applications, eviction rate, late-payment / NSF rate, and stable-employment percentage? A property-management company in the area should have these aggregated.
- How much new apartment / multifamily construction is in the pipeline within 1–3 miles? Heavy new supply (>2% of stock underway) typically softens rents 12–24 months out; light construction supports rent growth.
Investment metrics
- 1% rule
- 2.02% ✓
- Cap rate
- 10.39%
- Cash-on-cash
- 14.64%
- DSCR
- 1.65
- GRM
- 4.1
CMA / ARV
No comps found within radius.
Projected returns pro-forma
4.08% appreciation · 3.0% rent growth · sell at horizon
- IRR
- 23.8%
- Equity multiple
- 2.43×
- Total profit
- $72,067
- Equity at exit
- $92,138
- IRR
- 23.9%
- Equity multiple
- 4.77×
- Total profit
- $190,200
- Equity at exit
- $151,402
Cash invested: $50,400 (down + closing). Projections, not guarantees.
Landlord ↔ Tenant lean methodology
- Overall (CITY)
- 0 Strongly Tenant-Friendly
- State New York
- 15 Strongly Tenant-Friendly · D+10
- County
- — inherits STATE
- City New York
- 0 Strongly Tenant-Friendly · D+34
ZIP-level market 10472
- Home prices YoY
- 1.8%
- Active inventory
- 53
- Price-to-rent
- 4.1×
Monthly cashflow live
- Estimated rent
- $3,643 medium interval (Pro) →
- Mortgage (P&I)
- −$944
- Tax est. 1.5%
- −$225 /mo · $2,700/yr
- Insurance
- −$75
- HOA est. from 1 same-building comp
- −$1,019
- Vacancy / Maint / Mgmt
- −$765
- Net cashflow
- $615
Break-even live
UW: 25.0% down · 7.5% · 30yr · 1.5% tax · 5.0% vac · 8.0% maint · 8.0% mgmt
Financing live
Cash to close
- Down payment
- $45,000
- Closing costs
- $5,400
- Reserves months
- —
- Total cash needed
- —
Loan-product check · same deal, 3 products live
Conventional
25% down · 7.5% · 30yr
- Down + closing
- —
- Monthly P&I
- —
- Monthly cashflow
- —
- DSCR
- —
- Eligible?
- —
Personal DTI + credit; lowest rate.
DSCR
20% down · 8.5% · 30yr
- Down + closing
- —
- Monthly P&I
- —
- Monthly cashflow
- —
- DSCR
- —
- Eligible?
- —
No personal income docs; deal must DSCR.
Hard money
10% down · 12.0% · 12mo
- Down + closing
- —
- Monthly P&I
- —
- Monthly cashflow
- —
- DSCR
- —
- Eligible?
- —
Short-term bridge; refi at stabilization.
Rent comps 1 comps
| Address | Beds | Baths | Sqft | Rent | $/sqft | DOM | Units | Dist |
|---|---|---|---|---|---|---|---|---|
| 620 Rosedale Ave Bronx, NY | 3.0 | 1.0 | 1053 | $3,643 | $3.46 | 24d | 1 | 1.06mi |
HOA detail condo
- Monthly dues
- $0 · $0/yr
- Likely covers
- landscaping
- Assessments
- None detected in remarks — confirm with the listing agent.
Listing history 2 events
-
2026-03-10status Pending
-
2026-01-14$180,000 Active
ⓘ Source: listings_history table (triggers on properties + properties_extension) + one-shot
backfill from property_details.listing_events for pre-trigger history.
Climate risk First Street
- Flood 1/10 Low FEMA zone X (unshaded) · 0% chance over 30 yrs
- Wildfire 1/10 Low
- Heat 6/10 Major 7 d/yr ≥99°F today · 15 d/yr by 30 yrs out
- Wind 6/10 Major 27% chance of damaging wind over 30 yrs
- Air quality 4/10 Moderate 5 unhealthy d/yr today · 6 by 30 yrs out
Nearby sold comps map
Loading sold comps map…
Walkable amenities ~0.75 mi
Loading nearby amenities…
Taxation est. · year 1
- Rental income
- $43,716
- − Mortgage interest
- −$10,083
- − Property taxes
- −$2,700
- − Insurance
- −$900
- − Repairs & maintenance
- −$3,497
- − Management
- −$3,497
- − HOA
- −$12,228
- − Depreciation
- −$5,236
- Taxable income
- $5,574
- Est. tax owed @ 24.0%
- −$1,338
- After-tax cash flow
- $6,043/yr
For passive investors: Depreciation is non-cash, so a rental often shows a tax loss while cash-flowing — sheltering income. Rental losses are passive: they offset passive income freely, and up to $25,000/yr can offset ordinary (W-2) income if you actively participate and your MAGI is under $100k (phasing out to $0 by $150k); unused losses carry forward. On sale, claimed depreciation is recaptured at up to 25%, and gains may owe capital-gains tax (a 1031 exchange can defer both). Figures are a year-1 estimate at your 24.0% rate — not tax advice; consult a CPA.
Schools (NCES district)
No district data.
Livability — New York
- Score
- 75/100
- State rank
- #268
- US rank
- #4188
Category grades
Schools grade is shown separately in the Schools card above.
Census & demographics
- Census place
- New York, NY
- City population
- 7,731,280
- Population (ZIP)
- 63,820
Population outlook (Bronx County) Hauer SSP2
- Today (2025)
- 1,607,353 people
- By 2030
- 1,681,852 · +4.6%
- By 2040
- 1,824,421 · +13.5%
- By 2050
- 1,945,470 · +21.0%
- By 2075
- 2,187,887 · +36.1%
- By 2100
- 2,244,136 · +39.6%
Race, ethnicity, and origin ACS 2023
- Neighborhood character
- Diverse neighborhood (Simpson 0.56)
- Race & ethnicity
- Hispanic / Latino 62% Black 23% Two or more races 9% Asian 8% White 2% Native American 1%
- Hispanic origin (detail)
- Mexican 8% Puerto Rican 20% Cuban 1% Dominican 20%
- Foreign-born
- 40% · Canada, Jamaica
- Languages at home
- 36% English-only · Spanish 52% Other Indo-European 7% French/Haitian/Cajun 2%
Political lean MEDSL · Bronx
- 2024 margin
- Solid D (+45.4) · D 72.7% · R 27.3%
- 2008→2024 swing
- -32.3pp toward R · 2008: 77.8pp · 2024: 45.4pp
- All cycles
- 2024: D+45.4 2020: D+67.6 2016: D+79.1 2012: D+82.9 2008: D+77.8
Not yet ingested
- Civics
- —
Market trends
- HPI YoY
- ▲ 4.08%
- Current HPI
- 236.8002
- Rent YoY
- —
- Metro
- —
- State GDP YoY
- ▲ 2.60%
- F500 in state
- 92
Industry mix (Fortune 500 HQ in NY)
| Industry | F500 HQs | Revenue |
|---|---|---|
| Financial Services | 10 | $950B |
|
||
| Consumer Goods | 9 | $162B |
|
||
| Insurance | 4 | $225B |
|
||
| Telecommunications | 2 | $144B |
|
||
| Pharmaceuticals | 2 | $112B |
|
||
| Media / Entertainment | 2 | $69B |
|
||
Price history
2 events — show timeline
- 2026-03-10 Pending — OneKey® MLS as Distributed by MLS Grid
- 2026-01-14 Listed $180,000 OneKey® MLS as Distributed by MLS Grid
Cash-flow waterfall
monthlySold comps — $/sqft
last 12 mo · ≤1 miLoading sold comps…