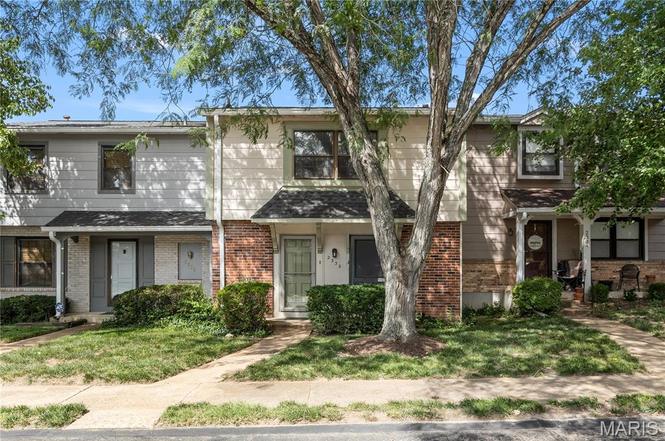
2332 Hidden Meadow Ln · Des Peres, MO
Flood risk 1/10 · Minimal
- FEMA flood zone
- X (unshaded)
- Chance of flooding over 30 yrs
- 0.0%
- Est. flood insurance / yr
- $473 – $860
Fire risk 1/10 · Minimal
- Est. fire insurance / yr
- $1,054 – $1,958
Heat risk 5/10 · Moderate
- Hot days now (above 106°F)
- 7 days/yr
- Hot days in 30 yrs
- 21 days/yr
Wind risk 2/10 · Minimal
- Chance of severe wind over 30 yrs
- 1.0%
Air-quality risk 2/10 · Minimal
- Unhealthy air days now
- 1 days/yr
- Unhealthy air days in 30 yrs
- 1 days/yr
Risk factors via First Street. Map © Google.
Why this score? — see what drove the C+ grade
The composite is a weighted blend of 9 inputs, each scored 0–100. Each bar is that input's sub-score; the figure is the points it added to the 100-point composite (weight × sub-score).
- Cash flow +20.9/30.0
- ARV discount +15.0/15.0
- 1% rule +8.0/10.0
- DSCR +6.7/10.0
- Schools +5.1/10.0
- Livability +3.4/5.0
- Rent growth +3.0/5.0
- Condition / age +2.5/5.0
- Appreciation +0.0/10.0
$180,000
🖨 Deal sheet (PDF) 📄 Offer letter ✓ Due diligence
Listing remarks
Move right into this charming townhouse offering comfort, style, and a serene setting. The main level features newer hardwood flooring throughout and an inviting open-concept layout. The kitchen showcases natural wood cabinetry, stainless steel appliances, a tile backsplash, and an eat-in dining area perfect for everyday living. A formal dining area is right off of the kitchen for holidays and family gatherings. The cozy family room includes a gas log fireplace and large sliding glass doors that open to a private wood deck overlooking a peaceful, tree-lined backdrop. Upstairs, you’ll find a spacious primary suite with a full bath and walk-in closet, along with two additional bedrooms
Key facts
- Hardwood flooring
- Eat-in dining area
- Formal dining area
Tags
Property features AI
Finance
- HOA & community: HOA managed by Sentry Management; Monthly HOA fee of $415; Community amenities: clubhouse, pool, tennis courts, parking; HOA covers clubhouse, grounds maintenance, parking/road maintenance, common area maintenance, pool maintenance, management, sewer, snow removal, trash and water
Exterior
- Parking: Attached garage (1-car)
- Utilities: Public water; Public sewer; 220 Volts electric service
- Home design: Residential townhouse; Two levels; Entry at main level
- Construction: Brick veneer and frame construction
- Exterior features: Landscaped, level lot with some trees; Community pool
Interior
- Kitchen: Electric cooktop; Electric range; Dishwasher; Disposal; Refrigerator
- Bedrooms: 3 bedrooms located on the upper level
- Bathrooms: 2 full bathrooms on upper level; 1 half bathroom on the main level
- Heating & cooling: Forced air heating (natural gas); Central air conditioning; Ceiling fans; 220-volt electric service
- Interior features: Gas fireplace in the living room; Concrete basement with daylight/lookout windows, egress window and storage space; 7 total rooms
- Laundry & utility: Washer and dryer included; Gas water heater
Neighborhood map
What this means for you Summary
Snapshot
- This is a 3-bed/2.5-bath townhouse listed at $180k.
Deal economics
- At list price, monthly cash flow is $252 ($3k/yr) — positive.
- The deal already cash-flows at list — no discount required.
- Meets the 1% rule at list price ($2k rent vs $180k).
- Cap rate 8.0% vs local median 1.9% in Des Peres — top-decile yield for the area; either an underpriced asset or a hidden risk that comps aren't pricing in. Stress-test before assuming the spread holds.
Location & tenants
- Location reads 67/100 on livability (#202 in MO) — a middle-class / working-renter tenant base. Strengths: employment A+, housing A+; Watch: amenities F, commute F, cost of living F.
- Parkway C-2 (suburban): math 49% / reading 62% proficiency, ranked #18 of 324 in MO (top 6%) — acceptable for families but not a draw, mixed tenant base, ~2y average lease; only 14% free/reduced lunch — higher-income household profile.
- Zoned schools: Barretts Elem. (math 67% / reading 67%, grade B+, #46 of 1,115 statewide, top 5%, 353 students, 7% FRL); South High (math 42% / reading 68%, grade C, #65 of 521 statewide, top 13%, 1,598 students, 23% FRL) — zoned schools at 15% FRL track the district average.
- Market conditions: Rents rising (+1.9%/yr); 244 active listings in the ZIP; 3 comparable units currently listed for rent nearby; rentals leasing fast (median 3d on market — plan ~1-2 weeks tenant-placement turnaround); high-income renter base; 920 units permitted in St. Louis County in 2024 (250 in 5+ unit buildings).
Forward outlook
- Local home prices are declining (-3.0%/yr); year-one equity from $1k of loan paydown is wiped out by about $5k of value loss. Plan a longer hold.
Negotiation context
- Only 2 days on market — expect competitive offers; lowballing is unlikely to land.
- Current owner paid $84k; list at $180k implies a 116% gain — meaningful room to come down on a strong offer.
Risks & watch-outs
- Climate carrying-cost: extreme-heat days projected 7→21/yr by 2055 (HVAC capex compounding) — expect insurance premiums to compound above CPI over the hold.
Questions for the listing agent
- Built in 1978 — when were the roof, HVAC, electrical panel, plumbing, and water heater last replaced?
- What does the HOA fee cover, when was the last increase, and are there any pending special assessments or reserve-fund shortfalls?
- Is there a deadline driving the sale (1031 exchange, divorce, estate, relocation)? That informs how much negotiation room exists.
- What's the average days-on-market for RENTAL listings here right now (not sales)? A rising rental-DOM trend means longer vacancies and softer asking-rent achievability than the comps imply.
- What's the recent tenant-quality profile in this submarket — average credit score on applications, eviction rate, late-payment / NSF rate, and stable-employment percentage? A property-management company in the area should have these aggregated.
- How much new for-sale + rental construction is in the pipeline within 1–3 miles? Heavy new supply typically softens prices + rents 12–24 months out; constrained supply supports both.
Investment metrics
- 1% rule
- 1.30% ✓
- Cap rate
- 7.97%
- Cash-on-cash
- 5.99%
- DSCR
- 1.27
- GRM
- 6.4
CMA / ARV
- ARV (on-the-fly)
- $219,765
- Comps found
- 10
Show comp detail 10 sales within ~0.75 mi
| Address | Dist | Beds/Ba | Sqft | Sold | Price | $/sf | Match |
|---|---|---|---|---|---|---|---|
| 2369 Hidden Meadow Ln | 0.07mi | 3/2.5 | 1,365 (0%) | 2mo | $170,000 | $125 | 95 |
| 2425 Hidden Meadow Ln | 0.13mi | 3/2.5 | 1,365 (0%) | 3mo | $200,000 | $147 | 92 |
| 2376 Hiddengarden Ct | 0.05mi | 3/2.5 | 1,365 (0%) | 8mo | $219,900 | $161 | 91 |
| 13338 Hiddendale Ln | 0.15mi | 2/2.5 (-1) | 1,250 (-8%) | 3mo | $185,000 | $148 | 72 |
| 13391 Hiddendale Ln | 0.10mi | 3/2.5 | 1,260 (-8%) | 17mo | $199,900 | $159 | 68 |
| 13613 Mason Oaks Ln #3 | 0.39mi | 2/3.5 (-1) | 1,362 (-0%) | 10mo | $260,000 | $191 | 64 |
| 13394 Hiddengarden Ct | 0.08mi | 3/1.5 | 1,536 (+12%) | 10mo | $169,000 | $110 | 64 |
| 13617 Mason Oaks Ln | 0.39mi | 2/2.5 (-1) | 1,362 (-0%) | 19mo | $260,000 | $191 | 61 |
| 629 Highview Circle Dr | 0.73mi | 3/2.0 | 1,365 (0%) | 23mo | $299,900 | $220 | 45 |
| 627 Highview Circle Dr | 0.73mi | 2/2.0 (-1) | 1,542 (+13%) | 18mo | $307,000 | $199 | 22 |
Match score weights: distance 35% · size 25% · config 20% · recency 20%. Top-matched comps best support the ARV.
Projected returns pro-forma
-3.0% appreciation · 1.94% rent growth · sell at horizon
- IRR
- -8.4%
- Equity multiple
- 0.70×
- Total profit
- $-15,358
- Equity at exit
- $26,839
- IRR
- -0.5%
- Equity multiple
- 0.97×
- Total profit
- $-1,636
- Equity at exit
- $15,563
Cash invested: $50,400 (down + closing). Projections, not guarantees.
Landlord ↔ Tenant lean methodology
- Overall (STATE)
- 81 Strongly Landlord-Friendly
- State Missouri
- 81 Strongly Landlord-Friendly · R+10
- County
- — inherits STATE
- City
- — inherits STATE
ZIP-level market 63021
- Rents YoY
- 1.9%
- Active inventory
- 244
- Price-to-rent
- 6.4×
Monthly cashflow live
- Estimated rent
- $2,342 medium interval (Pro) →
- Mortgage (P&I)
- −$944
- Tax from tax record
- −$165 /mo · $1,980/yr
- Insurance
- −$75
- HOA
- −$415
- Vacancy / Maint / Mgmt
- −$492
- Net cashflow
- $252
Break-even live
Sensitivity live
| Price | -10% $354 | -5% $303 | +0% $252 | +5% $201 | +10% $150 |
|---|---|---|---|---|---|
| Rent | -10% $67 | -5% $159 | +0% $252 | +5% $344 | +10% $437 |
| Rate | -1.0pp $342 | -0.5pp $297 | base $252 | +0.5pp $205 | +1.0pp $158 |
UW: 25.0% down · 7.5% · 30yr · 1.5% tax · 5.0% vac · 8.0% maint · 8.0% mgmt
Financing live
Cash to close
- Down payment
- $45,000
- Closing costs
- $5,400
- Reserves months
- —
- Total cash needed
- —
Loan-product check · same deal, 3 products live
Conventional
25% down · 7.5% · 30yr
- Down + closing
- —
- Monthly P&I
- —
- Monthly cashflow
- —
- DSCR
- —
- Eligible?
- —
Personal DTI + credit; lowest rate.
DSCR
20% down · 8.5% · 30yr
- Down + closing
- —
- Monthly P&I
- —
- Monthly cashflow
- —
- DSCR
- —
- Eligible?
- —
No personal income docs; deal must DSCR.
Hard money
10% down · 12.0% · 12mo
- Down + closing
- —
- Monthly P&I
- —
- Monthly cashflow
- —
- DSCR
- —
- Eligible?
- —
Short-term bridge; refi at stabilization.
Rent comps 3 comps
| Address | Beds | Baths | Sqft | Rent | $/sqft | DOM | Units | Dist |
|---|---|---|---|---|---|---|---|---|
| 13992 Reflection Dr Manchester, MO | 1.0–3.0 | 1.0–2.0 | 840 | $1,975 | $2.35 | 2d | 17 | 0.60mi |
| 12831 Daylight Dr Saint Louis, MO | 2.0–3.0 | 2.0 | 1166 | $3,657 | $3.14 | 17d | 8 | 1.17mi |
| 240 Hickory Hedge Dr Ballwin, MO | 1.0–3.0 | 1.0–1.5 | 1063 | $1,835 | $1.73 | 2d | 11 | 1.19mi |
HOA detail
- Monthly dues
- $415 · $4,980/yr
- Likely covers
- gas
Listing history 3 events
-
2026-06-21statusdays on market $180,000 Pending 2 DOM
-
2026-06-17remarks 693-char remark
-
2026-06-17$180,000 Active 1 DOM
ⓘ Source: listings_history table (triggers on properties + properties_extension) + one-shot
backfill from property_details.listing_events for pre-trigger history.
Tax reassessment forecast MO · Resets to sale price
- Current annual tax
- $1,980 · $165/mo
- Projected year-2 tax
- $1,980 · $165/mo
- Expected delta
- $0/yr ($0/mo · 0.0%)
ⓘ Screening estimate from a state-policy table — verify with the county assessor before closing.
Climate risk First Street
- Flood 1/10 Low FEMA zone X (unshaded) · 0% chance over 30 yrs
- Wildfire 1/10 Low
- Heat 5/10 Major 7 d/yr ≥106°F today · 21 d/yr by 30 yrs out
- Wind 2/10 Low 100% chance of damaging wind over 30 yrs
- Air quality 2/10 Low 1 unhealthy d/yr today · 1 by 30 yrs out
Nearby sold comps map
Loading sold comps map…
Walkable amenities ~0.75 mi
Loading nearby amenities…
Taxation est. · year 1
- Rental income
- $28,110
- − Mortgage interest
- −$10,083
- − Property taxes
- −$1,980
- − Insurance
- −$900
- − Repairs & maintenance
- −$2,249
- − Management
- −$2,249
- − HOA
- −$4,980
- − Depreciation
- −$5,236
- Taxable income
- $434
- Est. tax owed @ 24.0%
- −$104
- After-tax cash flow
- $2,916/yr
For passive investors: Depreciation is non-cash, so a rental often shows a tax loss while cash-flowing — sheltering income. Rental losses are passive: they offset passive income freely, and up to $25,000/yr can offset ordinary (W-2) income if you actively participate and your MAGI is under $100k (phasing out to $0 by $150k); unused losses carry forward. On sale, claimed depreciation is recaptured at up to 25%, and gains may owe capital-gains tax (a 1031 exchange can defer both). Figures are a year-1 estimate at your 24.0% rate — not tax advice; consult a CPA.
Schools (NCES district)
- District
- Parkway C-2
- NCES district ID
- 2923580
- Math proficiency
- 49% ▼ -11.00%
- Reading proficiency
- 62% ▼ -2.00%
- Median HH income
- $83,551
- Composite
- 50.5/100
- National rank
- #1851
- State rank
- #18 of 324 in MO
Livability — Des Peres
- Score
- 67/100
- State rank
- #202
- US rank
- #10309
Category grades
Schools grade is shown separately in the Schools card above.
Census & demographics
- County
- Saint Louis County · 888,823 people
- City population
- 17,935
- Metro
- St. Louis, MO-IL
- Population (ZIP)
- 55,666
- Household income
- $120,177
- Rent vs Own
- Severe rent burden
- 932.0
Population outlook (St. Louis County) Hauer SSP2
- Today (2025)
- 1,025,227 people
- By 2030
- 1,028,023 · +0.3%
- By 2040
- 1,020,940 · -0.4%
- By 2050
- 1,007,280 · -1.8%
- By 2075
- 987,277 · -3.7%
- By 2100
- 921,984 · -10.1%
Race, ethnicity, and origin ACS 2023
- Neighborhood character
- Predominantly White (76%)
- Race & ethnicity
- White 76% Asian 10% Two or more races 9% Hispanic / Latino 5% Black 3%
- Hispanic origin (detail)
- Mexican 4%
- Common ancestry
- Lithuanian 3% Romanian 2% Italian 2%
- Foreign-born
- 11% · Canada, China, South Korea
- Languages at home
- 85% English-only · Other Indo-European 4% Spanish 3% Other Asian/Pacific 2%
Political lean MEDSL · St. Louis
- 2024 margin
- Strong D (+23.4) · D 60.8% · R 37.4% · Other 1.7%
- 2008→2024 swing
- +3.5pp toward D · 2008: 19.9pp · 2024: 23.4pp
- All cycles
- 2024: D+23.4 2020: D+24.0 2016: D+16.2 2012: D+13.7 2008: D+19.9
Not yet ingested
- Civics
- —
Market trends
- HPI YoY
- ▼ -209.71%
- Current HPI
- 221.4498
- Rent YoY
- ▲ 1.94%
- Metro
- St. Louis, MO-IL
- State GDP YoY
- ▲ 1.84%
- F500 in state
- 20
Industry mix (Fortune 500 HQ in MO)
| Industry | F500 HQs | Revenue |
|---|---|---|
| Healthcare | 1 | $163B |
|
||
| Insurance | 1 | $21B |
|
||
| Industrial Technology | 1 | $17B |
|
||
| Retail | 1 | $16B |
|
||
| Industrial Distribution | 1 | $10B |
|
||
| Utilities | 1 | $9B |
|
||
Price history
+115.6% since first listed3 events — show timeline
- 2026-06-17 Listed $180,000 MARIS as Distributed by MLS Grid
- 1998-11-12 Sold (Public Records) $83,500 Public Records
- 1980-12-01 Sold (Public Records) — Public Records
Property tax history
+2.6%/yrLatest (2022): $1,980 · +0.6% YoY. Source: county tax records.
Cash-flow waterfall
monthlySold comps — $/sqft
last 12 mo · ≤1 miLoading sold comps…