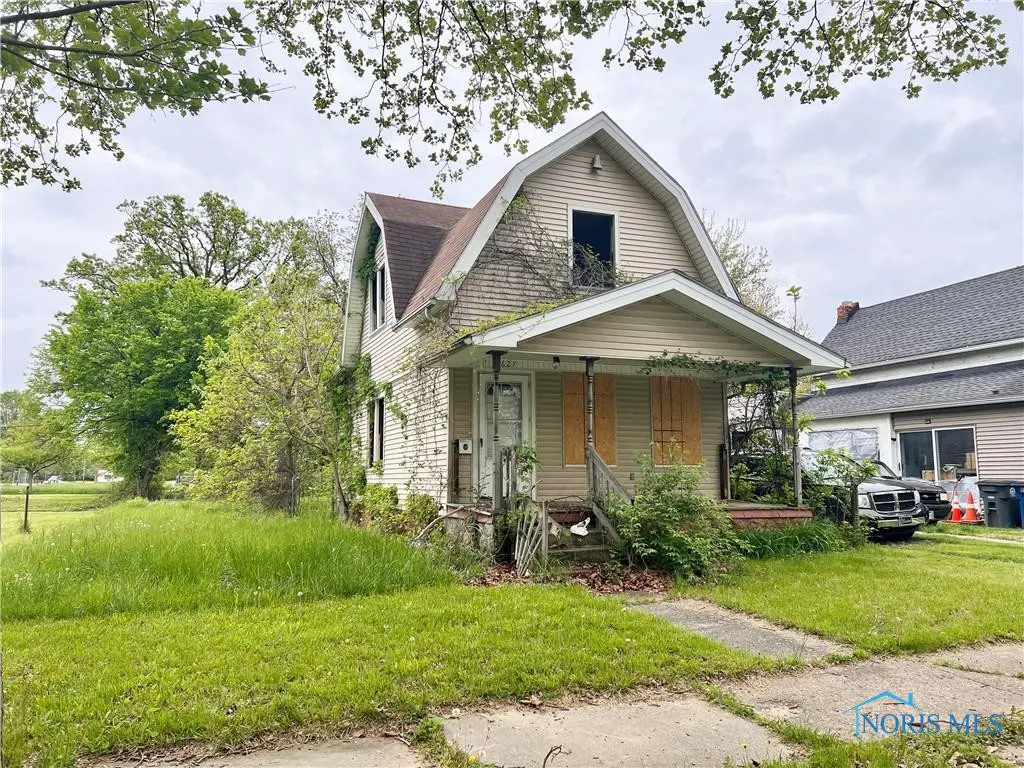
1627 Fernwood Ave · Toledo, OH
Flood risk 1/10 · Minimal
- FEMA flood zone
- X (unshaded)
- Chance of flooding over 30 yrs
- 0.0%
- Est. flood insurance / yr
- $507 – $1,088
Fire risk 1/10 · Minimal
- Est. fire insurance / yr
- $713 – $1,323
Heat risk 3/10 · Minor
- Hot days now (above 101°F)
- 7 days/yr
- Hot days in 30 yrs
- 16 days/yr
Wind risk 2/10 · Minimal
- Chance of severe wind over 30 yrs
- —
Air-quality risk 2/10 · Minimal
- Unhealthy air days now
- 1 days/yr
- Unhealthy air days in 30 yrs
- 3 days/yr
Risk factors via First Street. Map © Google.
Why this score? — see what drove the B- grade
The composite is a weighted blend of 9 inputs, each scored 0–100. Each bar is that input's sub-score; the figure is the points it added to the 100-point composite (weight × sub-score).
- Cash flow +30.0/30.0
- 1% rule +10.0/10.0
- DSCR +10.0/10.0
- ARV discount +7.5/15.0
- Rent growth +4.5/5.0
- Livability +3.3/5.0
- Condition / age +2.5/5.0
- Schools +1.6/10.0
- Appreciation +0.0/10.0
$30,000
🖨 Deal sheet 📄 Offer letter ✓ Due diligence
Listing remarks MLS
GREAT OPPORTUNITY TO OWN A HOME OR BECOME A LANDLORD. GOOD SIZE LIVING AND DINING ROOMS. KITCHEN UPDATED IN 06. 2 PARCELS TOTAL 0.13 ACRE. YARD BEHIND HOUSE IS FENCED. ROOM TO ADD GARAGE ON ADJOINING LOT. LOCATED ABOUT 1.5 MILE FROM THE UNIVERSITY OF TOLEDO.
Key facts
- 2,801 sq ft lot
- Built 1911
- Listed 355 days
Neighborhood map
What this means for you Summary
Snapshot
- This is a 3-bed/1.0-bath single-family listed at $30k.
Deal economics
- At list price, monthly cash flow is $666 ($8k/yr) — positive.
- The deal already cash-flows at list — no discount required.
- Meets the 1% rule at list price ($1k rent vs $30k).
- Recommended offer: $26k (12.0% below list) — sets the bar for market timing.
- Cap rate 32.9% vs local median 7.6% in Toledo — top-decile yield for the area; either an underpriced asset or a hidden risk that comps aren't pricing in. Stress-test before assuming the spread holds.
Location & tenants
- Location reads 66/100 on livability (#645 in OH) — a middle-class / working-renter tenant base. Strengths: cost of living A+, housing A+, health & safety A+; Watch: amenities C-, schools D-, crime F.
- Toledo City (urban): math 15% / reading 24% proficiency, ranked #634 of 656 in OH (top 97%) — low school quality limits family demand, transient renter base, plan for 1-2y turnover; 72% free/reduced lunch — lower-income household profile, screen leases tightly.
- Market conditions: Rents rising fast (+8.2%/yr); 83 active listings in the ZIP; 23 comparable units currently listed for rent nearby; rentals lingering (median 44d on market — plan ~5-8 weeks vacancy on turnover, expect pricing pressure); 74% of comp listings sitting > 30 days — soft ceiling on asking rent; lower-income renter base — watch delinquency; 415 units permitted in Lucas County in 2024 (122 in 5+ unit buildings).
- This rent runs 34% of the median local income ($41k/yr) — at the standard rent-burdened threshold; future hikes will face affordability resistance.
Forward outlook
- Local home prices are declining (-3.0%/yr); year-one equity from $207 of loan paydown is wiped out by about $900 of value loss. Plan a longer hold.
- Lucas County population projected at -16% by 2050 — secular population decline; favor cash flow + early exit over multi-decade hold.
- At projected returns (-3.0% appreciation + 8.0% rent growth), your $8k cash investment doubles in ~2 years — after that, you're playing with house money.
Negotiation context
- It's been on market 355 days — a 12% lower offer ($26k) is reasonable based on typical stale-listing flexibility.
- 8 sale attempts since 25y ago; this cycle's ask has dropped $7k (19%) from the opening price — seller is motivated, your offer sets the floor, not the list.
Risks & watch-outs
- Watch-outs: property tax is 3.8% of price; built in 1911 — expect roof / HVAC / electrical / plumbing capex.
Questions for the listing agent
- It's been on market 355 days. Have you received any prior offers? Is the seller open to a 12% concession, seller financing, or rate buy-down credit?
- Built in 1911 — when were the roof, HVAC, electrical panel, plumbing, and water heater last replaced?
- Property tax is high relative to price — has the assessment been appealed recently, and will the sale trigger a re-assessment?
- Why hasn't it sold? Are there any deal-killer items the seller is aware of (foundation, flood, title, zoning, code violations)?
- Is there a deadline driving the sale (1031 exchange, divorce, estate, relocation)? That informs how much negotiation room exists.
- Schools are D-rated, which usually means shorter tenancies and higher turnover. Who's the typical renter profile here, and what's been the actual vacancy rate?
- Crime grade is F in this area — have there been break-ins, vandalism, or insurance claims at this property in the last 3 years? What carrier currently insures it and at what premium?
- What's the average days-on-market for RENTAL listings here right now (not sales)? A rising rental-DOM trend means longer vacancies and softer asking-rent achievability than the comps imply.
- What's the recent tenant-quality profile in this submarket — average credit score on applications, eviction rate, late-payment / NSF rate, and stable-employment percentage? A property-management company in the area should have these aggregated.
- How much new for-sale + rental construction is in the pipeline within 1–3 miles? Heavy new supply typically softens prices + rents 12–24 months out; constrained supply supports both.
Investment metrics
- 1% rule
- 3.93% ✓
- Cap rate
- 32.92%
- Cash-on-cash
- 95.08%
- DSCR
- 5.23
- GRM
- 2.1
CMA / ARV
- ARV (median comp)
- $65,972
- List price
- $30,000
- Delta
- -54.53%
- Verdict
- UNDERPRICED
- Comps
- 20 within 1.0 mi
Show comp detail 12 sales within ~0.75 mi
| Address | Dist | Beds/Ba | Sqft | Sold | Price | $/sf | Match |
|---|---|---|---|---|---|---|---|
| 1501 Fernwood Ave | 0.10mi | 3/1.0 | 1,259 (-0%) | 1mo | $60,000 | $48 | 94 |
| 1004 Waverly Ave | 0.53mi | 3/1.0 | 1,241 (-2%) | 2mo | $58,500 | $47 | 72 |
| 1019 Woodstock Ave | 0.64mi | 3/1.0 | 1,272 (+1%) | 2mo | $21,100 | $17 | 67 |
| 2033 Crosswell Pl | 0.54mi | 3/1.0 | 1,328 (+5%) | 1mo | $101,500 | $76 | 65 |
| 1119 Indiana Ave | 0.63mi | 3/1.0 | 1,218 (-3%) | 1mo | $50,000 | $41 | 64 |
| 2026 Hawthorne St | 0.44mi | 3/1.0 | 1,142 (-9%) | 0mo | $65,000 | $57 | 63 |
| 1748 Freeman St | 0.73mi | 3/1.5 | 1,263 (+0%) | 2mo | $83,000 | $66 | 62 |
| 1211 Woodstock Ave | 0.61mi | 3/1.0 | 1,188 (-6%) | 2mo | $101,500 | $85 | 60 |
| 1157 W Woodruff Ave | 0.61mi | 4/1.0 (+1) | 1,200 (-5%) | 2mo | $4,000 | $3 | 57 |
| 1675 Nebraska Ave | 0.67mi | 2/1.0 (-1) | 1,419 (+13%) | 1mo | $35,000 | $25 | 42 |
| 1428 Freeman St | 0.73mi | 3/1.0 | 1,084 (-14%) | 2mo | $3,000 | $3 | 42 |
| 1652 Nebraska Ave | 0.63mi | 2/1.0 (-1) | 1,443 (+14%) | 2mo | $40,000 | $28 | 40 |
Match score weights: distance 35% · size 25% · config 20% · recency 20%. Top-matched comps best support the ARV.
Projected returns pro-forma
-3.0% appreciation · 8.0% rent growth · sell at horizon
- IRR
- —
- Equity multiple
- 6.22×
- Total profit
- $43,812
- Equity at exit
- $4,473
- IRR
- —
- Equity multiple
- 15.44×
- Total profit
- $121,307
- Equity at exit
- $2,594
Cash invested: $8,400 (down + closing). Projections, not guarantees.
Landlord ↔ Tenant lean methodology
- Overall (STATE)
- 73 Landlord-Friendly
- State Ohio
- 73 Landlord-Friendly · R+6
- County
- — inherits STATE
- City
- — inherits STATE
ZIP-level market 43607
- Home prices YoY
- -27.5%
- Rents YoY
- 8.2%
- Active inventory
- 83
- Price-to-rent
- 2.1×
Monthly cashflow live
- Estimated rent
- $1,179 high interval (Pro) →
- Mortgage (P&I)
- −$157
- Tax from tax record
- −$96 /mo · $1,150/yr
- Insurance
- −$12
- HOA
- −$0
- Vacancy / Maint / Mgmt
- −$248
- Net cashflow
- $666
Break-even live
UW: 25.0% down · 7.5% · 30yr · 1.5% tax · 5.0% vac · 8.0% maint · 8.0% mgmt
Financing live
Cash to close
- Down payment
- $7,500
- Closing costs
- $900
- Reserves months
- —
- Total cash needed
- —
Loan-product check · same deal, 3 products live
Conventional
25% down · 7.5% · 30yr
- Down + closing
- —
- Monthly P&I
- —
- Monthly cashflow
- —
- DSCR
- —
- Eligible?
- —
Personal DTI + credit; lowest rate.
DSCR
20% down · 8.5% · 30yr
- Down + closing
- —
- Monthly P&I
- —
- Monthly cashflow
- —
- DSCR
- —
- Eligible?
- —
No personal income docs; deal must DSCR.
Hard money
10% down · 12.0% · 12mo
- Down + closing
- —
- Monthly P&I
- —
- Monthly cashflow
- —
- DSCR
- —
- Eligible?
- —
Short-term bridge; refi at stabilization.
Rent comps 23 comps
| Address | Beds | Baths | Sqft | Rent | $/sqft | DOM | Units | Dist |
|---|---|---|---|---|---|---|---|---|
| 1140 Palmwood Ave Toledo, OH | 3.0 | 1.0 | 1292 | $1,500 | $1.16 | 44d | 1 | 0.51mi |
| 1122 Pinewood Ave Toledo, OH | 3.0 | 1.0 | 1559 | $1,150 | $0.74 | 14d | 1 | 0.57mi |
| 2117 Clinton St Toledo, OH | 3.0 | 1.0 | 1256 | $1,115 | $0.89 | 44d | 1 | 0.58mi |
| 915 Woodstock Ave Toledo, OH | 3.0 | 1.5 | 1500 | $1,100 | $0.73 | 23d | 1 | 0.68mi |
| 1785 Tecumseh St Toledo, OH | 2.0 | 1.0 | 930 | $900 | $0.97 | 44d | 1 | 0.72mi |
| 1026 Oakwood Ave Toledo, OH | 2.0 | 1.0 | 1100 | $850 | $0.77 | 44d | 1 | 0.73mi |
| 319 N Detroit Ave Toledo, OH | 3.0 | 1.0 | 1341 | $845 | $0.63 | 44d | 1 | 0.73mi |
| 1133 Parkside Blvd Toledo, OH | 2.0 | 1.0 | 960 | $850 | $0.89 | 44d | 1 | 0.77mi |
| 1738 Milburn Ave Toledo, OH | 2.0 | 1.0 | 1016 | $650 | $0.64 | 23d | 1 | 0.90mi |
| 2322 Upton Ave Toledo, OH | 3.0 | 1.0 | 1000 | $1,300 | $1.30 | 44d | 1 | 0.99mi |
| 1919 Ottawa Dr Unit 7 Toledo, OH | 2.0 | 1.0 | 900 | $800 | $0.89 | 44d | 1 | 1.08mi |
| 2356 Torrey Hill Dr Unit 11 Toledo, OH | 2.0 | 1.0 | 1050 | $800 | $0.76 | 44d | 1 | 1.10mi |
| 2037 Alvin St Toledo, OH | 3.0 | 1.0 | 1260 | $1,175 | $0.93 | 44d | 1 | 1.21mi |
| 2030 Wyndhurst Rd Toledo, OH | 2.0 | 1.0 | 1042 | $950 | $0.91 | 44d | 1 | 1.23mi |
| 1436 Palmetto Ave Toledo, OH | 3.0 | 1.0 | 1678 | $1,400 | $0.83 | 23d | 1 | 1.29mi |
| 2535 W Bancroft St Unit 8 Toledo, OH | 2.0 | 1.0 | 900 | $895 | $0.99 | 44d | 1 | 1.34mi |
| 2637 Greenway St Toledo, OH | 2.0 | 1.0 | 1082 | $900 | $0.83 | 44d | 1 | 1.37mi |
| 960 W Delaware Ave Toledo, OH | 3.0 | 1.0 | 1224 | $1,050 | $0.86 | 23d | 1 | 1.38mi |
| 2447 Maplewood Ave Toledo, OH | 2.0 | 1.0 | 1538 | $897 | $0.58 | 44d | 1 | 1.39mi |
| 625 Virginia St Toledo, OH | 2.0 | 1.0 | 1000 | $800 | $0.80 | 44d | 1 | 1.44mi |
| 625 Virginia St Toledo, OH | 2.0 | 1.0 | 1000 | $850 | $0.85 | 14d | 1 | 1.44mi |
| 1321 Gordon St Toledo, OH | 3.0 | 1.0 | 1121 | $1,050 | $0.94 | 44d | 1 | 1.47mi |
| 3803 Monroe St Toledo, OH | 2.0 | 1.0 | 942 | $850 | $0.90 | 44d | 1 | 1.48mi |
Listing history 40 events
-
2026-06-18days on market $30,000 Active 355 DOM
-
2026-06-17days on market $30,000 Active 354 DOM
-
2026-06-16days on market $30,000 Active 353 DOM
-
2026-06-15days on market $30,000 Active 352 DOM
-
2026-06-14days on market $30,000 Active 350 DOM
-
2026-06-10days on market $30,000 Active 347 DOM
-
2026-06-09days on market $30,000 Active 346 DOM
-
2026-06-08days on market $30,000 Active 345 DOM
-
2026-06-07days on market $30,000 Active 344 DOM
-
2026-06-05days on market $30,000 Active 341 DOM
-
2026-06-03days on market $30,000 Active 340 DOM
-
2026-06-02days on market $30,000 Active 339 DOM
-
2026-06-01days on market $30,000 Active 338 DOM
-
2026-05-31days on market $30,000 Active 337 DOM
-
2026-05-30days on market $30,000 Active 336 DOM
-
2025-10-14price $13,500 259-char remark
Show marketing remark (259 chars)
GREAT OPPORTUNITY TO OWN A HOME OR BECOME A LANDLORD. GOOD SIZE LIVING AND DINING ROOMS. KITCHEN UPDATED IN 06. 2 PARCELS TOTAL 0.13 ACRE. YARD BEHIND HOUSE IS FENCED. ROOM TO ADD GARAGE ON ADJOINING LOT. LOCATED ABOUT 1.5 MILE FROM THE UNIVERSITY OF TOLEDO.
-
2025-10-13price $11,000 125-char remark
Show marketing remark (125 chars)
Bank Owned Property. Great investment property. Great Buy. Proof of funds or pre-approval to be submitted with all offers.
-
2025-06-30price $30,000
-
2025-06-28$36,888 Active
-
2022-01-03status Pending
-
2022-01-03historical
-
2021-12-13status Active
-
2021-11-12status Pending
-
2021-11-01price $31,900
-
2021-10-20$34,900 Active
-
2017-12-20soldstatus $31,000
-
2017-09-18soldstatus $13,500 259-char remark
Show marketing remark (259 chars)
GREAT OPPORTUNITY TO OWN A HOME OR BECOME A LANDLORD. GOOD SIZE LIVING AND DINING ROOMS. KITCHEN UPDATED IN 06. 2 PARCELS TOTAL 0.13 ACRE. YARD BEHIND HOUSE IS FENCED. ROOM TO ADD GARAGE ON ADJOINING LOT. LOCATED ABOUT 1.5 MILE FROM THE UNIVERSITY OF TOLEDO.
-
2017-08-22$14,900 259-char remark
Show marketing remark (259 chars)
GREAT OPPORTUNITY TO OWN A HOME OR BECOME A LANDLORD. GOOD SIZE LIVING AND DINING ROOMS. KITCHEN UPDATED IN 06. 2 PARCELS TOTAL 0.13 ACRE. YARD BEHIND HOUSE IS FENCED. ROOM TO ADD GARAGE ON ADJOINING LOT. LOCATED ABOUT 1.5 MILE FROM THE UNIVERSITY OF TOLEDO.
-
2006-11-06soldstatus $34,900
-
2006-10-31soldstatus $34,900
-
2006-06-20$34,900
-
2006-06-14historical
-
2005-12-22soldstatus $18,000
-
2005-12-21soldstatus $11,000
-
2005-12-14$34,900
-
2005-12-01soldstatus $11,000 125-char remark
Show marketing remark (125 chars)
Bank Owned Property. Great investment property. Great Buy. Proof of funds or pre-approval to be submitted with all offers.
-
2005-03-29soldstatus $40,000
-
2005-02-17$19,900 125-char remark
Show marketing remark (125 chars)
Bank Owned Property. Great investment property. Great Buy. Proof of funds or pre-approval to be submitted with all offers.
-
2002-01-15soldstatus $49,900
-
2001-07-26$55,000
ⓘ Source: listings_history table (triggers on properties + properties_extension) + one-shot
backfill from property_details.listing_events for pre-trigger history.
Tax reassessment forecast OH · Partial reset (capped growth)
- Current annual tax
- $1,150 · $96/mo
- Projected year-2 tax
- $1,150 · $96/mo
- Expected delta
- $0/yr ($0/mo · 0.0%)
ⓘ Screening estimate from a state-policy table — verify with the county assessor before closing.
Climate risk First Street
- Flood 1/10 Low FEMA zone X (unshaded) · 0% chance over 30 yrs
- Wildfire 1/10 Low
- Heat 3/10 Moderate 7 d/yr ≥101°F today · 16 d/yr by 30 yrs out
- Wind 2/10 Low
- Air quality 2/10 Low 1 unhealthy d/yr today · 3 by 30 yrs out
Nearby sold comps map
Loading sold comps map…
Walkable amenities ~0.75 mi
Loading nearby amenities…
Taxation est. · year 1
- Rental income
- $14,145
- − Mortgage interest
- −$1,680
- − Property taxes
- −$1,150
- − Insurance
- −$150
- − Repairs & maintenance
- −$1,132
- − Management
- −$1,132
- − Depreciation
- −$873
- Taxable income
- $8,029
- Est. tax owed @ 24.0%
- −$1,927
- After-tax cash flow
- $6,060/yr
For passive investors: Depreciation is non-cash, so a rental often shows a tax loss while cash-flowing — sheltering income. Rental losses are passive: they offset passive income freely, and up to $25,000/yr can offset ordinary (W-2) income if you actively participate and your MAGI is under $100k (phasing out to $0 by $150k); unused losses carry forward. On sale, claimed depreciation is recaptured at up to 25%, and gains may owe capital-gains tax (a 1031 exchange can defer both). Figures are a year-1 estimate at your 24.0% rate — not tax advice; consult a CPA.
Schools (NCES district)
- District
- Toledo City
- NCES district ID
- 3904490
- Math proficiency
- 15% ▼ -16.00%
- Reading proficiency
- 24% ▼ -13.00%
- Median HH income
- $32,137
- Composite
- 15.76/100
- National rank
- #9276
- State rank
- #634 of 656 in OH
Livability — Toledo
- Score
- 66/100
- State rank
- #645
- US rank
- #11442
Category grades
Schools grade is shown separately in the Schools card above.
Census & demographics
- Census place
- Toledo, OH
- County
- Lucas County · 380,724 people
- City population
- 280,811
- Metro
- Toledo, OH
- Population (ZIP)
- 19,469
- Household income
- $41,335
- Rent vs Own
- Severe rent burden
- 1157.0
Population outlook (Lucas County) Hauer SSP2
- Today (2025)
- 420,751 people
- By 2030
- 410,187 · -2.5%
- By 2040
- 384,019 · -8.7%
- By 2050
- 355,125 · -15.6%
- By 2075
- 291,683 · -30.7%
- By 2100
- 233,670 · -44.5%
Race, ethnicity, and origin ACS 2023
- Neighborhood character
- Diverse neighborhood (Simpson 0.57)
- Race & ethnicity
- Black 59% White 27% Two or more races 6% Hispanic / Latino 6% Asian 3%
- Hispanic origin (detail)
- Mexican 3% Puerto Rican 2%
- Common ancestry
- Lithuanian 2% Romanian 2% Slovak 1%
- Foreign-born
- 4% · Canada
- Languages at home
- 94% English-only · Other Indo-European 1% Spanish 1% Russian/Polish/Slavic 1%
Political lean MEDSL · Lucas
- 2024 margin
- D (+12.6) · D 55.8% · R 43.2%
- 2008→2024 swing
- -18.9pp toward R · 2008: 31.4pp · 2024: 12.6pp
- All cycles
- 2024: D+12.6 2020: D+16.8 2016: D+17.4 2012: D+30.4 2008: D+31.4
Not yet ingested
- Civics
- —
Market trends
- HPI YoY
- ▼ -66.58%
- Current HPI
- 175.2772
- Rent YoY
- ▲ 8.19%
- Metro
- Toledo, OH
- State GDP YoY
- ▲ 1.98%
- F500 in state
- 48
Industry mix (Fortune 500 HQ in OH)
| Industry | F500 HQs | Revenue |
|---|---|---|
| Insurance | 3 | $145B |
|
||
| Industrial Machinery | 3 | $49B |
|
||
| Financial Services | 3 | $24B |
|
||
| Consumer Goods | 2 | $93B |
|
||
| Aerospace / Defense | 2 | $47B |
|
||
| Utilities | 2 | $33B |
|
||
Price history
-75.5% since first listed25 events — show timeline
- 2025-10-14 Price Changed $13,500 NORIS
- 2025-10-13 Price Changed $11,000 NORIS
- 2025-06-30 Price Changed $30,000 NORIS
- 2025-06-28 Listed $36,888 NORIS
- 2022-01-03 Pending — NORIS
- 2022-01-03 Listing Removed — NORIS
- 2021-12-13 Relisted — NORIS
- 2021-11-12 Pending — NORIS
- 2021-11-01 Price Changed $31,900 NORIS
- 2021-10-20 Listed $34,900 NORIS
- 2017-12-20 Sold (Public Records) $31,000 Public Records
- 2017-09-18 Sold (MLS) $13,500 NORIS
- 2017-08-22 Listed $14,900 NORIS
- 2006-11-06 Sold (Public Records) $34,900 Public Records
- 2006-10-31 Sold (MLS) $34,900 NORIS
- 2006-06-20 Listed $34,900 NORIS
- 2006-06-14 Listing Removed — NORIS
- 2005-12-22 Sold (Public Records) $18,000 Public Records
- 2005-12-21 Sold (Public Records) $11,000 Public Records
- 2005-12-14 Listed $34,900 NORIS
- 2005-12-01 Sold (MLS) $11,000 NORIS
- 2005-03-29 Sold (Public Records) $40,000 Public Records
- 2005-02-17 Listed $19,900 NORIS
- 2002-01-15 Sold (Public Records) $49,900 Public Records
- 2001-07-26 Listed $55,000 NORIS
Property tax history
+7.3%/yrLatest (2025): $1,150 · +29.8% YoY. Source: county tax records.
Cash-flow waterfall
monthlySold comps — $/sqft
last 12 mo · ≤1 miLoading sold comps…