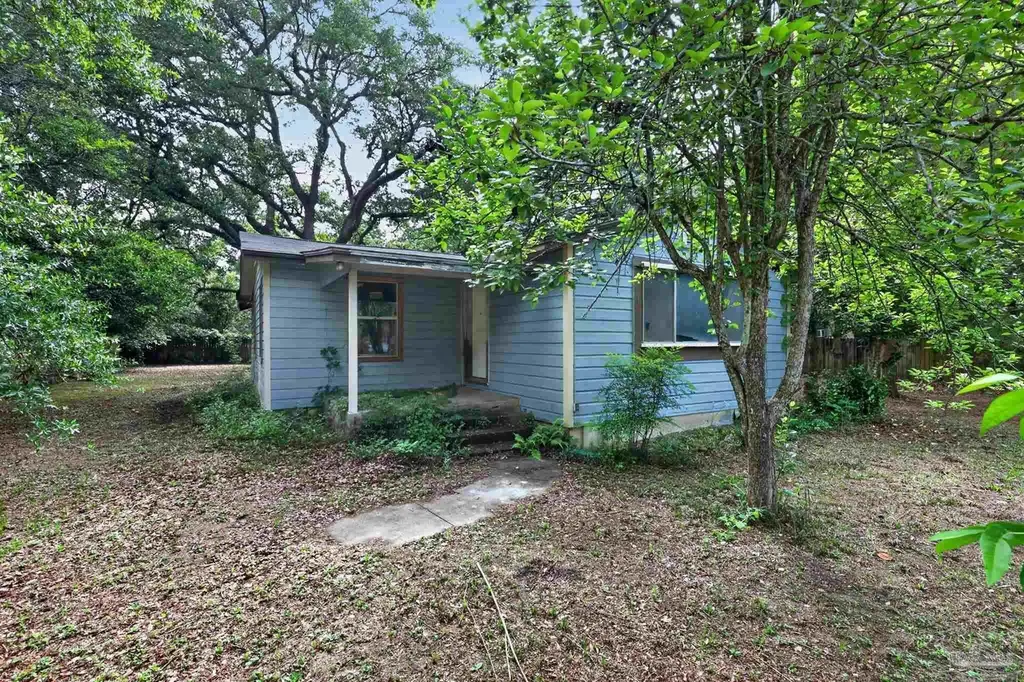
8608 Grimsley St · Ensley, FL
Flood risk 1/10 · Minimal
- FEMA flood zone
- X (unshaded)
- Chance of flooding over 30 yrs
- 0.0%
- Est. flood insurance / yr
- $507 – $1,088
Fire risk 1/10 · Minimal
- Est. fire insurance / yr
- $947 – $1,759
Heat risk 10/10 · Severe
- Hot days now (above 106°F)
- 7 days/yr
- Hot days in 30 yrs
- 22 days/yr
Wind risk 9/10 · Severe
- Chance of severe wind over 30 yrs
- 99.0%
Air-quality risk 1/10 · Minimal
- Unhealthy air days now
- 0 days/yr
- Unhealthy air days in 30 yrs
- 0 days/yr
Risk factors via First Street. Map © Google.
Why this score? — see what drove the B grade
The composite is a weighted blend of 9 inputs, each scored 0–100. Each bar is that input's sub-score; the figure is the points it added to the 100-point composite (weight × sub-score).
- Cash flow +30.0/30.0
- 1% rule +10.0/10.0
- DSCR +10.0/10.0
- ARV discount +7.5/15.0
- Livability +4.0/5.0
- Schools +3.6/10.0
- Rent growth +3.4/5.0
- Condition / age +2.5/5.0
- Appreciation +0.0/10.0
$49,000
🖨 Deal sheet 📄 Offer letter ✓ Due diligence
Listing remarks MLS
Property had a fire December 2019. Fire was in back corner of house and didn't seem to get into attic area. Owner has cleaned inside of property. New roof was installed April 2019 and New deck which didn't seem to get damaged from fire. Property has grapefruit and orange trees along with large oaks. Large shed stays with the property.
Key facts
- 0.31 acre lot
- Built 1957
- Listed 25 days
Property features AI
Finance
- Other: Building area approximately 1,116 square feet; Lot size approximately 0.31 acres; Property condition: Under construction; Directions provided by listing agent
- HOA & community: No homeowners association
Exterior
- Parking: Front entrance parking
- Utilities: Public water; Public sewer; Electric: Aluminum wiring; Road maintained by county
- Home design: Single-story home; Under construction (new construction); Not attached to another property; Frame construction
- Construction: Composition roof; Off-grade foundation; Built with frame construction
- Exterior features: Central access to the lot
Interior
- Kitchen: Eat-in kitchen; No water heater listed
- Bedrooms: Master bedroom on the first floor
- Flooring: Flooring details listed as 'See Remarks'
- Bathrooms: 1 full bathroom
- Interior features: Storage
- Laundry & utility: See remarks for flooring details
Neighborhood map
What this means for you Summary
Snapshot
- This is a 3-bed/1.0-bath single-family listed at $49k.
Deal economics
- At list price, monthly cash flow is $846 ($10k/yr) — positive.
- The deal already cash-flows at list — no discount required.
- Meets the 1% rule at list price ($1k rent vs $49k).
- Recommended offer: $48k (1.5% below list) — sets the bar for market timing.
- Cap rate 27.0% vs local median 4.7% in Ensley — top-decile yield for the area; either an underpriced asset or a hidden risk that comps aren't pricing in. Stress-test before assuming the spread holds.
Location & tenants
- Location reads 79/100 on livability (#133 in FL, #1,996 nationally) — a middle-class / working-renter tenant base. Strengths: cost of living A+, housing A+, health & safety A+; Watch: amenities D, employment D, schools F.
- Escambia (suburban): math 40% / reading 45% proficiency, ranked #56 of 73 in FL (top 77%) — families likely to look elsewhere, expect single-tenant / working-renter base with shorter leases.
- Market conditions: Rents rising (+3.6%/yr); 113 active listings in the ZIP; 12 comparable units currently listed for rent nearby; rentals at typical pace (median 21d on market — plan ~3-4 weeks tenant-placement turnaround); 1,479 units permitted in Escambia County in 2024 (0 in 5+ unit buildings).
- This rent runs 30% of the median local income ($59k/yr) — at the standard rent-burdened threshold; future hikes will face affordability resistance.
Forward outlook
- Local home prices are declining (-3.0%/yr); year-one equity from $339 of loan paydown is wiped out by about $1k of value loss. Plan a longer hold.
- Escambia County population projected at +13% by 2050 — modest demand growth; plan on rents tracking national, not racing it.
- At projected returns (-3.0% appreciation + 3.6% rent growth), your $14k cash investment doubles in ~2 years — after that, you're playing with house money.
Negotiation context
- It's been on market 26 days — a 2% lower offer ($48k) is reasonable based on typical stale-listing flexibility.
- 5 sale attempts since 27y ago; this cycle's ask has dropped $6k (11%) from the opening price — seller is motivated, your offer sets the floor, not the list.
- Current owner paid $18k; list at $49k implies a 165% gain — meaningful room to come down on a strong offer.
Risks & watch-outs
- Watch-outs: built in 1957 — expect roof / HVAC / electrical / plumbing capex.
- Climate carrying-cost: severe wind risk, 99% chance of damaging wind over 30y; extreme-heat days projected 7→22/yr by 2055 (HVAC capex compounding) — expect insurance premiums to compound above CPI over the hold.
Questions for the listing agent
- Built in 1957 — when were the roof, HVAC, electrical panel, plumbing, and water heater last replaced?
- Is there a deadline driving the sale (1031 exchange, divorce, estate, relocation)? That informs how much negotiation room exists.
- Schools are F-rated, which usually means shorter tenancies and higher turnover. Who's the typical renter profile here, and what's been the actual vacancy rate?
- What's the average days-on-market for RENTAL listings here right now (not sales)? A rising rental-DOM trend means longer vacancies and softer asking-rent achievability than the comps imply.
- What's the recent tenant-quality profile in this submarket — average credit score on applications, eviction rate, late-payment / NSF rate, and stable-employment percentage? A property-management company in the area should have these aggregated.
- How much new for-sale + rental construction is in the pipeline within 1–3 miles? Heavy new supply typically softens prices + rents 12–24 months out; constrained supply supports both.
Investment metrics
- 1% rule
- 3.02% ✓
- Cap rate
- 27.00%
- Cash-on-cash
- 73.96%
- DSCR
- 4.29
- GRM
- 2.8
CMA / ARV
- ARV (median comp)
- $239,658
- List price
- $49,000
- Delta
- -79.55%
- Verdict
- UNDERPRICED
- Comps
- 20 within 1.0 mi
Show comp detail 12 sales within ~0.75 mi
| Address | Dist | Beds/Ba | Sqft | Sold | Price | $/sf | Match |
|---|---|---|---|---|---|---|---|
| 236 Barker St | 0.38mi | 3/1.0 | 1,042 (-7%) | 1mo | $150,000 | $144 | 70 |
| 8570 Argo Dr | 0.27mi | 3/2.0 | 1,251 (+12%) | 2mo | $245,900 | $197 | 62 |
| 8422 Cherry Ave | 0.61mi | 3/2.0 | 1,145 (+3%) | 3mo | $219,000 | $191 | 61 |
| 8501 N Ryan Ave | 0.66mi | 3/1.0 | 1,056 (-5%) | 4mo | $179,000 | $170 | 57 |
| 8418 Cherry Ave | 0.60mi | 3/2.0 | 1,165 (+4%) | 5mo | $219,000 | $188 | 56 |
| 514 W Ensley St | 0.64mi | 3/2.0 | 1,179 (+6%) | 1mo | $230,000 | $195 | 56 |
| 8515 Rose Ave | 0.75mi | 3/2.0 | 1,145 (+3%) | 2mo | $221,000 | $193 | 55 |
| 151 Calvert Oaks Dr | 0.40mi | 3/2.0 | 1,248 (+12%) | 4mo | $248,500 | $199 | 54 |
| 8509 Walnut Ave | 0.70mi | 3/2.0 | 1,145 (+3%) | 7mo | $225,000 | $197 | 53 |
| 9350 Everson Ave | 0.75mi | 3/1.5 | 1,215 (+9%) | 0mo | $199,999 | $165 | 48 |
| 8620 Match St | 0.71mi | 4/2.5 (+1) | 1,224 (+10%) | 4mo | $101,000 | $83 | 37 |
| 8506 Rose Ave | 0.72mi | 3/2.0 | 1,250 (+12%) | 7mo | $197,500 | $158 | 36 |
Match score weights: distance 35% · size 25% · config 20% · recency 20%. Top-matched comps best support the ARV.
Projected returns pro-forma
-3.0% appreciation · 3.63% rent growth · sell at horizon
- IRR
- 74.5%
- Equity multiple
- 4.42×
- Total profit
- $46,872
- Equity at exit
- $7,306
- IRR
- 78.4%
- Equity multiple
- 9.32×
- Total profit
- $114,136
- Equity at exit
- $4,237
Cash invested: $13,720 (down + closing). Projections, not guarantees.
Landlord ↔ Tenant lean methodology
- Overall (STATE)
- 87 Strongly Landlord-Friendly
- State Florida
- 87 Strongly Landlord-Friendly · R+3
- County
- — inherits STATE
- City
- — inherits STATE
ZIP-level market 32534
- Home prices YoY
- -19.1%
- Rents YoY
- 3.6%
- Active inventory
- 113
- Price-to-rent
- 2.8×
Monthly cashflow live
- Estimated rent
- $1,479 high interval (Pro) →
- Mortgage (P&I)
- −$257
- Tax from tax record
- −$45 /mo · $546/yr
- Insurance
- −$20
- HOA
- −$0
- Vacancy / Maint / Mgmt
- −$311
- Net cashflow
- $846
Break-even live
UW: 25.0% down · 7.5% · 30yr · 1.5% tax · 5.0% vac · 8.0% maint · 8.0% mgmt
Financing live
Cash to close
- Down payment
- $12,250
- Closing costs
- $1,470
- Reserves months
- —
- Total cash needed
- —
Loan-product check · same deal, 3 products live
Conventional
25% down · 7.5% · 30yr
- Down + closing
- —
- Monthly P&I
- —
- Monthly cashflow
- —
- DSCR
- —
- Eligible?
- —
Personal DTI + credit; lowest rate.
DSCR
20% down · 8.5% · 30yr
- Down + closing
- —
- Monthly P&I
- —
- Monthly cashflow
- —
- DSCR
- —
- Eligible?
- —
No personal income docs; deal must DSCR.
Hard money
10% down · 12.0% · 12mo
- Down + closing
- —
- Monthly P&I
- —
- Monthly cashflow
- —
- DSCR
- —
- Eligible?
- —
Short-term bridge; refi at stabilization.
Rent comps 12 comps
| Address | Beds | Baths | Sqft | Rent | $/sqft | DOM | Units | Dist |
|---|---|---|---|---|---|---|---|---|
| 50 E Ensley St Unit A Pensacola, FL | 3.0 | 2.0 | 840 | $1,150 | $1.37 | 14d | 1 | 0.07mi |
| 8660 Figland Ave Pensacola, FL | 3.0 | 2.0 | 1106 | $1,550 | $1.40 | 14d | 1 | 0.75mi |
| 9095 Airway Dr Pensacola, FL | 1.0–3.0 | 1.0–2.0 | 1542 | $1,809 | $1.17 | 14d | 19 | 0.75mi |
| 130 E 9 Mile Rd #5 Pensacola, FL | 2.0 | 1.0 | 925 | $1,095 | $1.18 | 23d | 1 | 0.84mi |
| 8651 Airway Dr Pensacola, FL | 2.0 | 2.0 | 1170 | $1,682 | $1.44 | 21d | 15 | 0.86mi |
| 288 E Olive Rd Pensacola, FL | 1.0–2.0 | 1.0 | 750 | $1,045 | $1.39 | 23d | 2 | 1.08mi |
| 7812 Oak Forest Dr Pensacola, FL | 3.0 | 1.5 | 1166 | $1,750 | $1.50 | 23d | 1 | 1.22mi |
| 8733 Chisholm Rd Pensacola, FL | 3.0 | 1.0 | 1030 | $1,300 | $1.26 | 23d | 1 | 1.35mi |
| 1015 Sable Dr Unit B Pensacola, FL | 2.0 | 2.0 | 962 | $1,300 | $1.35 | 14d | 1 | 1.43mi |
| 8440 Chisholm Rd Unit B Pensacola, FL | 3.0 | 2.0 | 1112 | $1,525 | $1.37 | 23d | 1 | 1.44mi |
| 1040 Sable Dr Unit c Pensacola, FL | 2.0 | 1.5 | 1005 | $1,200 | $1.19 | 14d | 1 | 1.49mi |
| 1540 Wilimar Pl Pensacola, FL | 3.0 | 2.0 | 1008 | $1,550 | $1.54 | 14d | 1 | 1.49mi |
Listing history 17 events
-
2026-06-03days on market $49,000 Active 26 DOM
-
2026-06-02days on market $49,000 Active 25 DOM
-
2026-06-01days on market $49,000 Active 24 DOM
-
2026-05-31days on market $49,000 Active 23 DOM
-
2026-05-31days on market $49,000 Active 22 DOM
-
2026-05-14price $49,000 538-char remark
-
2026-05-08$55,000 Active 538-char remark
-
2022-07-17status Pending
-
2022-07-16historical
-
2022-07-14$60,000 Active
-
2020-02-06soldstatus $18,500
Show marketing remark (342 chars)
Property had a fire December 2019. Fire was in back corner of house and didn't seem to get into attic area. Owner has cleaned inside of property. New roof was installed April 2019 and New deck which didn't seem to get damaged from fire. Property has grapefruit and orange trees along with large oaks. Large shed stays with the property.
-
2020-01-22$17,500
Show marketing remark (342 chars)
Property had a fire December 2019. Fire was in back corner of house and didn't seem to get into attic area. Owner has cleaned inside of property. New roof was installed April 2019 and New deck which didn't seem to get damaged from fire. Property has grapefruit and orange trees along with large oaks. Large shed stays with the property.
-
2019-03-19soldstatus $22,000
-
2019-02-07$14,840
-
2000-07-07soldstatus $43,500
-
2000-06-30soldstatus $43,500
-
1999-12-08$46,921
ⓘ Source: listings_history table (triggers on properties + properties_extension) + one-shot
backfill from property_details.listing_events for pre-trigger history.
Tax reassessment forecast FL · Resets to sale price
- Current annual tax
- $546 · $45/mo
- Projected year-2 tax
- $546 · $45/mo
- Expected delta
- $0/yr ($0/mo · 0.0%)
ⓘ Screening estimate from a state-policy table — verify with the county assessor before closing.
Climate risk First Street
- Flood 1/10 Low FEMA zone X (unshaded) · 0% chance over 30 yrs
- Wildfire 1/10 Low
- Heat 10/10 Extreme 7 d/yr ≥106°F today · 22 d/yr by 30 yrs out
- Wind 9/10 Extreme 99% chance of damaging wind over 30 yrs
- Air quality 1/10 Low 0 unhealthy d/yr today · 0 by 30 yrs out
Nearby sold comps map
Loading sold comps map…
Walkable amenities ~0.75 mi
Loading nearby amenities…
Taxation est. · year 1
- Rental income
- $17,748
- − Mortgage interest
- −$2,745
- − Property taxes
- −$546
- − Insurance
- −$245
- − Repairs & maintenance
- −$1,420
- − Management
- −$1,420
- − Depreciation
- −$1,425
- Taxable income
- $9,948
- Est. tax owed @ 24.0%
- −$2,387
- After-tax cash flow
- $7,760/yr
For passive investors: Depreciation is non-cash, so a rental often shows a tax loss while cash-flowing — sheltering income. Rental losses are passive: they offset passive income freely, and up to $25,000/yr can offset ordinary (W-2) income if you actively participate and your MAGI is under $100k (phasing out to $0 by $150k); unused losses carry forward. On sale, claimed depreciation is recaptured at up to 25%, and gains may owe capital-gains tax (a 1031 exchange can defer both). Figures are a year-1 estimate at your 24.0% rate — not tax advice; consult a CPA.
Schools (NCES district)
- District
- Escambia
- NCES district ID
- 1200510
- Math proficiency
- 40% ▼ -9.00%
- Reading proficiency
- 45% ▼ -4.00%
- Median HH income
- $44,649
- Composite
- 36.04/100
- National rank
- #4773
- State rank
- #56 of 73 in FL
Livability — Ensley
- Score
- 79/100
- State rank
- #133
- US rank
- #1996
Category grades
Schools grade is shown separately in the Schools card above.
Census & demographics
- Census place
- Ensley, FL
- County
- Escambia County · 301,722 people
- City population
- 15,879
- Metro
- Pensacola-Ferry Pass-Brent, FL
- Population (ZIP)
- 17,104
- Household income
- $58,992
- Rent vs Own
- Severe rent burden
- 540.0
Population outlook (Escambia County) Hauer SSP2
- Today (2025)
- 334,637 people
- By 2030
- 345,779 · +3.3%
- By 2040
- 364,828 · +9.0%
- By 2050
- 378,514 · +13.1%
- By 2075
- 403,220 · +20.5%
- By 2100
- 386,125 · +15.4%
Race, ethnicity, and origin ACS 2023
- Neighborhood character
- Diverse neighborhood (Simpson 0.65)
- Race & ethnicity
- White 51% Black 30% Two or more races 9% Hispanic / Latino 8% Asian 5%
- Hispanic origin (detail)
- Mexican 2%
- Common ancestry
- Serbian 3% Italian 2% Portuguese 1%
- Foreign-born
- 8% · Canada, Vietnam, Jamaica
- Languages at home
- 89% English-only · Spanish 6% Vietnamese 2% Tagalog/Filipino 1%
Political lean MEDSL · Escambia
- 2024 margin
- R (+19.5) · D 39.7% · R 59.2% · Other 1.1%
- 2008→2024 swing
- -0.2pp no change · 2008: -19.3pp · 2024: -19.5pp
- All cycles
- 2024: R+19.5 2020: R+15.1 2016: R+20.6 2012: R+20.6 2008: R+19.3
Not yet ingested
- Civics
- —
Market trends
- HPI YoY
- ▼ -60.23%
- Current HPI
- 255.7617
- Rent YoY
- ▲ 3.63%
- Metro
- Pensacola-Ferry Pass-Brent, FL
- State GDP YoY
- ▲ 3.28%
- F500 in state
- 36
Industry mix (Fortune 500 HQ in FL)
| Industry | F500 HQs | Revenue |
|---|---|---|
| Industrial Technology | 2 | $29B |
|
||
| Insurance | 2 | $17B |
|
||
| Retail | 1 | $60B |
|
||
| Technology Distribution | 1 | $58B |
|
||
| Homebuilding | 1 | $35B |
|
||
| Technology Manufacturing | 1 | $35B |
|
||
Price history
+4.4% since first listed13 events — show timeline
- 2026-06-05 Listing Removed — PARMLS
- 2026-05-14 Price Changed $49,000 PARMLS
- 2026-05-08 Listed $55,000 PARMLS
- 2022-07-17 Pending — PARMLS
- 2022-07-16 Listing Removed — PARMLS
- 2022-07-14 Listed $60,000 PARMLS
- 2020-02-06 Sold (MLS) $18,500 PARMLS
- 2020-01-22 Listed $17,500 PARMLS
- 2019-03-19 Sold (MLS) $22,000 PARMLS
- 2019-02-07 Listed $14,840 PARMLS
- 2000-07-07 Sold (Public Records) $43,500 Public Records
- 2000-06-30 Sold (MLS) $43,500 PARMLS
- 1999-12-08 Listed $46,921 PARMLS
Property tax history
+5.0%/yrLatest (2025): $546 · +31.3% YoY. Source: county tax records.
Cash-flow waterfall
monthlySold comps — $/sqft
last 12 mo · ≤1 miLoading sold comps…