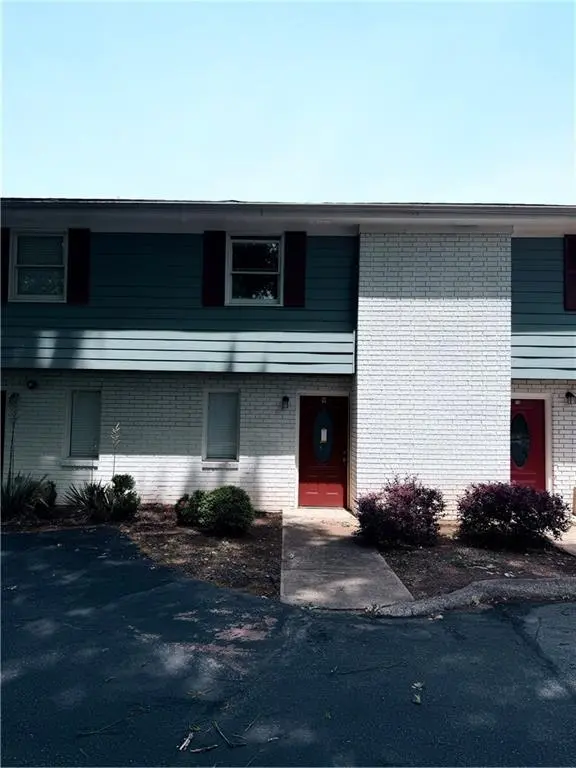
1838 Dunlap Ave Unit I · East Point, GA
Flood risk 1/10 · Minimal
- FEMA flood zone
- X (unshaded)
- Chance of flooding over 30 yrs
- 0.0%
- Est. flood insurance / yr
- $473 – $860
Fire risk 1/10 · Minimal
- Est. fire insurance / yr
- $963 – $1,789
Heat risk 5/10 · Moderate
- Hot days now (above 103°F)
- 6 days/yr
- Hot days in 30 yrs
- 15 days/yr
Wind risk 6/10 · Moderate
- Chance of severe wind over 30 yrs
- 27.0%
Air-quality risk 3/10 · Minor
- Unhealthy air days now
- 3 days/yr
- Unhealthy air days in 30 yrs
- 3 days/yr
Risk factors via First Street. Map © Google.
Why this score? — see what drove the B grade
The composite is a weighted blend of 9 inputs, each scored 0–100. Each bar is that input's sub-score; the figure is the points it added to the 100-point composite (weight × sub-score).
- Cash flow +26.6/30.0
- ARV discount +15.0/15.0
- 1% rule +10.0/10.0
- DSCR +9.1/10.0
- Schools +4.5/10.0
- Livability +3.6/5.0
- Rent growth +2.8/5.0
- Condition / age +2.5/5.0
- Appreciation +0.0/10.0
$87,900
🖨 Deal sheet 📄 Offer letter ✓ Due diligence
Listing remarks MLS
Investors wanted for this gutted to the studs townhouse in East Point. Property is ready for a complete rehab. Make your offer today! Perfect for fix & flip investors looking to increase the value. It would be a nice addition to a buy-&-hold portfolio. Sold As-Is. NO BLIND OFFERS. Must use seller's closing attorney
Key facts
- $333 HOA
- Built 1960
- Listed 48 days
Property features AI
Finance
- HOA & community: Association fee of $1,000 paid quarterly; Part of a 10-unit community
Exterior
- Parking: Located in the second building off Turner St., Unit 9; Road frontage on a city street; Asphalt road surface
- Utilities: Public water; Public sewer; 110-volt electric service; Cable available; Electricity available; Sewer available; Water available
- Home design: Two-story property; Brick-front construction; Slab foundation; Fee simple ownership
- Construction: Composition roof
- Exterior features: Patio; Property listed in fixer condition
Interior
- Kitchen: Kitchen appliances listed as other
- Bedrooms: Two bedrooms located on the upper level; Bedrooms with no special features listed
- Bathrooms: One full bathroom on the upper level; One half bathroom on the main level
- Heating & cooling: Heating listed as other; Cooling listed as other
- Interior features: Two or more shared/common walls; Other interior features
- Laundry & utility: Laundry features listed as other
Neighborhood map
What this means for you Summary
Snapshot
- This is a 2-bed/1.5-bath single-family listed at $88k.
Deal economics
- At list price, monthly cash flow is $235 ($3k/yr) — positive.
- The deal already cash-flows at list — no discount required.
- Meets the 1% rule at list price ($1k rent vs $88k).
- Recommended offer: $85k (3.0% below list) — sets the bar for market timing.
- Cap rate 9.5% vs local median 5.1% in East Point — top-decile yield for the area; either an underpriced asset or a hidden risk that comps aren't pricing in. Stress-test before assuming the spread holds.
Location & tenants
- Location reads 72/100 on livability (#72 in GA) — a middle-class / working-renter tenant base. Strengths: commute A+, cost of living A+, housing A+; Watch: employment D+, crime F, amenities F.
- Fulton County (suburban): math 49% / reading 53% proficiency, ranked #12 of 174 in GA (top 7%) — acceptable for families but not a draw, mixed tenant base, ~2y average lease.
- Zoned schools: Paul D. West Middle School (math 17% / reading 17%, grade F, #381 of 470 statewide, top 82%, 803 students, 100% FRL); Tri-Cities High School (math 5% / reading 30%, grade F, #264 of 424 statewide, top 63%, 1,483 students, 100% FRL) — zoned schools average 100% FRL vs 41% district-wide (59 pts higher); higher-poverty schools than district average — tighter screening recommended.
- Zoned-school proficiency averages 17% at this address vs 51% district-wide (-34 pts) — the specific schools serving this property underperform the Fulton County average; the district grade overstates school quality for this exact location.
- Market conditions: Rents rising (+1.4%/yr); 283 active listings in the ZIP; 40 comparable units currently listed for rent nearby; rentals lingering (median 44d on market — plan ~5-8 weeks vacancy on turnover, expect pricing pressure); 52% of comp listings sitting > 30 days — soft ceiling on asking rent; 11,565 units permitted in Fulton County in 2024 (8,159 in 5+ unit buildings).
Forward outlook
- Local home prices are declining (-3.0%/yr); year-one equity from $608 of loan paydown is wiped out by about $3k of value loss. Plan a longer hold.
- Fulton County population projected at +38% by 2050 — long-run rental-demand tailwind backs the buy-and-hold thesis.
Negotiation context
- It's been on market 49 days — a 3% lower offer ($85k) is reasonable based on typical stale-listing flexibility.
- 3 sale attempts since 18y ago; this cycle's ask has dropped $7k (7%) from the opening price — seller is motivated, your offer sets the floor, not the list.
- Current owner paid $8k; list at $88k implies a 1072% gain — meaningful room to come down on a strong offer.
Risks & watch-outs
- Watch-outs: HOA is 23% of rent.
- Climate carrying-cost: major wind risk, 27% chance of damaging wind over 30y; extreme-heat days projected 6→15/yr by 2055 (HVAC capex compounding) — expect insurance premiums to compound above CPI over the hold.
Questions for the listing agent
- It's been on market 49 days. Have you received any prior offers? Is the seller open to a 3% concession, seller financing, or rate buy-down credit?
- Built in 1960 — when were the roof, HVAC, electrical panel, plumbing, and water heater last replaced?
- What does the HOA fee cover, when was the last increase, and are there any pending special assessments or reserve-fund shortfalls?
- Is there a deadline driving the sale (1031 exchange, divorce, estate, relocation)? That informs how much negotiation room exists.
- Schools are F-rated, which usually means shorter tenancies and higher turnover. Who's the typical renter profile here, and what's been the actual vacancy rate?
- Crime grade is F in this area — have there been break-ins, vandalism, or insurance claims at this property in the last 3 years? What carrier currently insures it and at what premium?
- What's the average days-on-market for RENTAL listings here right now (not sales)? A rising rental-DOM trend means longer vacancies and softer asking-rent achievability than the comps imply.
- What's the recent tenant-quality profile in this submarket — average credit score on applications, eviction rate, late-payment / NSF rate, and stable-employment percentage? A property-management company in the area should have these aggregated.
- How much new for-sale + rental construction is in the pipeline within 1–3 miles? Heavy new supply typically softens prices + rents 12–24 months out; constrained supply supports both.
Investment metrics
- 1% rule
- 1.62% ✓
- Cap rate
- 9.50%
- Cash-on-cash
- 11.47%
- DSCR
- 1.51
- GRM
- 5.1
CMA / ARV
- ARV (median comp)
- $165,465
- List price
- $87,900
- Delta
- -46.88%
- Verdict
- UNDERPRICED
- Comps
- 2 within 1.0 mi
Show comp detail 12 sales within ~0.75 mi
| Address | Dist | Beds/Ba | Sqft | Sold | Price | $/sf | Match |
|---|---|---|---|---|---|---|---|
| 3020 Washington Rd | 0.10mi | 2/1.0 | 1,101 (+3%) | 8mo | $155,000 | $141 | 82 |
| 2116 Ben Hill Rd | 0.22mi | 3/2.0 (+1) | 1,092 (+2%) | 18mo | $142,000 | $130 | 65 |
| 3176 Pollard St | 0.27mi | 3/2.0 (+1) | 1,129 (+6%) | 11mo | $275,000 | $244 | 62 |
| 3242 College St | 0.41mi | 3/2.0 (+1) | 1,104 (+3%) | 10mo | $224,500 | $203 | 60 |
| 3197 Cloverhurst Dr | 0.26mi | 3/1.5 (+1) | 1,167 (+9%) | 13mo | $200,000 | $171 | 57 |
| 1933 Mercer Ave | 0.47mi | 2/1.0 | 1,218 (+14%) | 1mo | $235,000 | $193 | 52 |
| 2016 Montrose Dr | 0.70mi | 2/1.0 | 1,059 (-1%) | 16mo | $225,000 | $212 | 50 |
| 2321 Ben Hill Rd | 0.68mi | 3/2.0 (+1) | 1,079 (+1%) | 14mo | $160,000 | $148 | 48 |
| 3122 Semmes St | 0.45mi | 3/1.0 (+1) | 1,002 (-6%) | 17mo | $155,000 | $155 | 47 |
| 3083 Mckenzie Rd | 0.69mi | 3/1.0 (+1) | 1,023 (-4%) | 9mo | $162,000 | $158 | 46 |
| 2791 Pearl St | 0.59mi | 2/1.0 | 1,196 (+12%) | 10mo | $264,000 | $221 | 42 |
| 3063 Mckenzie Rd | 0.67mi | 3/1.0 (+1) | 936 (-12%) | 9mo | $139,000 | $149 | 34 |
Match score weights: distance 35% · size 25% · config 20% · recency 20%. Top-matched comps best support the ARV.
Projected returns pro-forma
-3.0% appreciation · 1.35% rent growth · sell at horizon
- IRR
- -1.5%
- Equity multiple
- 0.94×
- Total profit
- $-1,394
- Equity at exit
- $13,106
- IRR
- 5.8%
- Equity multiple
- 1.39×
- Total profit
- $9,637
- Equity at exit
- $7,600
Cash invested: $24,612 (down + closing). Projections, not guarantees.
Landlord ↔ Tenant lean methodology
- Overall (STATE)
- 90 Strongly Landlord-Friendly
- State Georgia
- 90 Strongly Landlord-Friendly · R+3
- County
- — inherits STATE
- City
- — inherits STATE
ZIP-level market 30344
- Home prices YoY
- -31.0%
- Rents YoY
- 1.4%
- Active inventory
- 283
- Price-to-rent
- 5.1×
Monthly cashflow live
- Estimated rent
- $1,423 high interval (Pro) →
- Mortgage (P&I)
- −$461
- Tax from tax record
- −$59 /mo · $704/yr
- Insurance
- −$37
- HOA
- −$333
- Vacancy / Maint / Mgmt
- −$299
- Net cashflow
- $235
Break-even live
UW: 25.0% down · 7.5% · 30yr · 1.5% tax · 5.0% vac · 8.0% maint · 8.0% mgmt
Financing live
Cash to close
- Down payment
- $21,975
- Closing costs
- $2,637
- Reserves months
- —
- Total cash needed
- —
Loan-product check · same deal, 3 products live
Conventional
25% down · 7.5% · 30yr
- Down + closing
- —
- Monthly P&I
- —
- Monthly cashflow
- —
- DSCR
- —
- Eligible?
- —
Personal DTI + credit; lowest rate.
DSCR
20% down · 8.5% · 30yr
- Down + closing
- —
- Monthly P&I
- —
- Monthly cashflow
- —
- DSCR
- —
- Eligible?
- —
No personal income docs; deal must DSCR.
Hard money
10% down · 12.0% · 12mo
- Down + closing
- —
- Monthly P&I
- —
- Monthly cashflow
- —
- DSCR
- —
- Eligible?
- —
Short-term bridge; refi at stabilization.
Rent comps 40 comps
| Address | Beds | Baths | Sqft | Rent | $/sqft | DOM | Units | Dist |
|---|---|---|---|---|---|---|---|---|
| 3100 Larose St Atlanta, GA | 3.0 | 1.0 | 1121 | $1,600 | $1.43 | 44d | 1 | 0.08mi |
| 3158 Cloverhurst Dr Atlanta, GA | 3.0 | 2.0 | 1196 | $1,700 | $1.42 | 44d | 1 | 0.18mi |
| 1910 Center Ave Atlanta, GA | 2.0 | 1.0 | 800 | $1,300 | $1.62 | 44d | 1 | 0.22mi |
| 2956 8th St Atlanta, GA | 1.0 | 1.0 | 1000 | $750 | $0.75 | 15d | 1 | 0.26mi |
| 1940 Dunlap Ave Atlanta, GA | 1.0 | 1.0 | 950 | $750 | $0.79 | 44d | 1 | 0.28mi |
| 2977 Pearl St Unit 2 Atlanta, GA | 2.0 | 1.0 | 800 | $1,390 | $1.74 | 2d | 1 | 0.29mi |
| 3184 Pollard St Atlanta, GA | 3.0 | 2.0 | 1400 | $1,800 | $1.29 | 44d | 1 | 0.31mi |
| 1863 Phillips Ave Atlanta, GA | 3.0 | 2.5 | 1470 | $2,115 | $1.44 | 11d | 1 | 0.32mi |
| 3045 Semmes St Atlanta, GA | 2.0 | 1.5 | 1000 | $1,400 | $1.40 | 44d | 3 | 0.40mi |
| 1836 Dunlap Ave Apt 90 Atlanta, GA | 2.0 | 1.5 | 1030 | $1,150 | $1.12 | 24d | 1 | 0.42mi |
| 1827 Dunlap Ave Atlanta, GA | 3.0 | 2.0 | 1250 | $3,200 | $2.56 | 44d | 1 | 0.42mi |
| 1907 Lyle Ave Atlanta, GA | 2.0 | 1.0 | 736 | $1,300 | $1.77 | 44d | 1 | 0.43mi |
| 3241 Turner St Unit 1 East Point, GA | 2.0 | 1.5 | 1200 | $1,295 | $1.08 | 44d | 1 | 0.44mi |
| 2997 Park St Unit 3 Atlanta, GA | 2.0 | 1.5 | 860 | $1,499 | $1.74 | 44d | 1 | 0.48mi |
| 2997 Park St Unit 2 Atlanta, GA | 2.0 | 1.5 | 860 | $1,549 | $1.80 | 5d | 1 | 0.48mi |
| 1861 Lyle Ave Unit 2 Atlanta, GA | 2.0 | 2.0 | 1250 | $1,600 | $1.28 | 44d | 1 | 0.49mi |
| 3300 College St Unit 5 College Park, GA | 2.0 | 1.0 | 760 | $975 | $1.28 | 3d | 1 | 0.49mi |
| 1818 Vesta Ave Atlanta, GA | 1.0–2.0 | 1.0 | 811 | $1,450 | $1.79 | 44d | 5 | 0.49mi |
| 3128 Chateau Blvd East Point, GA | 1.0 | 1.0 | 900 | $1,295 | $1.44 | 24d | 1 | 0.49mi |
| 3128 Chateau Blvd East Point, GA | 1.0–2.0 | 1.0 | 1000 | $1,395 | $1.40 | 15d | 12 | 0.49mi |
| 3030 Remington St Atlanta, GA | 3.0 | 1.0 | 1100 | $1,200 | $1.09 | 24d | 1 | 0.53mi |
| 3198 Washington Rd Atlanta, GA | 2.0 | 1.5 | 1000 | $1,500 | $1.50 | 44d | 1 | 0.54mi |
| 1923 Thompson Ave Unit 2 East Point, GA | 1.0 | 1.0 | 1047 | $1,000 | $0.96 | 44d | 1 | 0.55mi |
| 1923 Thompson Ave Unit 2 East Point, GA | 1.0 | 1.0 | 1047 | $1,000 | $0.96 | 13d | 1 | 0.55mi |
| 3203 E Point St Apt 4 Atlanta, GA | 2.0 | 1.0 | 800 | $1,350 | $1.69 | 24d | 1 | 0.56mi |
| 3203 E Point St Apt 4 Atlanta, GA | 2.0 | 1.0 | 800 | $1,350 | $1.69 | 10d | 1 | 0.56mi |
| 3193 E Point St Unit 4 Atlanta, GA | 2.0 | 1.0 | 800 | $1,350 | $1.69 | 21d | 1 | 0.56mi |
| 3193 E Point St Unit 4 Atlanta, GA | 2.0 | 1.0 | 800 | $1,350 | $1.69 | 10d | 1 | 0.56mi |
| 3031 Remington St Atlanta, GA | 3.0 | 2.0 | 1369 | $1,200 | $0.88 | 19d | 1 | 0.56mi |
| 1804 Lyle Ave Unit 4 College Park, GA | 2.0 | 1.5 | 900 | $1,350 | $1.50 | 44d | 1 | 0.58mi |
| 1915 Walker Ave College Park, GA | 1.0 | 1.0 | 900 | $1,450 | $1.61 | 44d | 1 | 0.59mi |
| 3100 E Point St Atlanta, GA | 2.0 | 1.0 | 850 | $1,224 | $1.44 | 5d | 3 | 0.61mi |
| 2874 Cheney St Atlanta, GA | 2.0 | 1.0 | 900 | $1,300 | $1.44 | 44d | 1 | 0.61mi |
| 2730 Pearl St Unit 1 East Point, GA | 2.0 | 1.0 | 910 | $1,175 | $1.29 | 44d | 1 | 0.68mi |
| 1932 Montrose Dr Atlanta, GA | 3.0 | 1.0 | 1200 | $1,750 | $1.46 | 19d | 1 | 0.69mi |
| 1914 Montrose Dr Atlanta, GA | 2.0 | 1.0 | 1216 | $2,000 | $1.64 | 44d | 1 | 0.70mi |
| 3207 McKenzie Rd Unit 3227 East Point, GA | 2.0 | 1.0 | 800 | $1,395 | $1.74 | 44d | 1 | 0.71mi |
| 3207 McKenzie Rd Unit 3211 East Point, GA | 2.0 | 1.0 | 800 | $1,195 | $1.49 | 44d | 1 | 0.71mi |
| 3207 McKenzie Rd Unit 3213 East Point, GA | 2.0 | 1.0 | 800 | $1,195 | $1.49 | 24d | 1 | 0.71mi |
| 2040 Cambridge Ave Atlanta, GA | 1.0 | 1.0 | 900 | $1,400 | $1.56 | 22d | 1 | 0.73mi |
HOA detail
- Monthly dues
- $333 · $3,996/yr
Listing history 17 events
-
2026-06-18days on market $87,900 Active 49 DOM
-
2026-06-17days on market $87,900 Active 48 DOM
-
2026-06-16days on market $87,900 Active 47 DOM
-
2026-06-15days on market $87,900 Active 46 DOM
-
2026-06-13days on market $87,900 Active 44 DOM
-
2026-06-09days on market $87,900 Active 40 DOM
-
2026-06-08days on market $87,900 Active 39 DOM
-
2026-06-07days on market $87,900 Active 38 DOM
-
2026-06-04days on market $87,900 Active 35 DOM
-
2026-06-03days on market $87,900 Active 34 DOM
-
2026-06-01days on market $87,900 Active 32 DOM
-
2026-05-31days on market $87,900 Active 31 DOM
-
2026-04-30$94,900 New 329-char remark
Show marketing remark (329 chars)
Investors wanted for this gutted to the studs townhouse in East Point. Property is ready for a complete rehab. Make your offer today! Perfect for fix & flip investors looking to increase the value. It would be a nice addition to a buy-&-hold portfolio. Sold As-Is. NO BLIND OFFERS. Must use seller's closing attorney
-
2026-04-30$94,900 Active 335-char remark
Show marketing remark (329 chars)
Investors wanted for this gutted to the studs townhouse in East Point. Property is ready for a complete rehab. Make your offer today! Perfect for fix & flip investors looking to increase the value. It would be a nice addition to a buy-&-hold portfolio. Sold As-Is. NO BLIND OFFERS. Must use seller's closing attorney
-
2009-03-09soldstatus $7,500
Show marketing remark (43 chars)
Great deal in terrific East Point location.
-
2008-11-26$9,900
Show marketing remark (43 chars)
Great deal in terrific East Point location.
-
2003-01-02soldstatus $55,000
ⓘ Source: listings_history table (triggers on properties + properties_extension) + one-shot
backfill from property_details.listing_events for pre-trigger history.
Tax reassessment forecast GA · Resets to sale price
- Current annual tax
- $704 · $59/mo
- Projected year-2 tax
- $809 · $67/mo
- Expected delta
- +$104/yr (+$9/mo · 14.8%)
ⓘ Screening estimate from a state-policy table — verify with the county assessor before closing.
Climate risk First Street
- Flood 1/10 Low FEMA zone X (unshaded) · 0% chance over 30 yrs
- Wildfire 1/10 Low
- Heat 5/10 Major 6 d/yr ≥103°F today · 15 d/yr by 30 yrs out
- Wind 6/10 Major 27% chance of damaging wind over 30 yrs
- Air quality 3/10 Moderate 3 unhealthy d/yr today · 3 by 30 yrs out
Nearby sold comps map
Loading sold comps map…
Walkable amenities ~0.75 mi
Loading nearby amenities…
Taxation est. · year 1
- Rental income
- $17,080
- − Mortgage interest
- −$4,924
- − Property taxes
- −$704
- − Insurance
- −$440
- − Repairs & maintenance
- −$1,366
- − Management
- −$1,366
- − HOA
- −$3,996
- − Depreciation
- −$2,557
- Taxable income
- $1,727
- Est. tax owed @ 24.0%
- −$414
- After-tax cash flow
- $2,408/yr
For passive investors: Depreciation is non-cash, so a rental often shows a tax loss while cash-flowing — sheltering income. Rental losses are passive: they offset passive income freely, and up to $25,000/yr can offset ordinary (W-2) income if you actively participate and your MAGI is under $100k (phasing out to $0 by $150k); unused losses carry forward. On sale, claimed depreciation is recaptured at up to 25%, and gains may owe capital-gains tax (a 1031 exchange can defer both). Figures are a year-1 estimate at your 24.0% rate — not tax advice; consult a CPA.
Schools (NCES district)
- District
- Fulton County
- NCES district ID
- 1302280
- Math proficiency
- 49% ▼ -2.00%
- Reading proficiency
- 53% ▬ 0.00%
- Median HH income
- $68,035
- Composite
- 45.33/100
- National rank
- #2640
- State rank
- #12 of 174 in GA
Livability — East Point
- Score
- 72/100
- State rank
- #72
- US rank
- #6314
Category grades
Schools grade is shown separately in the Schools card above.
Census & demographics
- Census place
- East Point, GA
- County
- Fulton County · 1,094,430 people
- City population
- 35,456
- Metro
- Atlanta-Sandy Springs-Alpharetta, GA
- Population (ZIP)
- 35,456
- Household income
- $68,380
- Rent vs Own
- Severe rent burden
- 2226.0
Population outlook (Fulton County) Hauer SSP2
- Today (2025)
- 1,203,707 people
- By 2030
- 1,299,706 · +8.0%
- By 2040
- 1,488,256 · +23.6%
- By 2050
- 1,664,580 · +38.3%
- By 2075
- 2,036,072 · +69.2%
- By 2100
- 2,222,402 · +84.6%
Race, ethnicity, and origin ACS 2023
- Neighborhood character
- Predominantly Black (74%)
- Race & ethnicity
- Black 74% White 11% Hispanic / Latino 11% Two or more races 6%
- Hispanic origin (detail)
- Mexican 7% Puerto Rican 1%
- Common ancestry
- Italian 1% Swiss 1% Russian 1%
- Foreign-born
- 6% · Canada, Jamaica
- Languages at home
- 87% English-only · Spanish 9% Other Indo-European 1% German/W. Germanic 1%
Political lean MEDSL · Fulton
- 2024 margin
- Solid D (+44.9) · D 71.9% · R 27.0% · Other 1.1%
- 2008→2024 swing
- +9.8pp toward D · 2008: 35.0pp · 2024: 44.9pp
- All cycles
- 2024: D+44.9 2020: D+46.4 2016: D+42.1 2012: D+29.6 2008: D+35.0
Not yet ingested
- Civics
- —
Market trends
- HPI YoY
- ▼ -113.15%
- Current HPI
- 251.7916
- Rent YoY
- ▲ 1.35%
- Metro
- Atlanta-Sandy Springs-Alpharetta, GA
- State GDP YoY
- ▲ 2.66%
- F500 in state
- 28
Industry mix (Fortune 500 HQ in GA)
| Industry | F500 HQs | Revenue |
|---|---|---|
| Paper / Packaging | 2 | $29B |
|
||
| Retail | 1 | $160B |
|
||
| Transportation / Logistics | 1 | $91B |
|
||
| Airlines | 1 | $62B |
|
||
| Consumer Goods | 1 | $47B |
|
||
| Utilities | 1 | $25B |
|
||
Price history
+59.8% since first listed7 events — show timeline
- 2026-05-22 Price Changed $87,900 GAMLS
- 2026-05-22 Price Changed $87,900 FMLS
- 2026-04-30 Listed $94,900 FMLS
- 2026-04-30 Listed $94,900 GAMLS
- 2009-03-09 Sold (MLS) $7,500 FMLS
- 2008-11-26 Listed $9,900 FMLS
- 2003-01-02 Sold (Public Records) $55,000 Public Records
Property tax history
+0.7%/yrLatest (2025): $704 · +0.1% YoY. Source: county tax records.
Cash-flow waterfall
monthlySold comps — $/sqft
last 12 mo · ≤1 miLoading sold comps…