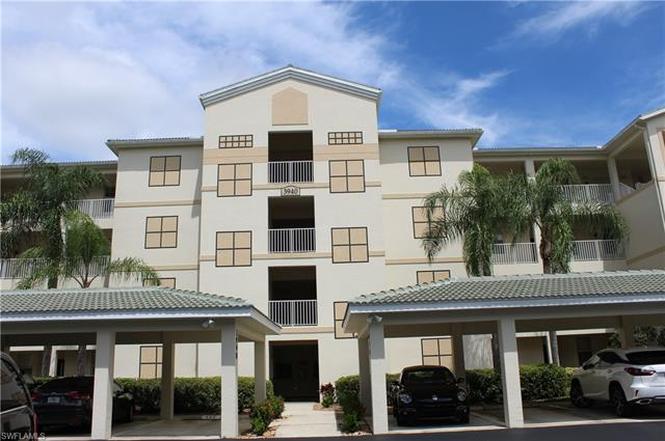
3940 Loblolly Bay Dr #402 · Golden Gate, FL
Flood risk 1/10 · Minimal
- FEMA flood zone
- X (unshaded)
- Chance of flooding over 30 yrs
- 0.0%
- Est. flood insurance / yr
- $507 – $1,088
Fire risk 3/10 · Minor
- Est. fire insurance / yr
- $947 – $1,759
Heat risk 10/10 · Severe
- Hot days now (above 108°F)
- 7 days/yr
- Hot days in 30 yrs
- 29 days/yr
Wind risk 10/10 · Severe
- Chance of severe wind over 30 yrs
- 99.0%
Air-quality risk 2/10 · Minimal
- Unhealthy air days now
- 2 days/yr
- Unhealthy air days in 30 yrs
- 2 days/yr
Risk factors via First Street. Map © Google.
Why this score? — see what drove the D grade
The composite is a weighted blend of 9 inputs, each scored 0–100. Each bar is that input's sub-score; the figure is the points it added to the 100-point composite (weight × sub-score).
- ARV discount +7.5/15.0
- 1% rule +7.1/10.0
- Cash flow +7.0/30.0
- Schools +5.0/10.0
- Appreciation +4.3/10.0
- Livability +3.5/5.0
- Rent growth +3.3/5.0
- Condition / age +2.5/5.0
- DSCR +1.2/10.0
$249,900
🖨 Deal sheet (PDF) 📄 Offer letter ✓ Due diligence
Listing remarks
Golf Included! Experience refined living in this pristine 4th-floor condominium featuring 2 bedrooms and 2 full baths, ideally located within Forest Glen Golf & Country Club. Offered turnkey furnished, this residence showcases tasteful décor, quality finishes, and thoughtful upgrades throughout—ready for immediate enjoyment. Forest Glen is a full-service, bundled golf community delivering an exceptional lifestyle. Amenities include an 18-hole championship golf course, tennis courts, resort-style swimming pools, a state-of-the-art fitness center, fine dining, bocce, pickleball courts, and elegant meeting and banquet facilities. Relax and unwind on your private screened bal
Key facts
- Tranquil lake views
- Tennis courts
- Golf course views
Tags
Property features AI
Finance
- Other: Golf bundled community
- Financial info: One-time other fee applies
- HOA & community: Mandatory HOA; Condo fee paid quarterly; Master HOA fee paid quarterly; Professional management; Maintenance covers cable, golf course, insurance, irrigation water, lawn/land maintenance, legal/accounting, exterior and interior pest control, security, street lights, trash removal, and water; Community amenities include: community pool, community spa/hot tub, exercise room, extra storage, golf course, pickleball, tennis courts, bocce court, putting green, cabana, community room, BBQ/picnic area, bike and jog path, restaurant, sidewalks, streetlights, private membership options
Exterior
- Parking: Detached 1-car carport
- Security: Gated community; Guard at gate
- Utilities: Central water; Central sewer; Cable available
- Home design: Residential mid-rise (4-7 stories); Unit 402; Rear exposure facing northeast; Condo within Forest Glen development
- Construction: Concrete block construction; Stucco exterior; Tile roof; Built in 2002
- Exterior features: Patio; Screened balcony; Zero lot line
Interior
- Kitchen: Dishwasher; Disposal; Microwave; Range; Refrigerator / icemaker; Pantry
- Bedrooms: 2 bedrooms
- Flooring: Carpet; Tile
- Bathrooms: 2 full bathrooms; Master bathroom with shower only
- Heating & cooling: Central electric heat; Central electric cooling; Ceiling fans
- Interior features: Built-in cabinets; Cable prewire; Fire sprinkler system; Foyer; Multiple phone lines; Pantry; Smoke detectors; Volume ceiling; Walk-in closet; Window coverings; Common elevator; Turnkey furnished; Great room floor plan with split bedrooms; Screened balcony
- Laundry & utility: Washer; Dryer
Neighborhood map
What this means for you Summary
Snapshot
- This is a 2-bed/2.0-bath condo listed at $250k.
Deal economics
- At list price, monthly cash flow is $-362 ($-4k/yr) — negative.
- To cash-flow at today's rent, offer at most $186k (25.6% below list).
- Meets the 1% rule at list price ($3k rent vs $250k).
- Recommended offer: $186k (25.6% below list) — sets the bar for cash-flow.
Location & tenants
- Location reads 69/100 on livability (#455 in FL) — a middle-class / working-renter tenant base. Strengths: housing A+, health & safety A+, cost of living B; Watch: employment D+, amenities F, commute F.
- Collier (suburban): math 60% / reading 56% proficiency, ranked #16 of 73 in FL (top 22%) — acceptable for families but not a draw, mixed tenant base, ~2y average lease.
- Zoned schools: Lely Elementary School (math 45% / reading 46%, grade D-, #1,247 of 2,144 statewide, top 59%, 499 students, 62% FRL); Manatee Middle School (math 61% / reading 43%, grade C+, #217 of 571 statewide, top 40%, 749 students, 64% FRL); Lely High School (math 40% / reading 39%, grade F, #304 of 667 statewide, top 47%, 1,504 students, 54% FRL).
- Zoned-school proficiency averages 46% at this address vs 58% district-wide (-12 pts) — the specific schools serving this property underperform the Collier average; the district grade overstates school quality for this exact location.
- Market conditions: Rents rising (+3.2%/yr); 904 active listings in the ZIP; 15 comparable units currently listed for rent nearby; rentals at typical pace (median 25d on market — plan ~3-4 weeks tenant-placement turnaround); solid renter incomes; 3,520 units permitted in Collier County in 2024 (959 in 5+ unit buildings).
- This rent runs 41% of the median local income ($89k/yr) — at the standard rent-burdened threshold; future hikes will face affordability resistance.
Forward outlook
- Local home prices are declining (-1.5%/yr); year-one equity from $2k of loan paydown is wiped out by about $4k of value loss. Plan a longer hold.
- Collier County population projected at +30% by 2050 — long-run rental-demand tailwind backs the buy-and-hold thesis.
Negotiation context
- It's been on market 110 days — a 9% lower offer ($227k) is reasonable based on typical stale-listing flexibility.
- Current owner paid $125k; list at $250k implies a 100% gain — meaningful room to come down on a strong offer.
Risks & watch-outs
- Watch-outs: HOA is 38% of rent.
- Climate carrying-cost: severe wind risk, 99% chance of damaging wind over 30y; extreme-heat days projected 7→29/yr by 2055 (HVAC capex compounding) — expect insurance premiums to compound above CPI over the hold.
Questions for the listing agent
- What do current leases actually rent for vs. the listed asking? Can we see a recent rent roll and the last 12 months of T-12 income?
- It's been on market 110 days. Have you received any prior offers? Is the seller open to a 26% concession, seller financing, or rate buy-down credit?
- What does the HOA fee cover, when was the last increase, and are there any pending special assessments or reserve-fund shortfalls?
- Any open or pending special assessments — roof, HVAC, plumbing, elevator, façade? What's the per-unit balance and payoff schedule, and is the seller paying it off at close or rolling it to the buyer?
- Why hasn't it sold? Are there any deal-killer items the seller is aware of (foundation, flood, title, zoning, code violations)?
- Is there a deadline driving the sale (1031 exchange, divorce, estate, relocation)? That informs how much negotiation room exists.
- The area grade is low — what's the realistic commute time and amenity access for the typical tenant pool here? Any planned neighborhood developments (good or bad) we should know about?
- What's the average days-on-market for RENTAL listings here right now (not sales)? A rising rental-DOM trend means longer vacancies and softer asking-rent achievability than the comps imply.
- What's the recent tenant-quality profile in this submarket — average credit score on applications, eviction rate, late-payment / NSF rate, and stable-employment percentage? A property-management company in the area should have these aggregated.
- How much new apartment / multifamily construction is in the pipeline within 1–3 miles? Heavy new supply (>2% of stock underway) typically softens rents 12–24 months out; light construction supports rent growth.
Investment metrics
- 1% rule
- 1.21% ✓
- Cap rate
- 4.55%
- Cash-on-cash
- -6.21%
- DSCR
- 0.72
- GRM
- 6.9
CMA / ARV
No comps found within radius.
Projected returns pro-forma
-1.48% appreciation · 3.21% rent growth · sell at horizon
- IRR
- -16.0%
- Equity multiple
- 0.34×
- Total profit
- $-45,943
- Equity at exit
- $54,606
- IRR
- -8.4%
- Equity multiple
- 0.29×
- Total profit
- $-49,396
- Equity at exit
- $52,601
Cash invested: $69,972 (down + closing). Projections, not guarantees.
Landlord ↔ Tenant lean methodology
- Overall (STATE)
- 87 Strongly Landlord-Friendly
- State Florida
- 87 Strongly Landlord-Friendly · R+3
- County
- — inherits STATE
- City
- — inherits STATE
ZIP-level market 34114
- Home prices YoY
- -0.6%
- Rents YoY
- 3.2%
- Active inventory
- 904
- Price-to-rent
- 6.9×
Monthly cashflow live
- Estimated rent
- $3,022 high interval (Pro) →
- Mortgage (P&I)
- −$1,311
- Tax from tax record
- −$194 /mo · $2,330/yr
- Insurance
- −$104
- HOA
- −$1,141
- Vacancy / Maint / Mgmt
- −$635
- Net cashflow
- $-362
Break-even live
Sensitivity live
| Price | -10% $-221 | -5% $-291 | +0% $-362 | +5% $-433 | +10% $-504 |
|---|---|---|---|---|---|
| Rent | -10% $-601 | -5% $-482 | +0% $-362 | +5% $-243 | +10% $-123 |
| Rate | -1.0pp $-236 | -0.5pp $-299 | base $-362 | +0.5pp $-427 | +1.0pp $-493 |
UW: 25.0% down · 7.5% · 30yr · 1.5% tax · 5.0% vac · 8.0% maint · 8.0% mgmt
Financing live
Cash to close
- Down payment
- $62,475
- Closing costs
- $7,497
- Reserves months
- —
- Total cash needed
- —
Loan-product check · same deal, 3 products live
Conventional
25% down · 7.5% · 30yr
- Down + closing
- —
- Monthly P&I
- —
- Monthly cashflow
- —
- DSCR
- —
- Eligible?
- —
Personal DTI + credit; lowest rate.
DSCR
20% down · 8.5% · 30yr
- Down + closing
- —
- Monthly P&I
- —
- Monthly cashflow
- —
- DSCR
- —
- Eligible?
- —
No personal income docs; deal must DSCR.
Hard money
10% down · 12.0% · 12mo
- Down + closing
- —
- Monthly P&I
- —
- Monthly cashflow
- —
- DSCR
- —
- Eligible?
- —
Short-term bridge; refi at stabilization.
Rent comps 15 comps
| Address | Beds | Baths | Sqft | Rent | $/sqft | DOM | Units | Dist |
|---|---|---|---|---|---|---|---|---|
| 3940 Loblolly Bay Dr Unit 2-104 Naples, FL | 2.0 | 2.0 | 1300 | $4,500 | $3.46 | 25d | 1 | 0.03mi |
| 3950 Loblolly Bay Dr #402 Naples, FL | 2.0 | 2.0 | 1185 | $1,660 | $1.40 | 15d | 1 | 0.10mi |
| 3950 Loblolly Bay Dr Unit 3-402 Naples, FL | 2.0 | 2.0 | 1185 | $4,200 | $3.54 | 25d | 1 | 0.10mi |
| 3973 Bishopwood Ct E #104 Naples, FL | 3.0 | 2.0 | 1261 | $2,295 | $1.82 | 25d | 1 | 0.11mi |
| 3973 Bishopwood Ct E Unit 1546214P Naples, FL | 3.0 | 2.0 | 1442 | $2,435 | $1.69 | 15d | 1 | 0.11mi |
| 3981 Bishopwood Ct E #104 Naples, FL | 2.0 | 2.0 | 1417 | $2,750 | $1.94 | 25d | 1 | 0.12mi |
| 3964 Bishopwood Ct E Unit 202 Naples, FL | 2.0 | 2.0 | 1417 | $1,810 | $1.28 | 25d | 1 | 0.12mi |
| 3964 Bishopwood Ct E #202 Naples, FL | 2.0 | 2.0 | 1417 | $3,400 | $2.40 | 23d | 1 | 0.12mi |
| 3964 Bishopwood Ct E Unit 1-202 Naples, FL | 2.0 | 2.0 | 1417 | $3,400 | $2.40 | 15d | 1 | 0.12mi |
| 3830 Sawgrass Way #2944 Naples, FL | 2.0 | 2.0 | 1125 | $5,350 | $4.76 | 15d | 1 | 0.80mi |
| 3830 Sawgrass Way #2934 Naples, FL | 2.0 | 2.0 | 1100 | $4,250 | $3.86 | 25d | 1 | 0.80mi |
| 3820 Sawgrass Way #3046 Naples, FL | 2.0 | 2.0 | 1232 | $4,800 | $3.90 | 25d | 1 | 0.82mi |
| 9300 Marino Cir Naples, FL | 1.0–3.0 | 1.0–2.0 | 1098 | $1,962 | $1.79 | 15d | 16 | 0.91mi |
| 120 Bedzel Cir Naples, FL | 1.0–3.0 | 1.0–2.0 | 1079 | $2,518 | $2.33 | 15d | 38 | 1.16mi |
| 8420 Naples Heritage Dr #1415 Naples, FL | 2.0 | 2.0 | 1333 | $2,700 | $2.03 | 25d | 1 | 1.41mi |
HOA detail condo
- Monthly dues
- $1,141 · $13,692/yr
- Likely covers
- poolgym
- Assessments
- None detected in remarks — confirm with the listing agent.
Listing history 13 events
-
2026-06-21days on market $249,900 Active 110 DOM
-
2026-06-18days on market $249,900 Active 107 DOM
-
2026-06-17days on market $249,900 Active 106 DOM
-
2026-06-16days on market $249,900 Active 105 DOM
-
2026-06-15days on market $249,900 Active 104 DOM
-
2026-06-14days on market $249,900 Active 102 DOM
-
2026-06-10days on market $249,900 Active 99 DOM
-
2026-06-09days on market $249,900 Active 98 DOM
-
2026-06-08days on market $249,900 Active 97 DOM
-
2026-06-07pricedays on market $249,900 Active 96 DOM
-
2026-06-03days on market $253,700 Active 92 DOM
-
2026-06-03remarks 682-char remark
-
2026-06-03$253,700 Active 91 DOM
ⓘ Source: listings_history table (triggers on properties + properties_extension) + one-shot
backfill from property_details.listing_events for pre-trigger history.
Tax reassessment forecast FL · Resets to sale price
- Current annual tax
- $2,330 · $194/mo
- Projected year-2 tax
- $2,330 · $194/mo
- Expected delta
- $0/yr ($0/mo · 0.0%)
ⓘ Screening estimate from a state-policy table — verify with the county assessor before closing.
Climate risk First Street
- Flood 1/10 Low FEMA zone X (unshaded) · 0% chance over 30 yrs
- Wildfire 3/10 Moderate
- Heat 10/10 Extreme 7 d/yr ≥108°F today · 29 d/yr by 30 yrs out
- Wind 10/10 Extreme 99% chance of damaging wind over 30 yrs
- Air quality 2/10 Low 2 unhealthy d/yr today · 2 by 30 yrs out
Nearby sold comps map
Loading sold comps map…
Walkable amenities ~0.75 mi
Loading nearby amenities…
Taxation est. · year 1
- Rental income
- $36,268
- − Mortgage interest
- −$13,998
- − Property taxes
- −$2,330
- − Insurance
- −$1,250
- − Repairs & maintenance
- −$2,901
- − Management
- −$2,901
- − HOA
- −$13,692
- − Depreciation
- −$7,270
- Taxable loss
- −$8,075
- Est. tax savings @ 24.0%
- +$1,938
- After-tax cash flow
- $-2,408/yr
For passive investors: Depreciation is non-cash, so a rental often shows a tax loss while cash-flowing — sheltering income. Rental losses are passive: they offset passive income freely, and up to $25,000/yr can offset ordinary (W-2) income if you actively participate and your MAGI is under $100k (phasing out to $0 by $150k); unused losses carry forward. On sale, claimed depreciation is recaptured at up to 25%, and gains may owe capital-gains tax (a 1031 exchange can defer both). Figures are a year-1 estimate at your 24.0% rate — not tax advice; consult a CPA.
Schools (NCES district)
- District
- Collier
- NCES district ID
- 1200330
- Math proficiency
- 60% ▼ -4.00%
- Reading proficiency
- 56% ▼ -2.00%
- Median HH income
- $58,275
- Composite
- 50.23/100
- National rank
- #1892
- State rank
- #16 of 73 in FL
Livability — Golden Gate
- Score
- 69/100
- State rank
- #455
- US rank
- #8290
Category grades
Schools grade is shown separately in the Schools card above.
Census & demographics
- County
- Collier County · 396,295 people
- City population
- 34,872
- Metro
- Naples-Marco Island, FL
- Population (ZIP)
- 23,559
- Household income
- $89,334
- Rent vs Own
- Severe rent burden
- 550.0
Population outlook (Collier County) Hauer SSP2
- Today (2025)
- 420,858 people
- By 2030
- 450,054 · +6.9%
- By 2040
- 502,232 · +19.3%
- By 2050
- 544,932 · +29.5%
- By 2075
- 627,203 · +49.0%
- By 2100
- 659,015 · +56.6%
Race, ethnicity, and origin ACS 2023
- Neighborhood character
- Predominantly White (72%)
- Race & ethnicity
- White 72% Hispanic / Latino 17% Two or more races 13% Black 7%
- Hispanic origin (detail)
- Mexican 7% Puerto Rican 1% Cuban 3%
- Common ancestry
- Hispanic 5% Romanian 4% Lithuanian 1%
- Foreign-born
- 21% · Canada, Jamaica
- Languages at home
- 75% English-only · Spanish 15% French/Haitian/Cajun 5% Other Indo-European 4%
Political lean MEDSL · Collier
- 2024 margin
- Solid R (+33.1) · D 33.1% · R 66.2%
- 2008→2024 swing
- -10.6pp toward R · 2008: -22.5pp · 2024: -33.1pp
- All cycles
- 2024: R+33.1 2020: R+24.7 2016: R+26.0 2012: R+30.1 2008: R+22.5
Not yet ingested
- Civics
- —
Market trends
- HPI YoY
- ▼ -1.48%
- Current HPI
- 266.5545
- Rent YoY
- ▲ 3.21%
- Metro
- Naples-Marco Island, FL
- State GDP YoY
- ▲ 3.28%
- F500 in state
- 36
Industry mix (Fortune 500 HQ in FL)
| Industry | F500 HQs | Revenue |
|---|---|---|
| Industrial Technology | 2 | $29B |
|
||
| Insurance | 2 | $17B |
|
||
| Retail | 1 | $60B |
|
||
| Technology Distribution | 1 | $58B |
|
||
| Homebuilding | 1 | $35B |
|
||
| Technology Manufacturing | 1 | $35B |
|
||
Price history
+104.0% since first listed10 events — show timeline
- 2026-06-05 Price Changed $249,900 NAPLESMLS
- 2026-05-27 Price Changed $253,700 NAPLESMLS
- 2026-04-08 Price Changed $257,700 NAPLESMLS
- 2026-03-22 Price Changed $279,900 NAPLESMLS
- 2026-03-15 Price Changed $284,000 NAPLESMLS
- 2026-03-12 Price Changed $289,700 NAPLESMLS
- 2026-03-10 Price Changed $294,700 NAPLESMLS
- 2026-03-03 Listed $297,700 NAPLESMLS
- 2014-06-17 Sold (Public Records) $125,000 Public Records
- 2010-02-17 Sold (Public Records) $122,500 Public Records
Property tax history
+5.7%/yrLatest (2025): $2,330 · +8.6% YoY. Source: county tax records.
Cash-flow waterfall
monthlySold comps — $/sqft
last 12 mo · ≤1 miLoading sold comps…