525 E Main St · Branford Center, CT
Flood risk No data
- FEMA flood zone
- —
- Chance of flooding over 30 yrs
- —
- Est. flood insurance / yr
- —
Fire risk No data
- Est. fire insurance / yr
- —
Heat risk No data
- Hot days now (above threshold)
- —
- Hot days in 30 yrs
- —
Wind risk No data
- Chance of severe wind over 30 yrs
- —
Air-quality risk No data
- Unhealthy air days now
- —
- Unhealthy air days in 30 yrs
- —
Risk factors via First Street. Map © Google.
Why this score? — see what drove the D+ grade
The composite is a weighted blend of 9 inputs, each scored 0–100. Each bar is that input's sub-score; the figure is the points it added to the 100-point composite (weight × sub-score).
- Cash flow +15.0/30.0
- ARV discount +7.5/15.0
- 1% rule +5.0/10.0
- DSCR +5.0/10.0
- Rent growth +5.0/5.0
- Schools +4.2/10.0
- Livability +4.0/5.0
- Condition / age +2.5/5.0
- Appreciation +0.0/10.0
$45,000
🖨 Deal sheet 📄 Offer letter ✓ Due diligence
Listing remarks MLS
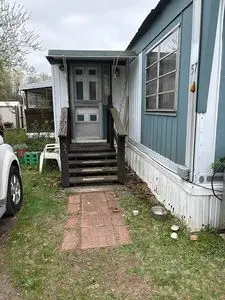
2 bedroom 1 bath, rare double size mobile home in Shoreline trailer homes, cozy open floor plan. Mint condition with some updates. New carpet, new vanity in the bathroom, new piping. Newer hot water heater, dryer and washer, new shed. Nicely landscaped. Convenient to I-95, stony Creek., shopping. Land lease $480 monthly.
Key facts
- Good sized shed
- Large 3 season porch
- Built 1964
Tags
Neighborhood map
What this means for you Summary
Snapshot
- This is a 2-bed/1.0-bath manufactured listed at $45k.
Deal economics
- At list price, monthly cash flow is $2k ($22k/yr) — positive.
- The deal already cash-flows at list — no discount required.
- Meets the 1% rule at list price ($3k rent vs $45k).
- Recommended offer: $44k (1.5% below list) — sets the bar for market timing.
- Cap rate 54.1% vs local median 3.7% in Branford Center — top-decile yield for the area; either an underpriced asset or a hidden risk that comps aren't pricing in. Stress-test before assuming the spread holds.
Location & tenants
- Location reads 81/100 on livability (#16 in CT, #1,386 nationally) — a professional / high-income tenant draw. Strengths: crime A+, health & safety A+, housing B+; Watch: commute D+, cost of living D+.
- Branford School District (suburban): math 41% / reading 52% proficiency, ranked #85 of 153 in CT (top 56%) — families likely to look elsewhere, expect single-tenant / working-renter base with shorter leases; only 18% free/reduced lunch — higher-income household profile.
- Market conditions: Rents rising fast (+10.6%/yr); 114 active listings in the ZIP; 2 comparable units currently listed for rent nearby; solid renter incomes; 1,059 units permitted in South Central Connecticut Planning Region in 2024 (779 in 5+ unit buildings).
- This rent runs 30% of the median local income ($105k/yr) — at the standard rent-burdened threshold; future hikes will face affordability resistance.
Forward outlook
- Local home prices are declining (-3.0%/yr); year-one equity from $311 of loan paydown is wiped out by about $1k of value loss. Plan a longer hold.
- At projected returns (-3.0% appreciation + 8.0% rent growth), your $13k cash investment doubles in ~1 year — after that, you're playing with house money.
Negotiation context
- It's been on market 15 days — a 2% lower offer ($44k) is reasonable based on typical stale-listing flexibility.
- 20 sale attempts since 25y ago; this cycle's ask is 114% above the opening price — seller raised mid-cycle; expect resistance to lowballs.
- Current owner paid $21k; list at $45k implies a 114% gain — meaningful room to come down on a strong offer.
Questions for the listing agent
- Built in 1964 — when were the roof, HVAC, electrical panel, plumbing, and water heater last replaced?
- Is there a deadline driving the sale (1031 exchange, divorce, estate, relocation)? That informs how much negotiation room exists.
- Schools are B-rated — typically a magnet for longer-tenancy family renters. What's the average tenant stay here, and is there a school-zone premium baked into asking?
- The area grade is low — what's the realistic commute time and amenity access for the typical tenant pool here? Any planned neighborhood developments (good or bad) we should know about?
- What's the average days-on-market for RENTAL listings here right now (not sales)? A rising rental-DOM trend means longer vacancies and softer asking-rent achievability than the comps imply.
- What's the recent tenant-quality profile in this submarket — average credit score on applications, eviction rate, late-payment / NSF rate, and stable-employment percentage? A property-management company in the area should have these aggregated.
- How much new for-sale + rental construction is in the pipeline within 1–3 miles? Heavy new supply typically softens prices + rents 12–24 months out; constrained supply supports both.
Investment metrics
- 1% rule
- 5.85% ✓
- Cap rate
- 54.12%
- Cash-on-cash
- 170.81%
- DSCR
- 8.60
- GRM
- 1.4
CMA / ARV
No comps found within radius.
Projected returns pro-forma
-3.0% appreciation · 8.0% rent growth · sell at horizon
- IRR
- —
- Equity multiple
- 10.59×
- Total profit
- $120,876
- Equity at exit
- $6,710
- IRR
- —
- Equity multiple
- 26.06×
- Total profit
- $315,764
- Equity at exit
- $3,891
Cash invested: $12,600 (down + closing). Projections, not guarantees.
Landlord ↔ Tenant lean methodology
- Overall (STATE)
- 27 Tenant-Leaning
- State Connecticut
- 27 Tenant-Leaning · D+7
- County
- — inherits STATE
- City
- — inherits STATE
ZIP-level market 06405
- Rents YoY
- 10.6%
- Active inventory
- 114
- Price-to-rent
- 1.4×
Monthly cashflow live
- Estimated rent
- $2,632 medium interval (Pro) →
- Mortgage (P&I)
- −$236
- Tax from tax record
- −$31 /mo · $375/yr
- Insurance
- −$19
- HOA
- −$0
- Vacancy / Maint / Mgmt
- −$553
- Net cashflow
- $1,794
Break-even live
UW: 25.0% down · 7.5% · 30yr · 1.5% tax · 5.0% vac · 8.0% maint · 8.0% mgmt
Financing live
Cash to close
- Down payment
- $11,250
- Closing costs
- $1,350
- Reserves months
- —
- Total cash needed
- —
Loan-product check · same deal, 3 products live
Conventional
25% down · 7.5% · 30yr
- Down + closing
- —
- Monthly P&I
- —
- Monthly cashflow
- —
- DSCR
- —
- Eligible?
- —
Personal DTI + credit; lowest rate.
DSCR
20% down · 8.5% · 30yr
- Down + closing
- —
- Monthly P&I
- —
- Monthly cashflow
- —
- DSCR
- —
- Eligible?
- —
No personal income docs; deal must DSCR.
Hard money
10% down · 12.0% · 12mo
- Down + closing
- —
- Monthly P&I
- —
- Monthly cashflow
- —
- DSCR
- —
- Eligible?
- —
Short-term bridge; refi at stabilization.
Rent comps 2 comps
| Address | Beds | Baths | Sqft | Rent | $/sqft | DOM | Units | Dist |
|---|---|---|---|---|---|---|---|---|
| 375 E Main St Branford, CT | 2.0 | 1.0–2.0 | 751 | $3,099 | $4.13 | 2d | 12 | 0.65mi |
| 7 Mill Plain Rd Branford, CT | 1.0–2.0 | 1.0 | 885 | $2,245 | $2.54 | 3d | 4 | 1.41mi |
Listing history 42 events
-
2026-05-12$45,000 Active 775-char remark
-
2015-10-16soldstatus $21,000 322-char remark
Show marketing remark (322 chars)
2 bedroom 1 bath, rare double size mobile home in Shoreline trailer homes, cozy open floor plan. Mint condition with some updates. New carpet, new vanity in the bathroom, new piping. Newer hot water heater, dryer and washer, new shed. Nicely landscaped. Convenient to I-95, stony Creek., shopping. Land lease $480 monthly.
-
2015-10-09historical 322-char remark
Show marketing remark (322 chars)
2 bedroom 1 bath, rare double size mobile home in Shoreline trailer homes, cozy open floor plan. Mint condition with some updates. New carpet, new vanity in the bathroom, new piping. Newer hot water heater, dryer and washer, new shed. Nicely landscaped. Convenient to I-95, stony Creek., shopping. Land lease $480 monthly.
-
2015-08-04$21,000 322-char remark
Show marketing remark (322 chars)
2 bedroom 1 bath, rare double size mobile home in Shoreline trailer homes, cozy open floor plan. Mint condition with some updates. New carpet, new vanity in the bathroom, new piping. Newer hot water heater, dryer and washer, new shed. Nicely landscaped. Convenient to I-95, stony Creek., shopping. Land lease $480 monthly.
-
2011-05-06soldstatus $10,000
Show marketing remark (144 chars)
Great rental alternative. Close to shopping and turnpike. Newer kitchen cabinets & counter tops. Washer/dryer included. Land leases $460/mo.
-
2011-03-15$13,500
Show marketing remark (144 chars)
Great rental alternative. Close to shopping and turnpike. Newer kitchen cabinets & counter tops. Washer/dryer included. Land leases $460/mo.
-
2011-01-01historical
-
2010-09-17soldstatus $23,000
-
2010-07-01$32,900
-
2010-01-23$25,000
-
2009-11-25historical
-
2009-08-05$49,000
-
2009-08-03historical
-
2009-07-31soldstatus $20,000
-
2009-05-05$49,999
-
2009-04-30historical
-
2009-03-21$24,900
-
2008-09-30$40,000
-
2008-04-25soldstatus $24,500
-
2008-03-28historical
-
2008-02-14historical
-
2007-11-14$54,900
-
2007-08-28$19,600
-
2007-08-02$27,000
-
2007-07-31historical
-
2007-03-13historical
-
2007-01-09$69,500
-
2006-09-13$23,500
-
2006-07-13soldstatus $5,500
-
2006-04-17$10,500
-
2006-02-08soldstatus $20,000
-
2006-01-20$20,500
-
2002-12-17soldstatus $8,500
-
2002-10-01soldstatus $12,500
-
2002-07-22$10,500
-
2002-06-01soldstatus $21,500
-
2002-04-22$23,000
-
2002-03-20soldstatus $35,000
-
2002-01-18$16,000
-
2001-05-25soldstatus $23,000
-
2001-03-13$26,500
-
2001-01-19$24,900
ⓘ Source: listings_history table (triggers on properties + properties_extension) + one-shot
backfill from property_details.listing_events for pre-trigger history.
Tax reassessment forecast CT · Partial reset (capped growth)
- Current annual tax
- $375 · $31/mo
- Projected year-2 tax
- $669 · $56/mo
- Expected delta
- +$294/yr (+$24/mo · 78.4%)
ⓘ Screening estimate from a state-policy table — verify with the county assessor before closing.
Nearby sold comps map
Loading sold comps map…
Walkable amenities ~0.75 mi
Loading nearby amenities…
Taxation est. · year 1
- Rental income
- $31,588
- − Mortgage interest
- −$2,521
- − Property taxes
- −$375
- − Insurance
- −$225
- − Repairs & maintenance
- −$2,527
- − Management
- −$2,527
- − Depreciation
- −$1,309
- Taxable income
- $22,104
- Est. tax owed @ 24.0%
- −$5,305
- After-tax cash flow
- $16,218/yr
For passive investors: Depreciation is non-cash, so a rental often shows a tax loss while cash-flowing — sheltering income. Rental losses are passive: they offset passive income freely, and up to $25,000/yr can offset ordinary (W-2) income if you actively participate and your MAGI is under $100k (phasing out to $0 by $150k); unused losses carry forward. On sale, claimed depreciation is recaptured at up to 25%, and gains may owe capital-gains tax (a 1031 exchange can defer both). Figures are a year-1 estimate at your 24.0% rate — not tax advice; consult a CPA.
Schools (NCES district)
- District
- Branford School District
- NCES district ID
- 0900420
- Math proficiency
- 41% ▼ -14.00%
- Reading proficiency
- 52% ▼ -10.00%
- Median HH income
- $70,979
- Composite
- 41.85/100
- National rank
- #3377
- State rank
- #85 of 153 in CT
Livability — Branford Center
- Score
- 81/100
- State rank
- #16
- US rank
- #1386
Category grades
Schools grade is shown separately in the Schools card above.
Census & demographics
- County
- New Haven County · 688,236 people
- Metro
- New Haven-Milford, CT
- Population (ZIP)
- 28,217
- Household income
- $105,225
- Rent vs Own
- Severe rent burden
- 1132.0
Population outlook (South Central Connecticut County) Hauer SSP2
- By 2040
- 608,362
Race, ethnicity, and origin ACS 2023
- Neighborhood character
- Predominantly White (85%)
- Race & ethnicity
- White 85% Hispanic / Latino 5% Asian 4% Two or more races 4% Black 3%
- Hispanic origin (detail)
- Puerto Rican 1%
- Common ancestry
- Romanian 7% Lithuanian 2% Slovak 2%
- Foreign-born
- 10% · Canada, South Korea
- Languages at home
- 90% English-only · Spanish 4% Other Indo-European 3% Other Asian/Pacific 1%
Political lean MEDSL · South Central Connecticut
- 2024 margin
- Strong D (+20.1) · D 59.0% · R 38.9% · Other 2.1%
- All cycles
- 2024: D+20.1
Not yet ingested
- Civics
- —
Market trends
- HPI YoY
- ▼ -455.72%
- Current HPI
- 189.8481
- Rent YoY
- ▲ 10.58%
- Metro
- New Haven-Milford, CT
- State GDP YoY
- ▲ 1.06%
- F500 in state
- 38
Industry mix (Fortune 500 HQ in CT)
| Industry | F500 HQs | Revenue |
|---|---|---|
| Industrial Machinery | 4 | $38B |
|
||
| Insurance | 3 | $71B |
|
||
| Financial Services | 2 | $25B |
|
||
| Transportation / Logistics | 2 | $18B |
|
||
| Healthcare | 1 | $247B |
|
||
| Telecommunications | 1 | $55B |
|
||
Price history
-15.7% since first listed41 events — show timeline
- 2015-10-16 Sold (MLS) $21,000 Smart MLS
- 2015-10-09 Listing Removed — Smart MLS
- 2015-08-04 Listed $21,000 Smart MLS
- 2011-05-06 Sold (MLS) $10,000 Smart MLS
- 2011-03-15 Listed $13,500 Smart MLS
- 2011-01-01 Listing Removed — Smart MLS
- 2010-09-17 Sold (MLS) $23,000 Smart MLS
- 2010-07-01 Listed $32,900 Smart MLS
- 2010-01-23 Listed $25,000 Smart MLS
- 2009-11-25 Listing Removed — Smart MLS
- 2009-08-05 Listed $49,000 Smart MLS
- 2009-08-03 Listing Removed — Smart MLS
- 2009-07-31 Sold (MLS) $20,000 Smart MLS
- 2009-05-05 Listed $49,999 Smart MLS
- 2009-04-30 Listing Removed — Smart MLS
- 2009-03-21 Listed $24,900 Smart MLS
- 2008-09-30 Listed $40,000 Smart MLS
- 2008-04-25 Sold (MLS) $24,500 Smart MLS
- 2008-03-28 Listing Removed — Smart MLS
- 2008-02-14 Listing Removed — Smart MLS
- 2007-11-14 Listed $54,900 Smart MLS
- 2007-08-28 Listed $19,600 Smart MLS
- 2007-08-02 Listed $27,000 Smart MLS
- 2007-07-31 Listing Removed — Smart MLS
- 2007-03-13 Listing Removed — Smart MLS
- 2007-01-09 Listed $69,500 Smart MLS
- 2006-09-13 Listed $23,500 Smart MLS
- 2006-07-13 Sold (MLS) $5,500 Smart MLS
- 2006-04-17 Listed $10,500 Smart MLS
- 2006-02-08 Sold (MLS) $20,000 Smart MLS
- 2006-01-20 Listed $20,500 Smart MLS
- 2002-12-17 Sold (MLS) $8,500 Smart MLS
- 2002-10-01 Sold (MLS) $12,500 Smart MLS
- 2002-07-22 Listed $10,500 Smart MLS
- 2002-06-01 Sold (MLS) $21,500 Smart MLS
- 2002-04-22 Listed $23,000 Smart MLS
- 2002-03-20 Sold (MLS) $35,000 Smart MLS
- 2002-01-18 Listed $16,000 Smart MLS
- 2001-05-25 Sold (MLS) $23,000 Smart MLS
- 2001-03-13 Listed $26,500 Smart MLS
- 2001-01-19 Listed $24,900 Smart MLS
Property tax history
+0.8%/yrLatest (2014): $375 · +2.5% YoY. Source: county tax records.
Cash-flow waterfall
monthlySold comps — $/sqft
last 12 mo · ≤1 miLoading sold comps…