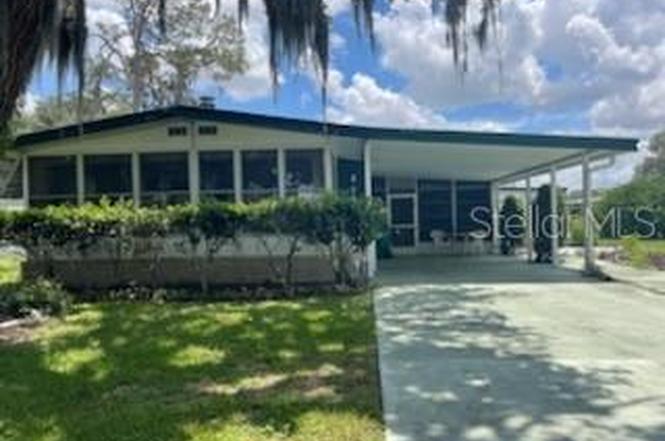
74 N Bobwhite Rd · Wildwood, FL
Flood risk 1/10 · Minimal
- FEMA flood zone
- X (unshaded)
- Chance of flooding over 30 yrs
- 0.0%
- Est. flood insurance / yr
- $507 – $1,088
Fire risk 4/10 · Minor
- Est. fire insurance / yr
- $947 – $1,759
Heat risk 8/10 · Major
- Hot days now (above 108°F)
- 7 days/yr
- Hot days in 30 yrs
- 21 days/yr
Wind risk 9/10 · Severe
- Chance of severe wind over 30 yrs
- 99.0%
Air-quality risk 2/10 · Minimal
- Unhealthy air days now
- 1 days/yr
- Unhealthy air days in 30 yrs
- 2 days/yr
Risk factors via First Street. Map © Google.
Why this score? — see what drove the B grade
The composite is a weighted blend of 9 inputs, each scored 0–100. Each bar is that input's sub-score; the figure is the points it added to the 100-point composite (weight × sub-score).
- Cash flow +24.9/30.0
- ARV discount +14.5/15.0
- 1% rule +9.9/10.0
- DSCR +8.1/10.0
- Schools +5.2/10.0
- Livability +3.5/5.0
- Rent growth +3.2/5.0
- Condition / age +2.5/5.0
- Appreciation +0.0/10.0
$109,900
🖨 Deal sheet (PDF) 📄 Offer letter ✓ Due diligence
Listing remarks
Time to make an offer, been on market too long, seller wants sold. Spacious property with much to offer, such as the burnable fireplace. Partly furnished allows you to move forward and start living the Florida lifestyle of enjoyment. So much to do in our community, activities galore if you want to attend or just relax pool side, if your the energizer bunny, we have a bunch that live here and its hard to keep up. The rooms are larger with large additional space on side which includes screened Florida room with workshop, laundry area and large area for 2 golf carts, one is included but needs new batteries. The yard is landscaped so you can enjoy the tropical setting. Short distance to golf co
Key facts
- Partly furnished
- Burnable fireplace
- Landscaped yard
Tags
Property features AI
Finance
- Other: Partially furnished; Lot approx. 0.19 acres (90 x 117 x 90 x 92), paved/asphalt road access; Living area listed as 1,152 (public records); building area total estimated at 2,527; Direction faces north; Property type: Residential mobile home
- Financial info: Total annual fees: $4,337.04; Lease restrictions apply
- HOA & community: Has HOA with monthly fee of $361.42 (includes cable TV, pool, internet, grounds maintenance, management, recreational facilities, trash); Association approval required; Association amenities: clubhouse, fitness center, golf course, pool, tennis, pickleball, shuffleboard, basketball court, park, storage, dog park, sidewalks, street lights, wheelchair access, handicap modified facilities, other; Senior community; Pets allowed (cats and dogs)
Exterior
- Parking: Carport with 2 spaces
- Utilities: Public water; Public sewer; Electricity connected; Cable available; Water connected; Sewer connected
- Home design: Residential mobile home (double wide); One story; Faces north
- Construction: Metal siding; Metal roof; Crawlspace foundation
- Exterior features: Awnings; Exterior lighting; Rain gutters; Sidewalk; Exterior storage; Other exterior features
Interior
- Kitchen: Dishwasher; Range; Microwave; Electric water heater
- Bedrooms: 2 bedrooms
- Flooring: Carpet; Laminate; Vinyl
- Bathrooms: 2 full bathrooms
- Heating & cooling: Central heating (electric); Central air conditioning
- Interior features: Open floorplan with living room/dining room combo; Thermostat; Walk-in closets; Fireplace (other style)
- Laundry & utility: Washer; Dryer; Outdoor laundry
Neighborhood map
What this means for you Summary
Snapshot
- This is a 2-bed/2.0-bath manufactured listed at $110k.
Deal economics
- At list price, monthly cash flow is $237 ($3k/yr) — positive.
- The deal already cash-flows at list — no discount required.
- Meets the 1% rule at list price ($2k rent vs $110k).
- Recommended offer: $97k (12.0% below list) — sets the bar for market timing.
- Cap rate 8.9% vs local median 3.9% in Wildwood — top-decile yield for the area; either an underpriced asset or a hidden risk that comps aren't pricing in. Stress-test before assuming the spread holds.
Location & tenants
- Location reads 69/100 on livability (#471 in FL) — a middle-class / working-renter tenant base. Strengths: health & safety A+, cost of living A, crime A-; Watch: schools C-, amenities F, commute F.
- Sumter (rural): math 61% / reading 61% proficiency, ranked #11 of 73 in FL (top 15%) — acceptable for families but not a draw, mixed tenant base, ~2y average lease.
- Market conditions: Rents rising (+2.9%/yr); 422 active listings in the ZIP; 3 comparable units currently listed for rent nearby; rentals at typical pace (median 22d on market — plan ~3-4 weeks tenant-placement turnaround); 3,961 units permitted in Sumter County in 2024 (248 in 5+ unit buildings).
Forward outlook
- Local home prices are declining (-3.0%/yr); year-one equity from $760 of loan paydown is wiped out by about $3k of value loss. Plan a longer hold.
- Sumter County population projected at +45% by 2050 — long-run rental-demand tailwind backs the buy-and-hold thesis.
Negotiation context
- It's been on market 316 days — a 12% lower offer ($97k) is reasonable based on typical stale-listing flexibility.
- 2 sale attempts; this cycle's ask has dropped $18k (14%) from the opening price — seller is motivated, your offer sets the floor, not the list.
- Current owner paid $38k; list at $110k implies a 189% gain — meaningful room to come down on a strong offer.
Risks & watch-outs
- Watch-outs: HOA is 22% of rent.
- Climate carrying-cost: severe wind risk, 99% chance of damaging wind over 30y; extreme-heat days projected 7→21/yr by 2055 (HVAC capex compounding) — expect insurance premiums to compound above CPI over the hold.
Questions for the listing agent
- It's been on market 316 days. Have you received any prior offers? Is the seller open to a 12% concession, seller financing, or rate buy-down credit?
- Built in 1976 — when were the roof, HVAC, electrical panel, plumbing, and water heater last replaced?
- What does the HOA fee cover, when was the last increase, and are there any pending special assessments or reserve-fund shortfalls?
- Why hasn't it sold? Are there any deal-killer items the seller is aware of (foundation, flood, title, zoning, code violations)?
- Is there a deadline driving the sale (1031 exchange, divorce, estate, relocation)? That informs how much negotiation room exists.
- What's the average days-on-market for RENTAL listings here right now (not sales)? A rising rental-DOM trend means longer vacancies and softer asking-rent achievability than the comps imply.
- What's the recent tenant-quality profile in this submarket — average credit score on applications, eviction rate, late-payment / NSF rate, and stable-employment percentage? A property-management company in the area should have these aggregated.
- How much new for-sale + rental construction is in the pipeline within 1–3 miles? Heavy new supply typically softens prices + rents 12–24 months out; constrained supply supports both.
Investment metrics
- 1% rule
- 1.49% ✓
- Cap rate
- 8.88%
- Cash-on-cash
- 9.25%
- DSCR
- 1.41
- GRM
- 5.6
CMA / ARV
- ARV (on-the-fly)
- $130,176
- Comps found
- 12
Show comp detail 12 sales within ~0.75 mi
| Address | Dist | Beds/Ba | Sqft | Sold | Price | $/sf | Match |
|---|---|---|---|---|---|---|---|
| 11 S Bobwhite Rd | 0.20mi | 2/2.0 | 1,152 (0%) | 1mo | $165,000 | $143 | 90 |
| 14 Golfview Trl | 0.40mi | 2/2.0 | 1,152 (0%) | 2mo | $140,000 | $122 | 79 |
| 22 Big Oak Ln | 0.39mi | 2/2.0 | 1,144 (-1%) | 5mo | $152,000 | $133 | 76 |
| 8 S Bobwhite | 0.23mi | 2/2.0 | 1,248 (+8%) | 2mo | $123,450 | $99 | 74 |
| 110 Forest Blvd | 0.29mi | 2/2.0 | 1,056 (-8%) | 3mo | $220,000 | $208 | 70 |
| 111 Sugar Maple Ave | 0.62mi | 2/2.0 | 1,152 (0%) | 2mo | $125,000 | $109 | 70 |
| 103 Robin Ln | 0.68mi | 2/2.0 | 1,152 (0%) | 3mo | $59,000 | $51 | 65 |
| 108 Winterberry Ave | 0.61mi | 2/2.0 | 1,040 (-10%) | 1mo | $70,000 | $67 | 54 |
| 17 Seminole Path | 0.54mi | 2/2.0 | 1,296 (+12%) | 0mo | $162,000 | $125 | 53 |
| 102 Robin Ln | 0.71mi | 2/2.0 | 1,040 (-10%) | 4mo | $117,500 | $113 | 48 |
| 116 Cypress Rd | 0.72mi | 2/2.0 | 1,040 (-10%) | 5mo | $47,000 | $45 | 46 |
| 600 Oak Blvd | 0.67mi | 2/2.0 | 1,288 (+12%) | 5mo | $140,000 | $109 | 45 |
Match score weights: distance 35% · size 25% · config 20% · recency 20%. Top-matched comps best support the ARV.
Projected returns pro-forma
-3.0% appreciation · 2.85% rent growth · sell at horizon
- IRR
- -2.4%
- Equity multiple
- 0.91×
- Total profit
- $-2,741
- Equity at exit
- $16,386
- IRR
- 7.3%
- Equity multiple
- 1.55×
- Total profit
- $16,901
- Equity at exit
- $9,502
Cash invested: $30,772 (down + closing). Projections, not guarantees.
Landlord ↔ Tenant lean methodology
- Overall (STATE)
- 87 Strongly Landlord-Friendly
- State Florida
- 87 Strongly Landlord-Friendly · R+3
- County
- — inherits STATE
- City
- — inherits STATE
ZIP-level market 34785
- Home prices YoY
- -10.7%
- Rents YoY
- 2.9%
- Active inventory
- 422
- Price-to-rent
- 5.6×
Monthly cashflow live
- Estimated rent
- $1,640 medium interval (Pro) →
- Mortgage (P&I)
- −$576
- Tax from tax record
- −$75 /mo · $905/yr
- Insurance
- −$46
- HOA
- −$361
- Vacancy / Maint / Mgmt
- −$344
- Net cashflow
- $237
Break-even live
Sensitivity live
| Price | -10% $299 | -5% $268 | +0% $237 | +5% $206 | +10% $175 |
|---|---|---|---|---|---|
| Rent | -10% $108 | -5% $172 | +0% $237 | +5% $302 | +10% $367 |
| Rate | -1.0pp $293 | -0.5pp $265 | base $237 | +0.5pp $209 | +1.0pp $180 |
UW: 25.0% down · 7.5% · 30yr · 1.5% tax · 5.0% vac · 8.0% maint · 8.0% mgmt
Financing live
Cash to close
- Down payment
- $27,475
- Closing costs
- $3,297
- Reserves months
- —
- Total cash needed
- —
Loan-product check · same deal, 3 products live
Conventional
25% down · 7.5% · 30yr
- Down + closing
- —
- Monthly P&I
- —
- Monthly cashflow
- —
- DSCR
- —
- Eligible?
- —
Personal DTI + credit; lowest rate.
DSCR
20% down · 8.5% · 30yr
- Down + closing
- —
- Monthly P&I
- —
- Monthly cashflow
- —
- DSCR
- —
- Eligible?
- —
No personal income docs; deal must DSCR.
Hard money
10% down · 12.0% · 12mo
- Down + closing
- —
- Monthly P&I
- —
- Monthly cashflow
- —
- DSCR
- —
- Eligible?
- —
Short-term bridge; refi at stabilization.
Rent comps 3 comps
| Address | Beds | Baths | Sqft | Rent | $/sqft | DOM | Units | Dist |
|---|---|---|---|---|---|---|---|---|
| 15203 Sandalwood Dr #203 Wildwood, FL | 3.0 | 3.0 | 1474 | $1,550 | $1.05 | 22d | 1 | 0.48mi |
| 21204 Sandalwood Dr Unit 21-204 Wildwood, FL | 2.0 | 2.0 | 1110 | $1,550 | $1.40 | 22d | 1 | 0.58mi |
| 5541 Goodman Ct The Villages, FL | 2.0 | 2.0 | 1203 | $1,990 | $1.65 | 22d | 1 | 1.28mi |
HOA detail
- Monthly dues
- $361 · $4,332/yr
- Likely covers
- pool
Listing history 22 events
-
2026-06-19days on market $109,900 Active 316 DOM
-
2026-06-18days on market $109,900 Active 315 DOM
-
2026-06-17days on market $109,900 Active 314 DOM
-
2026-06-16days on market $109,900 Active 313 DOM
-
2026-06-15days on market $109,900 Active 312 DOM
-
2026-06-14days on market $109,900 Active 310 DOM
-
2026-06-13pricedays on market $109,900 Active 309 DOM
-
2026-06-10days on market $126,000 Active 307 DOM
-
2026-06-09days on market $126,000 Active 306 DOM
-
2026-06-08days on market $126,000 Active 305 DOM
-
2026-06-07days on market $126,000 Active 304 DOM
-
2026-06-02days on market $126,000 Active 299 DOM
-
2026-06-01days on market $126,000 Active 298 DOM
-
2026-05-31days on market $126,000 Active 297 DOM
-
2026-05-30days on market $126,000 Active 296 DOM
-
2026-02-05status Active
-
2026-01-24historical
-
2025-11-27price $126,000
-
2025-07-24$127,500 Active
-
1997-07-01soldstatus $38,000
-
1985-04-01soldstatus $60,000
-
1977-07-01soldstatus $8,000
ⓘ Source: listings_history table (triggers on properties + properties_extension) + one-shot
backfill from property_details.listing_events for pre-trigger history.
Tax reassessment forecast FL · Resets to sale price
- Current annual tax
- $905 · $75/mo
- Projected year-2 tax
- $912 · $76/mo
- Expected delta
- +$8/yr (+$1/mo · 0.8%)
ⓘ Screening estimate from a state-policy table — verify with the county assessor before closing.
Climate risk First Street
- Flood 1/10 Low FEMA zone X (unshaded) · 0% chance over 30 yrs
- Wildfire 4/10 Moderate
- Heat 8/10 Severe 7 d/yr ≥108°F today · 21 d/yr by 30 yrs out
- Wind 9/10 Extreme 99% chance of damaging wind over 30 yrs
- Air quality 2/10 Low 1 unhealthy d/yr today · 2 by 30 yrs out
Nearby sold comps map
Loading sold comps map…
Walkable amenities ~0.75 mi
Loading nearby amenities…
Taxation est. · year 1
- Rental income
- $19,681
- − Mortgage interest
- −$6,156
- − Property taxes
- −$905
- − Insurance
- −$550
- − Repairs & maintenance
- −$1,574
- − Management
- −$1,574
- − HOA
- −$4,332
- − Depreciation
- −$3,197
- Taxable income
- $1,393
- Est. tax owed @ 24.0%
- −$334
- After-tax cash flow
- $2,512/yr
For passive investors: Depreciation is non-cash, so a rental often shows a tax loss while cash-flowing — sheltering income. Rental losses are passive: they offset passive income freely, and up to $25,000/yr can offset ordinary (W-2) income if you actively participate and your MAGI is under $100k (phasing out to $0 by $150k); unused losses carry forward. On sale, claimed depreciation is recaptured at up to 25%, and gains may owe capital-gains tax (a 1031 exchange can defer both). Figures are a year-1 estimate at your 24.0% rate — not tax advice; consult a CPA.
Schools (NCES district)
- District
- Sumter
- NCES district ID
- 1201800
- Math proficiency
- 61% ▼ -4.00%
- Reading proficiency
- 61% ▼ -2.00%
- Median HH income
- $48,240
- Composite
- 51.74/100
- National rank
- #1682
- State rank
- #11 of 73 in FL
Livability — Wildwood
- Score
- 69/100
- State rank
- #471
- US rank
- #8500
Category grades
Schools grade is shown separately in the Schools card above.
Census & demographics
- County
- Sumter County · 110,591 people
- City population
- 21,568
- Metro
- The Villages, FL
- Population (ZIP)
- 21,568
- Household income
- $66,136
- Rent vs Own
- Severe rent burden
- 730.0
Population outlook (Sumter County) Hauer SSP2
- Today (2025)
- 161,172 people
- By 2030
- 180,083 · +11.7%
- By 2040
- 209,892 · +30.2%
- By 2050
- 234,186 · +45.3%
- By 2075
- 284,602 · +76.6%
- By 2100
- 317,039 · +96.7%
Race, ethnicity, and origin ACS 2023
- Neighborhood character
- Diverse neighborhood (Simpson 0.62)
- Race & ethnicity
- White 52% Black 29% Hispanic / Latino 14% Two or more races 3%
- Hispanic origin (detail)
- Mexican 4% Puerto Rican 2%
- Common ancestry
- Romanian 3% Lithuanian 2% Italian 2%
- Foreign-born
- 11% · Canada, Jamaica
- Languages at home
- 85% English-only · Spanish 12% Other Indo-European 1% French/Haitian/Cajun 1%
Political lean MEDSL · Sumter
- 2024 margin
- Solid R (+37.6) · D 30.9% · R 68.6%
- 2008→2024 swing
- -10.6pp toward R · 2008: -27.0pp · 2024: -37.6pp
- All cycles
- 2024: R+37.6 2020: R+36.1 2016: R+39.2 2012: R+34.9 2008: R+27.0
Not yet ingested
- Civics
- —
Market trends
- HPI YoY
- ▼ -32.14%
- Current HPI
- 267.9137
- Rent YoY
- ▲ 2.85%
- Metro
- The Villages, FL
- State GDP YoY
- ▲ 3.28%
- F500 in state
- 36
Industry mix (Fortune 500 HQ in FL)
| Industry | F500 HQs | Revenue |
|---|---|---|
| Industrial Technology | 2 | $29B |
|
||
| Insurance | 2 | $17B |
|
||
| Retail | 1 | $60B |
|
||
| Technology Distribution | 1 | $58B |
|
||
| Homebuilding | 1 | $35B |
|
||
| Technology Manufacturing | 1 | $35B |
|
||
Price history
+1475.0% since first listed7 events — show timeline
- 2026-02-05 Relisted — Stellar MLS as Distributed by MLS Grid
- 2026-01-24 Listing Removed — Stellar MLS as Distributed by MLS Grid
- 2025-11-27 Price Changed $126,000 Stellar MLS as Distributed by MLS Grid
- 2025-07-24 Listed $127,500 Stellar MLS as Distributed by MLS Grid
- 1997-07-01 Sold (Public Records) $38,000 Public Records
- 1985-04-01 Sold (Public Records) $60,000 Public Records
- 1977-07-01 Sold (Public Records) $8,000 Public Records
Property tax history
+3.0%/yrLatest (2025): $905 · -0.8% YoY. Source: county tax records.
Cash-flow waterfall
monthlySold comps — $/sqft
last 12 mo · ≤1 miLoading sold comps…