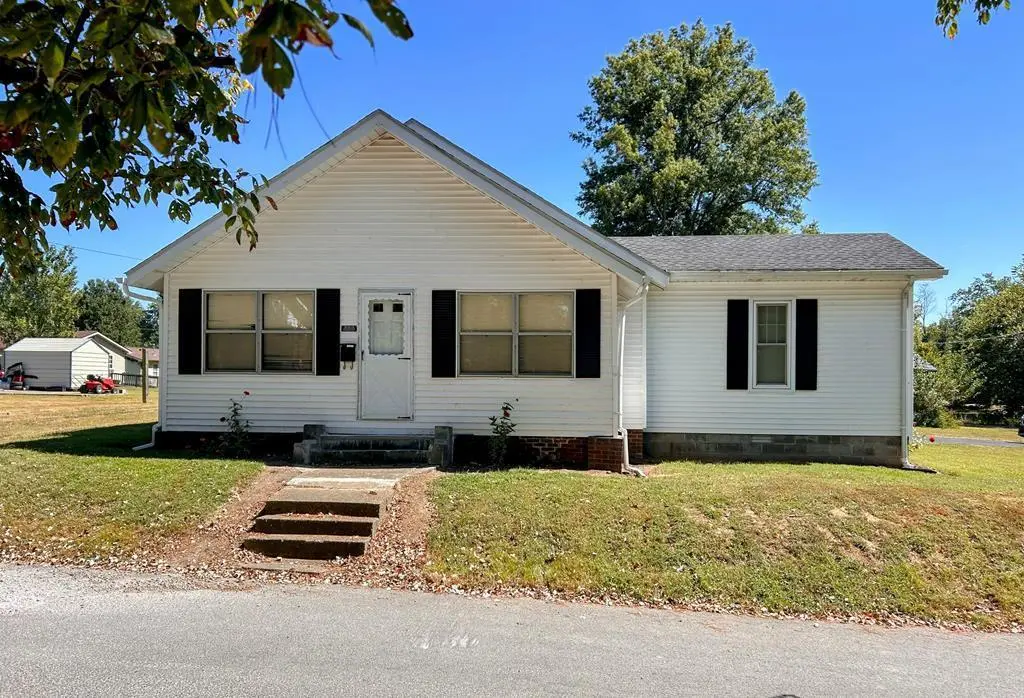
700 Church St · Providence, KY
Flood risk 1/10 · Minimal
- FEMA flood zone
- X (unshaded)
- Chance of flooding over 30 yrs
- 0.0%
- Est. flood insurance / yr
- $507 – $1,088
Fire risk 4/10 · Minor
- Est. fire insurance / yr
- $839 – $1,559
Heat risk 5/10 · Moderate
- Hot days now (above 109°F)
- 7 days/yr
- Hot days in 30 yrs
- 19 days/yr
Wind risk 3/10 · Minor
- Chance of severe wind over 30 yrs
- 5.0%
Air-quality risk 2/10 · Minimal
- Unhealthy air days now
- 1 days/yr
- Unhealthy air days in 30 yrs
- 1 days/yr
Risk factors via First Street. Map © Google.
Why this score? — see what drove the C+ grade
The composite is a weighted blend of 9 inputs, each scored 0–100. Each bar is that input's sub-score; the figure is the points it added to the 100-point composite (weight × sub-score).
- Cash flow +27.1/30.0
- DSCR +9.4/10.0
- Appreciation +7.7/10.0
- 1% rule +6.0/10.0
- Livability +3.1/5.0
- Rent growth +2.5/5.0
- Schools +2.5/10.0
- Condition / age +2.5/5.0
- ARV discount +0.0/15.0
$87,000
🖨 Deal sheet 📄 Offer letter ✓ Due diligence
Listing remarks MLS
This home is located on an oversized lot, located conveniently in the heart of Providence offering over 1,000 square feet in living space with an additional screened in porch on the front. Freshly cleaned carpets and fresh paint throughout has refreshed the whole home. The home also has a great, one car attached carport, keeping you and your vehicle protected from the elements. This is a must-see home! Contact Amber Goff at 270-871-3179 for more info or to schedule a showing!
Key facts
- 0.28 acre lot
- Garage
- Listed 50 days
Property features AI
Exterior
- Parking: Attached 1-car garage
- Utilities: Public water; Public sewer
- Home design: Single-family residence; Residential property
- Construction: Vinyl siding; Composition roof
- Exterior features: Deck; Outbuilding; Corner lot
Interior
- Kitchen: Range; Gas Range; Refrigerator
- Bedrooms: 2 bedrooms on the main level
- Bathrooms: 1 full bathroom (main level)
- Heating & cooling: Forced air heating (natural gas); Central air; Ceiling fans
- Interior features: Range; Gas Range; Refrigerator; Gas Water Heater
- Laundry & utility: Washer; Dryer; Laundry on the main level
Neighborhood map
What this means for you Summary
Snapshot
- This is a 2-bed/1.0-bath other listed at $87k.
Deal economics
- At list price, monthly cash flow is $247 ($3k/yr) — positive.
- The deal already cash-flows at list — no discount required.
- Meets the 1% rule at list price ($958 rent vs $87k).
- Recommended offer: $84k (3.0% below list) — sets the bar for market timing.
Location & tenants
- Location reads 62/100 on livability (#352 in KY) — a middle-class / working-renter tenant base. Strengths: crime A+, cost of living A+, housing A; Watch: schools D-, amenities F, commute F.
- Webster County (rural): math 25% / reading 34% proficiency, ranked #114 of 165 in KY (top 69%) — low school quality limits family demand, transient renter base, plan for 1-2y turnover.
- Market conditions: 21 active listings in the ZIP; 6 units permitted in Webster County in 2024 (0 in 5+ unit buildings).
Forward outlook
- In year one you build about $5k of equity ($601 loan paydown + $5k appreciation (5.4% local appreciation)).
- Webster County population projected at -14% by 2050 — secular population decline; favor cash flow + early exit over multi-decade hold.
- At projected returns (5.4% appreciation + 3.0% rent growth), your $24k cash investment doubles in ~3 years — after that, you're playing with house money.
- By year 7, paydown + projected appreciation supports a ~$34k cash-out refi (75% LTV) — recoverable capital for the next deal without selling this one.
Negotiation context
- It's been on market 50 days — a 3% lower offer ($84k) is reasonable based on typical stale-listing flexibility.
- 4 sale attempts since 2y ago; this cycle's ask has dropped $8k (8%) from the opening price — seller is motivated, your offer sets the floor, not the list.
- Current owner paid $75k; 16% above their basis — modest negotiation headroom, anchor on the comps not their cost.
Risks & watch-outs
- Climate carrying-cost: extreme-heat days projected 7→19/yr by 2055 (HVAC capex compounding) — expect insurance premiums to compound above CPI over the hold.
Questions for the listing agent
- It's been on market 50 days. Have you received any prior offers? Is the seller open to a 3% concession, seller financing, or rate buy-down credit?
- Is there a deadline driving the sale (1031 exchange, divorce, estate, relocation)? That informs how much negotiation room exists.
- Schools are D-rated, which usually means shorter tenancies and higher turnover. Who's the typical renter profile here, and what's been the actual vacancy rate?
- What's the average days-on-market for RENTAL listings here right now (not sales)? A rising rental-DOM trend means longer vacancies and softer asking-rent achievability than the comps imply.
- What's the recent tenant-quality profile in this submarket — average credit score on applications, eviction rate, late-payment / NSF rate, and stable-employment percentage? A property-management company in the area should have these aggregated.
- How much new for-sale + rental construction is in the pipeline within 1–3 miles? Heavy new supply typically softens prices + rents 12–24 months out; constrained supply supports both.
Investment metrics
- 1% rule
- 1.10% ✓
- Cap rate
- 9.70%
- Cash-on-cash
- 12.17%
- DSCR
- 1.54
- GRM
- 7.6
CMA / ARV
- ARV (median comp)
- $71,067
- List price
- $87,000
- Delta
- 22.42%
- Verdict
- OVERPRICED
- Comps
- 20 within 1.0 mi
Projected returns pro-forma
5.4% appreciation · 3.0% rent growth · sell at horizon
- IRR
- 24.2%
- Equity multiple
- 2.55×
- Total profit
- $37,736
- Equity at exit
- $51,417
- IRR
- 23.2%
- Equity multiple
- 5.09×
- Total profit
- $99,522
- Equity at exit
- $90,539
Cash invested: $24,360 (down + closing). Projections, not guarantees.
Landlord ↔ Tenant lean methodology
- Overall (STATE)
- 83 Strongly Landlord-Friendly
- State Kentucky
- 83 Strongly Landlord-Friendly · R+16
- County
- — inherits STATE
- City
- — inherits STATE
ZIP-level market 42450
- Home prices YoY
- 2.3%
- Active inventory
- 21
- Price-to-rent
- 7.6×
Monthly cashflow live
- Estimated rent
- $958 medium interval (Pro) →
- Mortgage (P&I)
- −$456
- Tax from tax record
- −$17 /mo · $209/yr
- Insurance
- −$36
- HOA
- −$0
- Vacancy / Maint / Mgmt
- −$201
- Net cashflow
- $247
Break-even live
UW: 25.0% down · 7.5% · 30yr · 1.5% tax · 5.0% vac · 8.0% maint · 8.0% mgmt
Financing live
Cash to close
- Down payment
- $21,750
- Closing costs
- $2,610
- Reserves months
- —
- Total cash needed
- —
Loan-product check · same deal, 3 products live
Conventional
25% down · 7.5% · 30yr
- Down + closing
- —
- Monthly P&I
- —
- Monthly cashflow
- —
- DSCR
- —
- Eligible?
- —
Personal DTI + credit; lowest rate.
DSCR
20% down · 8.5% · 30yr
- Down + closing
- —
- Monthly P&I
- —
- Monthly cashflow
- —
- DSCR
- —
- Eligible?
- —
No personal income docs; deal must DSCR.
Hard money
10% down · 12.0% · 12mo
- Down + closing
- —
- Monthly P&I
- —
- Monthly cashflow
- —
- DSCR
- —
- Eligible?
- —
Short-term bridge; refi at stabilization.
Listing history 25 events
-
2026-06-18days on market $87,000 Active 50 DOM
-
2026-06-17days on market $87,000 Active 49 DOM
-
2026-06-17price $87,000 Active 48 DOM
-
2026-06-16days on market $89,900 Active 48 DOM
-
2026-06-15days on market $89,900 Active 47 DOM
-
2026-06-13days on market $89,900 Active 45 DOM
-
2026-06-12days on market $89,900 Active 44 DOM
-
2026-06-09days on market $89,900 Active 41 DOM
-
2026-06-08days on market $89,900 Active 40 DOM
-
2026-06-07days on market $89,900 Active 39 DOM
-
2026-06-07days on market $89,900 Active 38 DOM
-
2026-06-04days on market $89,900 Active 35 DOM
-
2026-06-02days on market $89,900 Active 34 DOM
-
2026-06-01days on market $89,900 Active 33 DOM
-
2026-05-31days on market $89,900 Active 32 DOM
-
2026-05-31days on market $89,900 Active 31 DOM
-
2026-04-29$95,000 Active 199-char remark
-
2025-12-02status Active
-
2025-11-06status Pending
-
2025-09-30price $90,000
-
2025-09-09$94,900 Active
-
2025-01-13soldstatus $74,900
-
2025-01-06soldstatus $74,900 Closed
Show marketing remark (480 chars)
This home is located on an oversized lot, located conveniently in the heart of Providence offering over 1,000 square feet in living space with an additional screened in porch on the front. Freshly cleaned carpets and fresh paint throughout has refreshed the whole home. The home also has a great, one car attached carport, keeping you and your vehicle protected from the elements. This is a must-see home! Contact Amber Goff at 270-871-3179 for more info or to schedule a showing!
-
2024-11-22status Pending
Show marketing remark (480 chars)
This home is located on an oversized lot, located conveniently in the heart of Providence offering over 1,000 square feet in living space with an additional screened in porch on the front. Freshly cleaned carpets and fresh paint throughout has refreshed the whole home. The home also has a great, one car attached carport, keeping you and your vehicle protected from the elements. This is a must-see home! Contact Amber Goff at 270-871-3179 for more info or to schedule a showing!
-
2024-11-15$74,900 Active
Show marketing remark (480 chars)
This home is located on an oversized lot, located conveniently in the heart of Providence offering over 1,000 square feet in living space with an additional screened in porch on the front. Freshly cleaned carpets and fresh paint throughout has refreshed the whole home. The home also has a great, one car attached carport, keeping you and your vehicle protected from the elements. This is a must-see home! Contact Amber Goff at 270-871-3179 for more info or to schedule a showing!
ⓘ Source: listings_history table (triggers on properties + properties_extension) + one-shot
backfill from property_details.listing_events for pre-trigger history.
Tax reassessment forecast KY · Resets to sale price
- Current annual tax
- $209 · $17/mo
- Projected year-2 tax
- $748 · $62/mo
- Expected delta
- +$539/yr (+$45/mo · 257.2%)
ⓘ Screening estimate from a state-policy table — verify with the county assessor before closing.
Climate risk First Street
- Flood 1/10 Low FEMA zone X (unshaded) · 0% chance over 30 yrs
- Wildfire 4/10 Moderate
- Heat 5/10 Major 7 d/yr ≥109°F today · 19 d/yr by 30 yrs out
- Wind 3/10 Moderate 5% chance of damaging wind over 30 yrs
- Air quality 2/10 Low 1 unhealthy d/yr today · 1 by 30 yrs out
Nearby sold comps map
Loading sold comps map…
Walkable amenities ~0.75 mi
Loading nearby amenities…
Taxation est. · year 1
- Rental income
- $11,499
- − Mortgage interest
- −$4,873
- − Property taxes
- −$209
- − Insurance
- −$435
- − Repairs & maintenance
- −$920
- − Management
- −$920
- − Depreciation
- −$2,531
- Taxable income
- $1,611
- Est. tax owed @ 24.0%
- −$387
- After-tax cash flow
- $2,579/yr
For passive investors: Depreciation is non-cash, so a rental often shows a tax loss while cash-flowing — sheltering income. Rental losses are passive: they offset passive income freely, and up to $25,000/yr can offset ordinary (W-2) income if you actively participate and your MAGI is under $100k (phasing out to $0 by $150k); unused losses carry forward. On sale, claimed depreciation is recaptured at up to 25%, and gains may owe capital-gains tax (a 1031 exchange can defer both). Figures are a year-1 estimate at your 24.0% rate — not tax advice; consult a CPA.
Schools (NCES district)
- District
- Webster County
- NCES district ID
- 2105820
- Math proficiency
- 25% ▼ -17.00%
- Reading proficiency
- 34% ▼ -16.00%
- Median HH income
- $39,542
- Composite
- 24.76/100
- National rank
- #7600
- State rank
- #114 of 165 in KY
Livability — Providence
- Score
- 62/100
- State rank
- #352
- US rank
- #16669
Category grades
Schools grade is shown separately in the Schools card above.
Census & demographics
- Census place
- Providence, KY
- Population (ZIP)
- 3,589
Population outlook (Webster County) Hauer SSP2
- Today (2025)
- 12,548 people
- By 2030
- 12,119 · -3.4%
- By 2040
- 11,345 · -9.6%
- By 2050
- 10,761 · -14.2%
- By 2075
- 10,166 · -19.0%
- By 2100
- 10,546 · -16.0%
Race, ethnicity, and origin ACS 2023
- Neighborhood character
- Predominantly White (85%)
- Race & ethnicity
- White 85% Black 12% Two or more races 1%
- Common ancestry
- Italian 4% Iranian 1% Russian 1%
- Languages at home
- 99% English-only · Other Indo-European 1%
Political lean MEDSL · Webster
- 2024 margin
- Solid R (+57.4) · D 20.8% · R 78.1% · Other 1.1%
- 2008→2024 swing
- -45.7pp toward R · 2008: -11.7pp · 2024: -57.4pp
- All cycles
- 2024: R+57.4 2020: R+51.6 2016: R+54.4 2012: R+33.7 2008: R+11.7
Not yet ingested
- Civics
- —
Market trends
- HPI YoY
- ▲ 5.40%
- Current HPI
- 240.0686
- Rent YoY
- —
- Metro
- —
- State GDP YoY
- ▲ 1.81%
- F500 in state
- 4
Industry mix (Fortune 500 HQ in KY)
| Industry | F500 HQs | Revenue |
|---|---|---|
| Healthcare | 1 | $118B |
|
||
| Food / Beverage | 1 | $7B |
|
||
Price history
+16.2% since first listed11 events — show timeline
- 2026-06-16 Price Changed $87,000 MHCBOR
- 2026-05-19 Price Changed $89,900 MHCBOR
- 2026-04-29 Listed $95,000 MHCBOR
- 2025-12-02 Relisted — MHCBOR
- 2025-11-06 Pending — MHCBOR
- 2025-09-30 Price Changed $90,000 MHCBOR
- 2025-09-09 Listed $94,900 MHCBOR
- 2025-01-13 Sold (Public Records) $74,900 Public Records
- 2025-01-06 Sold (MLS) $74,900 MHCBOR
- 2024-11-22 Pending — MHCBOR
- 2024-11-15 Listed $74,900 MHCBOR
Property tax history
-5.3%/yrLatest (2025): $209 · +9.9% YoY. Source: county tax records.
Cash-flow waterfall
monthlySold comps — $/sqft
last 12 mo · ≤1 miLoading sold comps…