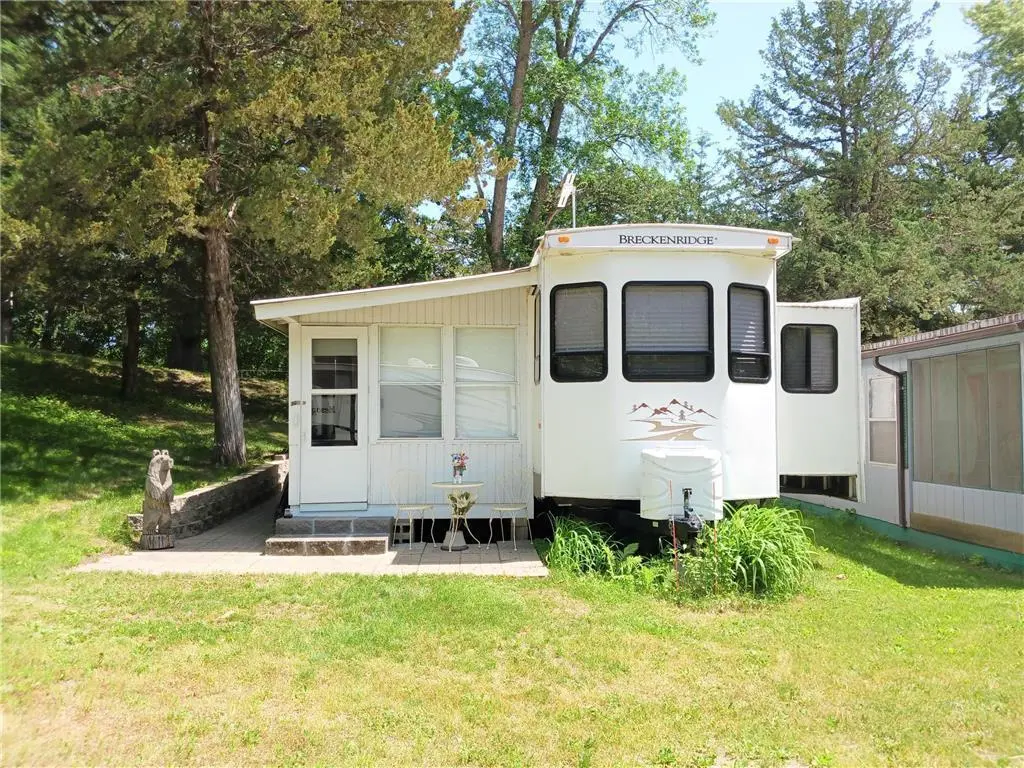
4808 132nd Ave NE #6 · New London, MN
Flood risk 1/10 · Minimal
- FEMA flood zone
- X (unshaded)
- Chance of flooding over 30 yrs
- 0.0%
- Est. flood insurance / yr
- $507 – $1,088
Fire risk 3/10 · Minor
- Est. fire insurance / yr
- $888 – $1,650
Heat risk 2/10 · Minimal
- Hot days now (above 99°F)
- 7 days/yr
- Hot days in 30 yrs
- 14 days/yr
Wind risk 2/10 · Minimal
- Chance of severe wind over 30 yrs
- —
Air-quality risk 3/10 · Minor
- Unhealthy air days now
- 2 days/yr
- Unhealthy air days in 30 yrs
- 2 days/yr
Risk factors via First Street. Map © Google.
Why this score? — see what drove the C- grade
The composite is a weighted blend of 9 inputs, each scored 0–100. Each bar is that input's sub-score; the figure is the points it added to the 100-point composite (weight × sub-score).
- Cash flow +15.1/30.0
- ARV discount +15.0/15.0
- 1% rule +6.5/10.0
- Schools +4.9/10.0
- DSCR +4.6/10.0
- Livability +3.6/5.0
- Rent growth +2.5/5.0
- Condition / age +2.5/5.0
- Appreciation +0.0/10.0
$67,000
🖨 Deal sheet 📄 Offer letter ✓ Due diligence
Listing remarks
Furnished 1 bedroom Park Model with Lake Access and Excellent Location on Corner Lot! So many great features! Come enjoy summer fun at the Lake in this fabulous Park Model where you can enjoy all the great amenities including: Kayaking, swimming, volleyball, pool table and a Boat Ramp! There is a Fish Cleaning Station for all those fishing trips and a community area residents can use to eat with their family too! The Park Model has a nice layout, gas stove for Cooking, Porch Area that includes a Pull-out Couch for guests and an outdoor screened in Gazebo area which is perfect for entertaining! Spend your Summer in Spicer where the Lakes are Nicer! This community takes care of the lawn care
Key facts
- 1,481 sq ft lot
- Built 2013
- Listed 45 days
Property features AI
Finance
- Other: Corner unit in Cedar Point Village (directions available)
- HOA & community: HOA with monthly fee ($125); Association amenities include beach access, dock, lawn care, parking, sewer, shared amenities and water; Association provides deeded/shared association access to waterfront (sand lake bottom) and an amusement/party room among shared rooms
Exterior
- Parking: Open parking
- Utilities: Shared water system; City sewer (connected); Propane fuel
- Home design: Residential property; One story; Main entry on main level
- Construction: Block foundation; Rubber roof; Built area with 459 above-grade finished square feet
- Exterior features: Vinyl exterior; Enclosed front porch; Corner lot
Interior
- Kitchen: Kitchen with cooktop; Refrigerator
- Bedrooms: One bedroom on the main level (approx. 9.4 x 9.8)
- Bathrooms: Main floor three-quarter bath
- Heating & cooling: Forced air heating; Central air conditioning
- Interior features: All living facilities on one level; Main floor bedroom; Enclosed front porch
- Laundry & utility: Has basement (no finished basement features listed)
Neighborhood map
What this means for you Summary
Snapshot
- This is a 1-bed/1.0-bath single-family listed at $67k.
Deal economics
- At list price, monthly cash flow is $22 ($266/yr) — positive.
- The deal already cash-flows at list — no discount required.
- Meets the 1% rule at list price ($772 rent vs $67k).
- Recommended offer: $65k (3.0% below list) — sets the bar for market timing.
- Cap rate 6.7% vs local median 1.7% in New London — top-decile yield for the area; either an underpriced asset or a hidden risk that comps aren't pricing in. Stress-test before assuming the spread holds.
Location & tenants
- Location reads 71/100 on livability (#309 in MN) — a middle-class / working-renter tenant base. Strengths: crime A+, cost of living A+, housing A+; Watch: health & safety D+, amenities F, commute F.
- New London-Spicer School District (town): math 55% / reading 58% proficiency, ranked #59 of 301 in MN (top 20%) — acceptable for families but not a draw, mixed tenant base, ~2y average lease; only 20% free/reduced lunch — higher-income household profile.
- Market conditions: 60 active listings in the ZIP; 196 units permitted in Kandiyohi County in 2024 (118 in 5+ unit buildings).
Forward outlook
- Local home prices are declining (-3.0%/yr); year-one equity from $463 of loan paydown is wiped out by about $2k of value loss. Plan a longer hold.
Negotiation context
- It's been on market 45 days — a 3% lower offer ($65k) is reasonable based on typical stale-listing flexibility.
- 5 sale attempts since 11y ago with the ask held roughly flat each time — persistent listings suggest the price (not the market) is what's stuck; bring a comps-based counter.
- Current owner paid $30k; list at $67k implies a 123% gain — meaningful room to come down on a strong offer.
Questions for the listing agent
- It's been on market 45 days. Have you received any prior offers? Is the seller open to a 3% concession, seller financing, or rate buy-down credit?
- What does the HOA fee cover, when was the last increase, and are there any pending special assessments or reserve-fund shortfalls?
- Is there a deadline driving the sale (1031 exchange, divorce, estate, relocation)? That informs how much negotiation room exists.
- Schools are A-rated — typically a magnet for longer-tenancy family renters. What's the average tenant stay here, and is there a school-zone premium baked into asking?
- What's the average days-on-market for RENTAL listings here right now (not sales)? A rising rental-DOM trend means longer vacancies and softer asking-rent achievability than the comps imply.
- What's the recent tenant-quality profile in this submarket — average credit score on applications, eviction rate, late-payment / NSF rate, and stable-employment percentage? A property-management company in the area should have these aggregated.
- How much new for-sale + rental construction is in the pipeline within 1–3 miles? Heavy new supply typically softens prices + rents 12–24 months out; constrained supply supports both.
Investment metrics
- 1% rule
- 1.15% ✓
- Cap rate
- 6.69%
- Cash-on-cash
- 1.42%
- DSCR
- 1.06
- GRM
- 7.2
CMA / ARV
- ARV (median comp)
- $130,694
- List price
- $67,000
- Delta
- -48.74%
- Verdict
- UNDERPRICED
- Comps
- 1 within 2.0 mi
Show comp detail 1 sale within ~0.75 mi
| Address | Dist | Beds/Ba | Sqft | Sold | Price | $/sf | Match |
|---|---|---|---|---|---|---|---|
| 4808 NE 132nd Ave | 0.06mi | 2/1.0 (+1) | 504 (+10%) | 12mo | $135,300 | $268 | 66 |
Match score weights: distance 35% · size 25% · config 20% · recency 20%. Top-matched comps best support the ARV.
Projected returns pro-forma
-3.0% appreciation · 3.0% rent growth · sell at horizon
- IRR
- -13.9%
- Equity multiple
- 0.50×
- Total profit
- $-9,355
- Equity at exit
- $9,990
- IRR
- -4.8%
- Equity multiple
- 0.68×
- Total profit
- $-5,967
- Equity at exit
- $5,793
Cash invested: $18,760 (down + closing). Projections, not guarantees.
Landlord ↔ Tenant lean methodology
- Overall (STATE)
- 46 Balanced
- State Minnesota
- 46 Balanced · D+2
- County
- — inherits STATE
- City
- — inherits STATE
ZIP-level market 56288
- Active inventory
- 60
- Price-to-rent
- 7.2×
Monthly cashflow live
- Estimated rent
- $772 medium interval (Pro) →
- Mortgage (P&I)
- −$351
- Tax est. 1.5%
- −$84 /mo · $1,005/yr
- Insurance
- −$28
- HOA
- −$125
- Vacancy / Maint / Mgmt
- −$162
- Net cashflow
- $22
Break-even live
UW: 25.0% down · 7.5% · 30yr · 1.5% tax · 5.0% vac · 8.0% maint · 8.0% mgmt
Financing live
Cash to close
- Down payment
- $16,750
- Closing costs
- $2,010
- Reserves months
- —
- Total cash needed
- —
Loan-product check · same deal, 3 products live
Conventional
25% down · 7.5% · 30yr
- Down + closing
- —
- Monthly P&I
- —
- Monthly cashflow
- —
- DSCR
- —
- Eligible?
- —
Personal DTI + credit; lowest rate.
DSCR
20% down · 8.5% · 30yr
- Down + closing
- —
- Monthly P&I
- —
- Monthly cashflow
- —
- DSCR
- —
- Eligible?
- —
No personal income docs; deal must DSCR.
Hard money
10% down · 12.0% · 12mo
- Down + closing
- —
- Monthly P&I
- —
- Monthly cashflow
- —
- DSCR
- —
- Eligible?
- —
Short-term bridge; refi at stabilization.
HOA detail
- Monthly dues
- $125 · $1,500/yr
- Likely covers
- gaslandscapingpool
Listing history 25 events
-
2026-06-18days on market $67,000 Active 45 DOM
-
2026-06-17days on market $67,000 Active 44 DOM
-
2026-06-16days on market $67,000 Active 43 DOM
-
2026-06-15days on market $67,000 Active 42 DOM
-
2026-06-13days on market $67,000 Active 40 DOM
-
2026-06-12days on market $67,000 Active 39 DOM
-
2026-06-09days on market $67,000 Active 36 DOM
-
2026-06-08days on market $67,000 Active 35 DOM
-
2026-06-07days on market $67,000 Active 34 DOM
-
2026-06-05days on market $67,000 Active 32 DOM
-
2026-06-04days on market $67,000 Active 30 DOM
-
2026-06-02days on market $67,000 Active 29 DOM
-
2026-06-01days on market $67,000 Active 28 DOM
-
2026-05-31days on market $67,000 Active 27 DOM
-
2026-05-31days on market $67,000 Active 26 DOM
-
2026-05-04$67,000 Active 782-char remark
-
2023-09-16historical
-
2023-06-06$74,700 Active
-
2022-09-25historical
-
2022-06-20$75,000 Active
-
2019-02-02historical
-
2019-02-02historical
-
2016-07-13soldstatus $30,000
-
2016-03-21$30,000
-
2015-06-25$42,500
ⓘ Source: listings_history table (triggers on properties + properties_extension) + one-shot
backfill from property_details.listing_events for pre-trigger history.
Climate risk First Street
- Flood 1/10 Low FEMA zone X (unshaded) · 0% chance over 30 yrs
- Wildfire 3/10 Moderate
- Heat 2/10 Low 7 d/yr ≥99°F today · 14 d/yr by 30 yrs out
- Wind 2/10 Low
- Air quality 3/10 Moderate 2 unhealthy d/yr today · 2 by 30 yrs out
Nearby sold comps map
Loading sold comps map…
Walkable amenities ~0.75 mi
Loading nearby amenities…
Taxation est. · year 1
- Rental income
- $9,269
- − Mortgage interest
- −$3,753
- − Property taxes
- −$1,005
- − Insurance
- −$335
- − Repairs & maintenance
- −$742
- − Management
- −$742
- − HOA
- −$1,500
- − Depreciation
- −$1,949
- Taxable loss
- −$756
- Est. tax savings @ 24.0%
- +$181
- After-tax cash flow
- $448/yr
For passive investors: Depreciation is non-cash, so a rental often shows a tax loss while cash-flowing — sheltering income. Rental losses are passive: they offset passive income freely, and up to $25,000/yr can offset ordinary (W-2) income if you actively participate and your MAGI is under $100k (phasing out to $0 by $150k); unused losses carry forward. On sale, claimed depreciation is recaptured at up to 25%, and gains may owe capital-gains tax (a 1031 exchange can defer both). Figures are a year-1 estimate at your 24.0% rate — not tax advice; consult a CPA.
Schools (NCES district)
- District
- New London-Spicer School District
- NCES district ID
- 2723400
- Math proficiency
- 55% ▼ -9.00%
- Reading proficiency
- 58% ▼ -11.00%
- Median HH income
- $62,142
- Composite
- 49.33/100
- National rank
- #2020
- State rank
- #59 of 301 in MN
Livability — New London
- Score
- 71/100
- State rank
- #309
- US rank
- #6805
Category grades
Schools grade is shown separately in the Schools card above.
Census & demographics
- Population (ZIP)
- 4,655
Population outlook (Kandiyohi County) Hauer SSP2
- Today (2025)
- 42,956 people
- By 2030
- 42,825 · -0.3%
- By 2040
- 42,343 · -1.4%
- By 2050
- 42,124 · -1.9%
- By 2075
- 43,726 · +1.8%
- By 2100
- 45,974 · +7.0%
Race, ethnicity, and origin ACS 2023
- Neighborhood character
- Predominantly White (93%)
- Race & ethnicity
- White 93% Two or more races 5% Hispanic / Latino 3%
- Common ancestry
- Portuguese 26% Iranian 3% Italian 2%
- Foreign-born
- 1% · Canada, Jamaica
- Languages at home
- 96% English-only · Spanish 2%
Political lean MEDSL · Kandiyohi
- 2024 margin
- Solid R (+31.0) · D 33.7% · R 64.7% · Other 1.7%
- 2008→2024 swing
- -25.6pp toward R · 2008: -5.5pp · 2024: -31.0pp
- All cycles
- 2024: R+31.0 2020: R+25.7 2016: R+25.5 2012: R+6.7 2008: R+5.5
Not yet ingested
- Civics
- —
Market trends
- HPI YoY
- ▼ -163.25%
- Current HPI
- 174.4674
- Rent YoY
- —
- Metro
- —
- State GDP YoY
- ▲ 2.41%
- F500 in state
- 34
Industry mix (Fortune 500 HQ in MN)
| Industry | F500 HQs | Revenue |
|---|---|---|
| Healthcare | 2 | $407B |
|
||
| Retail | 2 | $150B |
|
||
| Consumer Goods | 2 | $32B |
|
||
| Industrial Machinery | 2 | $6B |
|
||
| Agriculture | 1 | $40B |
|
||
| Healthcare / Medical Devices | 1 | $32B |
|
||
Price history
+57.6% since first listed10 events — show timeline
- 2026-05-04 Listed $67,000 NORTHSTARMLS as Distributed by MLS Grid
- 2023-09-16 Listing Removed — NORTHSTARMLS as Distributed by MLS Grid
- 2023-06-06 Listed $74,700 NORTHSTARMLS as Distributed by MLS Grid
- 2022-09-25 Listing Removed — NORTHSTARMLS as Distributed by MLS Grid
- 2022-06-20 Listed $75,000 NORTHSTARMLS as Distributed by MLS Grid
- 2019-02-02 Listing Removed — NORTHSTARMLS as Distributed by MLS Grid
- 2019-02-02 Listing Removed — NORTHSTARMLS as Distributed by MLS Grid
- 2016-07-13 Sold (MLS) $30,000 NORTHSTARMLS as Distributed by MLS Grid
- 2016-03-21 Listed $30,000 NORTHSTARMLS as Distributed by MLS Grid
- 2015-06-25 Listed $42,500 NORTHSTARMLS as Distributed by MLS Grid
Cash-flow waterfall
monthlySold comps — $/sqft
last 12 mo · ≤1 miLoading sold comps…