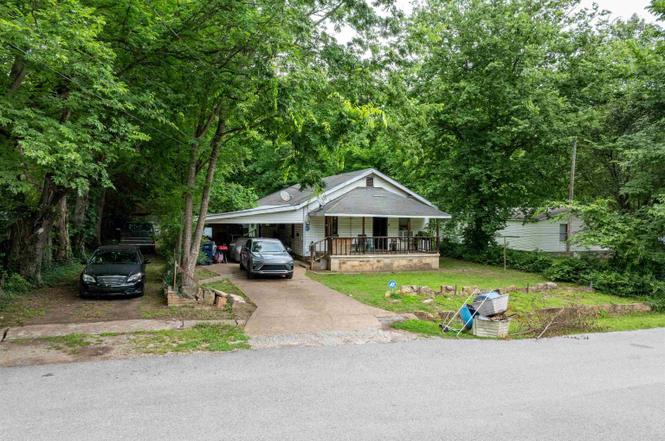
786 Elsie St · Batesville, AR
Flood risk 1/10 · Minimal
- FEMA flood zone
- X (unshaded)
- Chance of flooding over 30 yrs
- 0.0%
- Est. flood insurance / yr
- $473 – $860
Fire risk 4/10 · Minor
- Est. fire insurance / yr
- $1,499 – $2,785
Heat risk 5/10 · Moderate
- Hot days now (above 107°F)
- 7 days/yr
- Hot days in 30 yrs
- 19 days/yr
Wind risk 3/10 · Minor
- Chance of severe wind over 30 yrs
- 6.0%
Air-quality risk 2/10 · Minimal
- Unhealthy air days now
- 0 days/yr
- Unhealthy air days in 30 yrs
- 2 days/yr
Risk factors via First Street. Map © Google.
Why this score? — see what drove the B+ grade
The composite is a weighted blend of 9 inputs, each scored 0–100. Each bar is that input's sub-score; the figure is the points it added to the 100-point composite (weight × sub-score).
- Cash flow +30.0/30.0
- ARV discount +15.0/15.0
- DSCR +10.0/10.0
- 1% rule +8.7/10.0
- Livability +3.6/5.0
- Schools +3.1/10.0
- Rent growth +2.5/5.0
- Condition / age +2.5/5.0
- Appreciation +0.0/10.0
$90,000
🖨 Deal sheet (PDF) 📄 Offer letter ✓ Due diligence
Listing remarks
Looking for your next investment property or renovation project? Located at 786 Elsie Street in Batesville, Arkansas, this fixer-upper offers plenty of potential for investors, landlords, or buyers looking to add value through improvements. Currently operating as a rental property, this home provides an opportunity to generate income while making updates over time. With a functional layout and established utilities already in place, the property offers a solid foundation for your next project. Situated on a manageable lot within the city limits, you'll enjoy convenient access to schools, shopping, restaurants, medical facilities, and everything Batesville has to offer. Whether you're lookin
Key facts
- Manageable lot
- Convenient access
- Functional layout
Tags
Property features AI
Finance
- Other: Approximate building size 1,362; Approximate lot size 0.29 acres (source: tax records)
- Financial info: Cash and in-house financing available
Exterior
- Parking: Carport
- Utilities: Public sewer; Public water
- Home design: Single-family property (see remarks for details); Located in MAXFIELD WEST subdivision, Batesville, Independence County
- Construction: Other exterior features (see remarks); Other foundation type (see remarks); Other roof type (see remarks)
- Exterior features: Paved road access; Level lot in a subdivision
Interior
- Kitchen: Other kitchen equipment (see remarks)
- Flooring: Other flooring (see remarks)
- Bathrooms: 2 full bathrooms
- Heating & cooling: Other heating and cooling (see remarks)
- Interior features: Other interior features (see remarks)
Neighborhood map
What this means for you Summary
Snapshot
- This is a 3-bed/1.5-bath single-family listed at $90k.
Deal economics
- At list price, monthly cash flow is $426 ($5k/yr) — positive.
- The deal already cash-flows at list — no discount required.
- Meets the 1% rule at list price ($1k rent vs $90k).
- Cap rate 12.0% vs local median 4.3% in Batesville — top-decile yield for the area; either an underpriced asset or a hidden risk that comps aren't pricing in. Stress-test before assuming the spread holds.
Location & tenants
- Location reads 72/100 on livability (#33 in AR) — a middle-class / working-renter tenant base. Strengths: cost of living A+, housing A+, health & safety A+; Watch: employment C-, crime D+, schools D.
- Batesville School District (rural): math 36% / reading 38% proficiency, ranked #104 of 238 in AR (top 44%) — families likely to look elsewhere, expect single-tenant / working-renter base with shorter leases.
- Market conditions: 175 active listings in the ZIP; 1 comparable units currently listed for rent nearby; 33 units permitted in Independence County in 2024 (24 in 5+ unit buildings).
Forward outlook
- Local home prices are declining (-3.0%/yr); year-one equity from $622 of loan paydown is wiped out by about $3k of value loss. Plan a longer hold.
- At projected returns (-3.0% appreciation + 3.0% rent growth), your $25k cash investment doubles in ~6 years — after that, you're playing with house money.
Negotiation context
- Only 14 days on market — expect competitive offers; lowballing is unlikely to land.
Risks & watch-outs
- Climate carrying-cost: extreme-heat days projected 7→19/yr by 2055 (HVAC capex compounding) — expect insurance premiums to compound above CPI over the hold.
Questions for the listing agent
- Is there a deadline driving the sale (1031 exchange, divorce, estate, relocation)? That informs how much negotiation room exists.
- Schools are D-rated, which usually means shorter tenancies and higher turnover. Who's the typical renter profile here, and what's been the actual vacancy rate?
- Crime grade is D in this area — have there been break-ins, vandalism, or insurance claims at this property in the last 3 years? What carrier currently insures it and at what premium?
- What's the average days-on-market for RENTAL listings here right now (not sales)? A rising rental-DOM trend means longer vacancies and softer asking-rent achievability than the comps imply.
- What's the recent tenant-quality profile in this submarket — average credit score on applications, eviction rate, late-payment / NSF rate, and stable-employment percentage? A property-management company in the area should have these aggregated.
- How much new for-sale + rental construction is in the pipeline within 1–3 miles? Heavy new supply typically softens prices + rents 12–24 months out; constrained supply supports both.
Investment metrics
- 1% rule
- 1.37% ✓
- Cap rate
- 11.97%
- Cash-on-cash
- 20.29%
- DSCR
- 1.90
- GRM
- 6.1
CMA / ARV
- ARV (on-the-fly)
- $123,942
- Comps found
- 12
Show comp detail 12 sales within ~0.75 mi
| Address | Dist | Beds/Ba | Sqft | Sold | Price | $/sf | Match |
|---|---|---|---|---|---|---|---|
| 1250 Arch St | 0.49mi | 3/2.0 | 1,401 (+3%) | 10mo | $136,280 | $97 | 62 |
| 400 E Chestnut St | 0.49mi | 3/2.0 | 1,450 (+6%) | 10mo | $149,000 | $103 | 56 |
| 689 N Central Ave | 0.23mi | 3/1.0 | 1,506 (+11%) | 16mo | $49,500 | $33 | 56 |
| 245 E Carter St | 0.35mi | 3/2.0 | 1,281 (-6%) | 19mo | $127,600 | $100 | 56 |
| 1421 N State St | 0.42mi | 3/2.0 | 1,399 (+3%) | 22mo | $98,000 | $70 | 56 |
| 1409 Addie St | 0.43mi | 3/1.0 | 1,257 (-8%) | 13mo | $28,000 | $22 | 54 |
| 1679 Addie St | 0.60mi | 3/1.0 | 1,200 (-12%) | 0mo | $35,000 | $29 | 50 |
| 411 S Central Ave | 0.68mi | 2/1.0 (-1) | 1,449 (+6%) | 6mo | $132,500 | $91 | 46 |
| 355 Gregg | 0.57mi | 3/1.5 | 1,250 (-8%) | 20mo | $132,000 | $106 | 43 |
| 469 S Central Ave | 0.73mi | 2/1.0 (-1) | 1,506 (+11%) | 4mo | $55,000 | $37 | 38 |
| 470 Hawkins St | 0.74mi | 3/2.0 | 1,169 (-14%) | 6mo | $103,500 | $89 | 35 |
| 455 Blossom Dr | 0.63mi | 3/2.0 | 1,180 (-13%) | 16mo | $150,000 | $127 | 33 |
Match score weights: distance 35% · size 25% · config 20% · recency 20%. Top-matched comps best support the ARV.
Projected returns pro-forma
-3.0% appreciation · 3.0% rent growth · sell at horizon
- IRR
- 12.5%
- Equity multiple
- 1.50×
- Total profit
- $12,528
- Equity at exit
- $13,419
- IRR
- 21.4%
- Equity multiple
- 2.82×
- Total profit
- $45,740
- Equity at exit
- $7,782
Cash invested: $25,200 (down + closing). Projections, not guarantees.
Landlord ↔ Tenant lean methodology
- Overall (STATE)
- 92 Strongly Landlord-Friendly
- State Arkansas
- 92 Strongly Landlord-Friendly · R+14
- County
- — inherits STATE
- City
- — inherits STATE
ZIP-level market 72501
- Home prices YoY
- -16.3%
- Active inventory
- 175
- Price-to-rent
- 6.1×
Monthly cashflow live
- Estimated rent
- $1,229 medium interval (Pro) →
- Mortgage (P&I)
- −$472
- Tax from tax record
- −$35 /mo · $420/yr
- Insurance
- −$38
- HOA
- −$0
- Vacancy / Maint / Mgmt
- −$258
- Net cashflow
- $426
Break-even live
Sensitivity live
| Price | -10% $477 | -5% $452 | +0% $426 | +5% $401 | +10% $375 |
|---|---|---|---|---|---|
| Rent | -10% $329 | -5% $378 | +0% $426 | +5% $475 | +10% $523 |
| Rate | -1.0pp $471 | -0.5pp $449 | base $426 | +0.5pp $403 | +1.0pp $379 |
UW: 25.0% down · 7.5% · 30yr · 1.5% tax · 5.0% vac · 8.0% maint · 8.0% mgmt
Financing live
Cash to close
- Down payment
- $22,500
- Closing costs
- $2,700
- Reserves months
- —
- Total cash needed
- —
Loan-product check · same deal, 3 products live
Conventional
25% down · 7.5% · 30yr
- Down + closing
- —
- Monthly P&I
- —
- Monthly cashflow
- —
- DSCR
- —
- Eligible?
- —
Personal DTI + credit; lowest rate.
DSCR
20% down · 8.5% · 30yr
- Down + closing
- —
- Monthly P&I
- —
- Monthly cashflow
- —
- DSCR
- —
- Eligible?
- —
No personal income docs; deal must DSCR.
Hard money
10% down · 12.0% · 12mo
- Down + closing
- —
- Monthly P&I
- —
- Monthly cashflow
- —
- DSCR
- —
- Eligible?
- —
Short-term bridge; refi at stabilization.
Rent comps 1 comps
| Address | Beds | Baths | Sqft | Rent | $/sqft | DOM | Units | Dist |
|---|---|---|---|---|---|---|---|---|
| 151 W Main St Unit 4 Batesville, AR | 2.0 | 2.0 | 1000 | $1,300 | $1.30 | 44d | 1 | 0.45mi |
Listing history 11 events
-
2026-06-21days on market $90,000 Active 14 DOM
-
2026-06-19days on market $90,000 Active 12 DOM
-
2026-06-18days on market $90,000 Active 11 DOM
-
2026-06-17days on market $90,000 Active 10 DOM
-
2026-06-16days on market $90,000 Active 9 DOM
-
2026-06-15statusdays on market $90,000 Active 8 DOM
-
2026-06-14days on market $90,000 New Listing 6 DOM
-
2026-06-12days on market $90,000 New Listing 5 DOM
-
2026-06-09days on market $90,000 New Listing 2 DOM
-
2026-06-07remarks 699-char remark
-
2026-06-07$90,000 New Listing 1 DOM
ⓘ Source: listings_history table (triggers on properties + properties_extension) + one-shot
backfill from property_details.listing_events for pre-trigger history.
Tax reassessment forecast AR · Resets to sale price
- Current annual tax
- $420 · $35/mo
- Projected year-2 tax
- $576 · $48/mo
- Expected delta
- +$156/yr (+$13/mo · 37.1%)
ⓘ Screening estimate from a state-policy table — verify with the county assessor before closing.
Climate risk First Street
- Flood 1/10 Low FEMA zone X (unshaded) · 0% chance over 30 yrs
- Wildfire 4/10 Moderate
- Heat 5/10 Major 7 d/yr ≥107°F today · 19 d/yr by 30 yrs out
- Wind 3/10 Moderate 6% chance of damaging wind over 30 yrs
- Air quality 2/10 Low 0 unhealthy d/yr today · 2 by 30 yrs out
Nearby sold comps map
Loading sold comps map…
Walkable amenities ~0.75 mi
Loading nearby amenities…
Taxation est. · year 1
- Rental income
- $14,744
- − Mortgage interest
- −$5,041
- − Property taxes
- −$420
- − Insurance
- −$450
- − Repairs & maintenance
- −$1,179
- − Management
- −$1,179
- − Depreciation
- −$2,618
- Taxable income
- $3,855
- Est. tax owed @ 24.0%
- −$925
- After-tax cash flow
- $4,189/yr
For passive investors: Depreciation is non-cash, so a rental often shows a tax loss while cash-flowing — sheltering income. Rental losses are passive: they offset passive income freely, and up to $25,000/yr can offset ordinary (W-2) income if you actively participate and your MAGI is under $100k (phasing out to $0 by $150k); unused losses carry forward. On sale, claimed depreciation is recaptured at up to 25%, and gains may owe capital-gains tax (a 1031 exchange can defer both). Figures are a year-1 estimate at your 24.0% rate — not tax advice; consult a CPA.
Schools (NCES district)
- District
- Batesville School District
- NCES district ID
- 0500019
- Math proficiency
- 36% ▼ -12.00%
- Reading proficiency
- 38% ▼ -6.00%
- Median HH income
- $37,304
- Composite
- 30.79/100
- National rank
- #6147
- State rank
- #104 of 238 in AR
Livability — Batesville
- Score
- 72/100
- State rank
- #33
- US rank
- #6274
Category grades
Schools grade is shown separately in the Schools card above.
Census & demographics
- Census place
- Batesville, AR
- County
- Independence County · 26,218 people
- City population
- 26,218
- Metro
- Batesville, AR
- Population (ZIP)
- 26,218
- Household income
- $52,829
- Rent vs Own
- Severe rent burden
- 553.0
Population outlook (Independence County) Hauer SSP2
- Today (2025)
- 37,748 people
- By 2030
- 37,962 · +0.6%
- By 2040
- 38,151 · +1.1%
- By 2050
- 37,980 · +0.6%
- By 2075
- 36,622 · -3.0%
- By 2100
- 32,741 · -13.3%
Race, ethnicity, and origin ACS 2023
- Neighborhood character
- Predominantly White (79%)
- Race & ethnicity
- White 79% Hispanic / Latino 12% Two or more races 8% Black 2% Asian 1%
- Hispanic origin (detail)
- Mexican 6%
- Common ancestry
- Slovak 2% Lithuanian 2% Italian 1%
- Foreign-born
- 5% · Canada, Vietnam
- Languages at home
- 92% English-only · Spanish 7% Other Asian/Pacific 1%
Political lean MEDSL · Independence
- 2024 margin
- Solid R (+59.5) · D 19.2% · R 78.7% · Other 2.1%
- 2008→2024 swing
- -22.3pp toward R · 2008: -37.1pp · 2024: -59.5pp
- All cycles
- 2024: R+59.5 2020: R+58.2 2016: R+52.4 2012: R+44.0 2008: R+37.1
Not yet ingested
- Civics
- —
Market trends
- HPI YoY
- ▼ -40.19%
- Current HPI
- 206.3787
- Rent YoY
- —
- Metro
- Batesville, AR
- State GDP YoY
- ▲ 3.80%
- F500 in state
- 10
Industry mix (Fortune 500 HQ in AR)
| Industry | F500 HQs | Revenue |
|---|---|---|
| Retail | 1 | $681B |
|
||
| Food / Agriculture | 1 | $53B |
|
||
| Retail / Energy | 1 | $22B |
|
||
| Transportation / Logistics | 1 | $12B |
|
||
| Energy | 1 | $4B |
|
||
Price history
+291.3% since first listed6 events — show timeline
- 2026-06-02 Listed $90,000 CARMLS
- 2025-12-02 Sold (Public Records) $240,000 Public Records
- 2013-07-25 Sold (Public Records) $48,000 Public Records
- 2012-04-17 Sold (Public Records) $48,000 Public Records
- 1995-10-12 Sold (Public Records) $27,000 Public Records
- 1980-05-01 Sold (Public Records) $23,000 Public Records
Property tax history
+1.0%/yrLatest (2025): $420 · +10.0% YoY. Source: county tax records.
Cash-flow waterfall
monthlySold comps — $/sqft
last 12 mo · ≤1 miLoading sold comps…