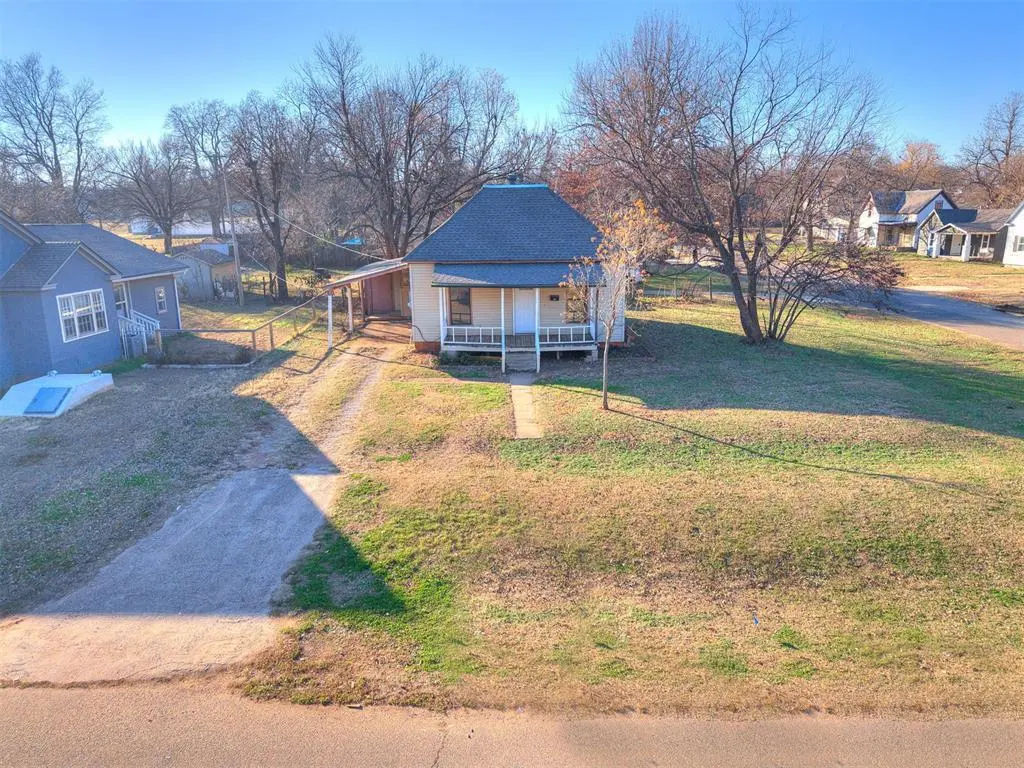
521 N 11th St · Guthrie, OK
Flood risk No data
- FEMA flood zone
- —
- Chance of flooding over 30 yrs
- —
- Est. flood insurance / yr
- —
Fire risk No data
- Est. fire insurance / yr
- —
Heat risk No data
- Hot days now (above threshold)
- —
- Hot days in 30 yrs
- —
Wind risk No data
- Chance of severe wind over 30 yrs
- —
Air-quality risk No data
- Unhealthy air days now
- —
- Unhealthy air days in 30 yrs
- —
Risk factors via First Street. Map © Google.
Why this score? — see what drove the B+ grade
The composite is a weighted blend of 9 inputs, each scored 0–100. Each bar is that input's sub-score; the figure is the points it added to the 100-point composite (weight × sub-score).
- Cash flow +29.9/30.0
- ARV discount +15.0/15.0
- DSCR +10.0/10.0
- 1% rule +8.5/10.0
- Rent growth +5.0/5.0
- Livability +3.7/5.0
- Condition / age +2.5/5.0
- Schools +2.1/10.0
- Appreciation +0.0/10.0
$108,500
🖨 Deal sheet 📄 Offer letter ✓ Due diligence
Listing remarks
Charming and move-in ready on a desirable corner lot with a cute, functional layout and flexible living space! This home offers 2 bedrooms and 1 full bath, plus an optional 3rd bedroom—perfect for a home office, nursery, or guest room. Recent updates include updated windows throughout, all new flooring, and a brand new roof (2025) for added peace of mind. Enjoy central heat and air, a dedicated utility room with washer and dryer, an attached storage area, and the convenience of a private driveway. Fantastic location within walking distance to a brand new park with splashpad and in close proximity to downtown Guthrie for shopping, dining, and local events—schedule your showing to
Key facts
- Updated windows
- Central heat and air
- New flooring
Tags
Property features AI
Finance
- Other: Located in West Guthrie addition; Directions: Southwest corner of 11th St. and Logan Ave.; Occupied: No; Listing status: Active; Model home: No; Property level: One
- Financial info: Loan qualification available; Not assumable
- HOA & community: No mandatory association dues
Exterior
- Parking: Detached or attached 1-car garage
- Home design: Single-family residence; Residential property; Faces east
- Construction: Frame construction; Composition roof; Combination foundation; Existing property
- Exterior features: Corner lot; No exterior special features listed
Interior
- Kitchen: Dining area
- Bedrooms: 3 bedrooms
- Bathrooms: 1 full bathroom
- Heating & cooling: Electric heating
- Interior features: One-level layout; No fireplace; Living area verified by appraisal; Homestead eligible
- Laundry & utility: Combination foundation (utility access)
Neighborhood map
What this means for you Summary
Snapshot
- This is a 3-bed/1.0-bath single-family listed at $108k.
Deal economics
- At list price, monthly cash flow is $403 ($5k/yr) — positive.
- The deal already cash-flows at list — no discount required.
- Meets the 1% rule at list price ($1k rent vs $108k).
- Recommended offer: $105k (3.0% below list) — sets the bar for market timing.
- Cap rate 10.8% vs local median 3.0% in Guthrie — top-decile yield for the area; either an underpriced asset or a hidden risk that comps aren't pricing in. Stress-test before assuming the spread holds.
Location & tenants
- Location reads 74/100 on livability (#15 in OK, #4,696 nationally) — a middle-class / working-renter tenant base. Strengths: cost of living A+, housing A+, health & safety A+; Watch: amenities F, commute F.
- Guthrie (town): math 24% / reading 24% proficiency, ranked #119 of 270 in OK (top 44%) — low school quality limits family demand, transient renter base, plan for 1-2y turnover.
- Zoned schools: Cotteral Es (math 27% / reading 22%, grade F, #354 of 845 statewide, top 47%, 294 students, 0% FRL); Guthrie Hs (math 22% / reading 32%, grade F, #125 of 447 statewide, top 31%, 1,025 students, 0% FRL) — zoned schools average 0% FRL vs 55% district-wide (55 pts lower); this property's tenant base skews higher-income than the district average.
- Market conditions: Rents rising fast (+12.2%/yr); 843 active listings in the ZIP; 1 comparable units currently listed for rent nearby; 102 units permitted in Logan County in 2024 (0 in 5+ unit buildings).
Forward outlook
- Local home prices are declining (-3.0%/yr); year-one equity from $750 of loan paydown is wiped out by about $3k of value loss. Plan a longer hold.
- Logan County population projected at +36% by 2050 — long-run rental-demand tailwind backs the buy-and-hold thesis.
- At projected returns (-3.0% appreciation + 8.0% rent growth), your $30k cash investment doubles in ~6 years — after that, you're playing with house money.
Negotiation context
- It's been on market 49 days — a 3% lower offer ($105k) is reasonable based on typical stale-listing flexibility.
- 3 sale attempts since 17y ago; this cycle's ask has dropped $10k (8%) from the opening price — seller is motivated, your offer sets the floor, not the list.
Risks & watch-outs
- Watch-outs: built in 1945 — expect roof / HVAC / electrical / plumbing capex.
Questions for the listing agent
- It's been on market 49 days. Have you received any prior offers? Is the seller open to a 3% concession, seller financing, or rate buy-down credit?
- Built in 1945 — when were the roof, HVAC, electrical panel, plumbing, and water heater last replaced?
- Is there a deadline driving the sale (1031 exchange, divorce, estate, relocation)? That informs how much negotiation room exists.
- Schools are F-rated, which usually means shorter tenancies and higher turnover. Who's the typical renter profile here, and what's been the actual vacancy rate?
- What's the average days-on-market for RENTAL listings here right now (not sales)? A rising rental-DOM trend means longer vacancies and softer asking-rent achievability than the comps imply.
- What's the recent tenant-quality profile in this submarket — average credit score on applications, eviction rate, late-payment / NSF rate, and stable-employment percentage? A property-management company in the area should have these aggregated.
- How much new for-sale + rental construction is in the pipeline within 1–3 miles? Heavy new supply typically softens prices + rents 12–24 months out; constrained supply supports both.
Investment metrics
- 1% rule
- 1.35% ✓
- Cap rate
- 10.75%
- Cash-on-cash
- 15.92%
- DSCR
- 1.71
- GRM
- 6.2
CMA / ARV
- ARV (on-the-fly)
- $141,336
- Comps found
- 12
Show comp detail 12 sales within ~0.75 mi
| Address | Dist | Beds/Ba | Sqft | Sold | Price | $/sf | Match |
|---|---|---|---|---|---|---|---|
| 920 W Warner Ave | 0.21mi | 2/1.0 (-1) | 907 (-3%) | 3mo | $35,000 | $39 | 78 |
| 1119 W Logan Ave | 0.04mi | 3/1.0 | 1,004 (+7%) | 18mo | $148,000 | $147 | 71 |
| 1401 W College Ave | 0.21mi | 2/1.0 (-1) | 875 (-6%) | 11mo | $135,000 | $154 | 65 |
| 1208 W Noble Ave | 0.18mi | 3/2.0 | 1,022 (+9%) | 13mo | $175,000 | $171 | 62 |
| 1531 W Washington Ave | 0.28mi | 2/1.0 (-1) | 832 (-11%) | 3mo | $149,500 | $180 | 61 |
| 1515 W Washington Ave | 0.25mi | 2/1.0 (-1) | 832 (-11%) | 10mo | $145,000 | $174 | 56 |
| 1817 W Harrison Ave | 0.62mi | 3/1.0 | 1,000 (+7%) | 10mo | $130,000 | $130 | 51 |
| 104 N 17th St | 0.51mi | 2/1.0 (-1) | 995 (+6%) | 12mo | $150,350 | $151 | 51 |
| 416 N 16th St | 0.34mi | 2/1.0 (-1) | 829 (-11%) | 12mo | $43,000 | $52 | 50 |
| 314 N 2nd St | 0.70mi | 3/1.0 | 900 (-4%) | 20mo | $32,000 | $36 | 45 |
| 601 N 20th St | 0.62mi | 2/1.0 (-1) | 798 (-15%) | 9mo | $125,000 | $157 | 34 |
| 2015 W Cleveland Ave | 0.65mi | 2/1.0 (-1) | 817 (-13%) | 19mo | $97,500 | $119 | 28 |
Match score weights: distance 35% · size 25% · config 20% · recency 20%. Top-matched comps best support the ARV.
Projected returns pro-forma
-3.0% appreciation · 8.0% rent growth · sell at horizon
- IRR
- 12.4%
- Equity multiple
- 1.52×
- Total profit
- $15,825
- Equity at exit
- $16,178
- IRR
- 24.9%
- Equity multiple
- 3.70×
- Total profit
- $82,030
- Equity at exit
- $9,381
Cash invested: $30,380 (down + closing). Projections, not guarantees.
Landlord ↔ Tenant lean methodology
- Overall (STATE)
- 83 Strongly Landlord-Friendly
- State Oklahoma
- 83 Strongly Landlord-Friendly · R+20
- County
- — inherits STATE
- City
- — inherits STATE
ZIP-level market 73044
- Home prices YoY
- -25.9%
- Rents YoY
- 12.2%
- Active inventory
- 843
- Price-to-rent
- 6.2×
Monthly cashflow live
- Estimated rent
- $1,459 medium interval (Pro) →
- Mortgage (P&I)
- −$569
- Tax est. 1.5%
- −$136 /mo · $1,628/yr
- Insurance
- −$45
- HOA
- −$0
- Vacancy / Maint / Mgmt
- −$306
- Net cashflow
- $403
Break-even live
UW: 25.0% down · 7.5% · 30yr · 1.5% tax · 5.0% vac · 8.0% maint · 8.0% mgmt
Financing live
Cash to close
- Down payment
- $27,125
- Closing costs
- $3,255
- Reserves months
- —
- Total cash needed
- —
Loan-product check · same deal, 3 products live
Conventional
25% down · 7.5% · 30yr
- Down + closing
- —
- Monthly P&I
- —
- Monthly cashflow
- —
- DSCR
- —
- Eligible?
- —
Personal DTI + credit; lowest rate.
DSCR
20% down · 8.5% · 30yr
- Down + closing
- —
- Monthly P&I
- —
- Monthly cashflow
- —
- DSCR
- —
- Eligible?
- —
No personal income docs; deal must DSCR.
Hard money
10% down · 12.0% · 12mo
- Down + closing
- —
- Monthly P&I
- —
- Monthly cashflow
- —
- DSCR
- —
- Eligible?
- —
Short-term bridge; refi at stabilization.
Rent comps 1 comps
| Address | Beds | Baths | Sqft | Rent | $/sqft | DOM | Units | Dist |
|---|---|---|---|---|---|---|---|---|
| 520 E Springer Ave Guthrie, OK | 2.0 | 2.0 | 1092 | $1,300 | $1.19 | 24d | 1 | 1.23mi |
Listing history 20 events
-
2026-06-18days on market $108,500 Active 49 DOM
-
2026-06-17days on market $108,500 Active 48 DOM
-
2026-06-16days on market $108,500 Active 47 DOM
-
2026-06-15days on market $108,500 Active 46 DOM
-
2026-06-13days on market $108,500 Active 44 DOM
-
2026-06-13days on market $108,500 Active 43 DOM
-
2026-06-09days on market $108,500 Active 40 DOM
-
2026-06-08days on market $108,500 Active 39 DOM
-
2026-06-07days on market $108,500 Active 38 DOM
-
2026-06-05days on market $108,500 Active 35 DOM
-
2026-06-03days on market $108,500 Active 34 DOM
-
2026-06-02days on market $108,500 Active 33 DOM
-
2026-06-01days on market $108,500 Active 32 DOM
-
2026-05-31days on market $108,500 Active 31 DOM
-
2026-04-30$118,000 Active
-
2026-04-28historical
-
2026-03-05price $123,500
-
2025-12-09$124,500 Active
-
2009-11-04historical
-
2009-06-03$69,950
ⓘ Source: listings_history table (triggers on properties + properties_extension) + one-shot
backfill from property_details.listing_events for pre-trigger history.
Nearby sold comps map
Loading sold comps map…
Walkable amenities ~0.75 mi
Loading nearby amenities…
Taxation est. · year 1
- Rental income
- $17,512
- − Mortgage interest
- −$6,078
- − Property taxes
- −$1,628
- − Insurance
- −$542
- − Repairs & maintenance
- −$1,401
- − Management
- −$1,401
- − Depreciation
- −$3,156
- Taxable income
- $3,306
- Est. tax owed @ 24.0%
- −$794
- After-tax cash flow
- $4,043/yr
For passive investors: Depreciation is non-cash, so a rental often shows a tax loss while cash-flowing — sheltering income. Rental losses are passive: they offset passive income freely, and up to $25,000/yr can offset ordinary (W-2) income if you actively participate and your MAGI is under $100k (phasing out to $0 by $150k); unused losses carry forward. On sale, claimed depreciation is recaptured at up to 25%, and gains may owe capital-gains tax (a 1031 exchange can defer both). Figures are a year-1 estimate at your 24.0% rate — not tax advice; consult a CPA.
Schools (NCES district)
- District
- Guthrie
- NCES district ID
- 4013560
- Math proficiency
- 24% ▼ -7.00%
- Reading proficiency
- 24% ▼ -2.00%
- Median HH income
- $45,370
- Composite
- 20.79/100
- National rank
- #8513
- State rank
- #119 of 270 in OK
Livability — Guthrie
- Score
- 74/100
- State rank
- #15
- US rank
- #4696
Category grades
Schools grade is shown separately in the Schools card above.
Census & demographics
- Census place
- Guthrie, OK
- County
- Logan County · 25,398 people
- City population
- 25,398
- Metro
- Oklahoma City, OK
- Population (ZIP)
- 25,398
- Household income
- $72,288
- Rent vs Own
- Severe rent burden
- 397.0
Population outlook (Logan County) Hauer SSP2
- Today (2025)
- 55,683 people
- By 2030
- 60,011 · +7.8%
- By 2040
- 68,071 · +22.2%
- By 2050
- 75,815 · +36.2%
- By 2075
- 94,749 · +70.2%
- By 2100
- 108,057 · +94.1%
Race, ethnicity, and origin ACS 2023
- Neighborhood character
- Predominantly White (77%)
- Race & ethnicity
- White 77% Two or more races 10% Hispanic / Latino 8% Black 6% Native American 3%
- Hispanic origin (detail)
- Mexican 7%
- Common ancestry
- Slovak 3% Lithuanian 3% Italian 2%
- Foreign-born
- 3% · Canada
- Languages at home
- 94% English-only · Spanish 6%
Political lean MEDSL · Logan
- 2024 margin
- Solid R (+49.0) · D 24.4% · R 73.5% · Other 2.1%
- 2008→2024 swing
- -11.6pp toward R · 2008: -37.4pp · 2024: -49.0pp
- All cycles
- 2024: R+49.0 2020: R+47.1 2016: R+49.5 2012: R+44.8 2008: R+37.4
Not yet ingested
- Civics
- —
Market trends
- HPI YoY
- ▼ -86.90%
- Current HPI
- 247.9481
- Rent YoY
- ▲ 12.22%
- Metro
- Oklahoma City, OK
- State GDP YoY
- ▲ 1.55%
- F500 in state
- 6
Industry mix (Fortune 500 HQ in OK)
| Industry | F500 HQs | Revenue |
|---|---|---|
| Energy | 3 | $48B |
|
||
Price history
+68.7% since first listed6 events — show timeline
- 2026-04-30 Listed $118,000 MLSOK
- 2026-04-28 Listing Removed — MLSOK
- 2026-03-05 Price Changed $123,500 MLSOK
- 2025-12-09 Listed $124,500 MLSOK
- 2009-11-04 Listing Removed — MLSOK
- 2009-06-03 Listed $69,950 MLSOK
Cash-flow waterfall
monthlySold comps — $/sqft
last 12 mo · ≤1 miLoading sold comps…