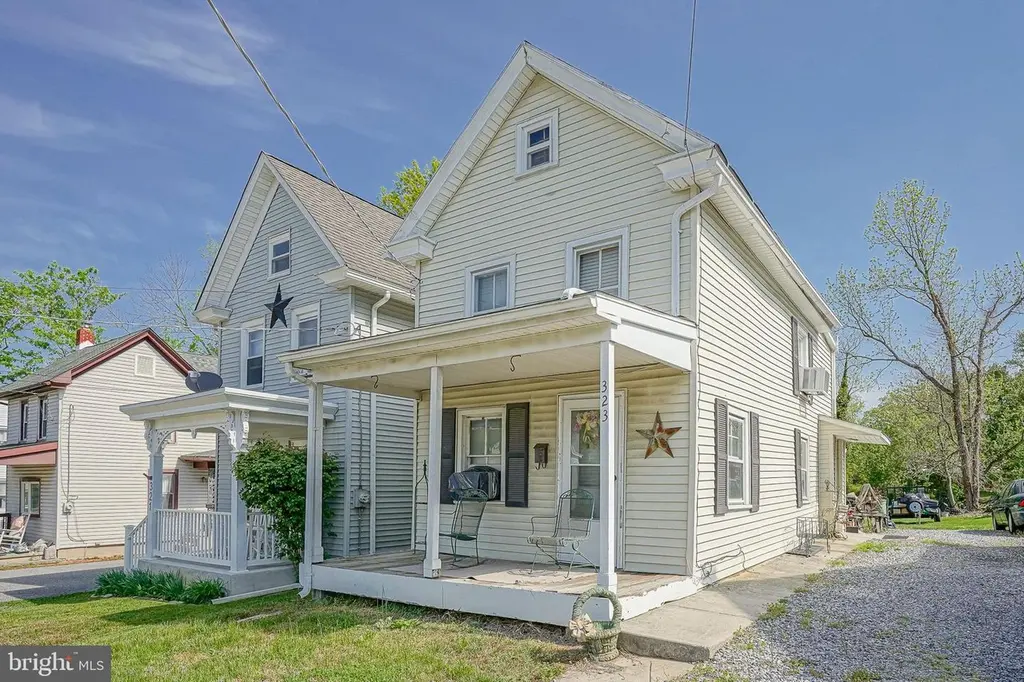
323 S Main St · Woodstown, NJ
Flood risk 4/10 · Minor
- FEMA flood zone
- X (unshaded)
- Chance of flooding over 30 yrs
- 0.22%
- Est. flood insurance / yr
- $507 – $1,088
Fire risk 3/10 · Minor
- Est. fire insurance / yr
- $526 – $976
Heat risk 7/10 · Major
- Hot days now (above 103°F)
- 7 days/yr
- Hot days in 30 yrs
- 15 days/yr
Wind risk 6/10 · Moderate
- Chance of severe wind over 30 yrs
- 27.0%
Air-quality risk 3/10 · Minor
- Unhealthy air days now
- 2 days/yr
- Unhealthy air days in 30 yrs
- 4 days/yr
Risk factors via First Street. Map © Google.
Why this score? — see what drove the B grade
The composite is a weighted blend of 9 inputs, each scored 0–100. Each bar is that input's sub-score; the figure is the points it added to the 100-point composite (weight × sub-score).
- Cash flow +20.9/30.0
- ARV discount +15.0/15.0
- Appreciation +10.0/10.0
- 1% rule +7.0/10.0
- DSCR +6.6/10.0
- Livability +3.5/5.0
- Schools +3.3/10.0
- Rent growth +2.5/5.0
- Condition / age +2.5/5.0
$149,900
🖨 Deal sheet 📄 Offer letter ✓ Due diligence
Listing remarks
Calling all investors. This diamond in the rough is located in desirable Woodstown in Salem County and situated on a nice size lot. Offers kitchen, living room and dining room. 1 bedroom upstairs and a loft area. Nice size lot and off street parking. Plenty of potential here. But does require work. Being sold strictly as is and buyer responsible for all certifications and repairs etc.
Key facts
- 0.25 acre lot
- Built 1900
- Listed 51 days
Property features AI
Finance
- Financial info: Ownership: Fee simple
Exterior
- Parking: Driveway
- Utilities: Public water; Public sewer; Hot water: natural gas
- Home design: Detached property; Finished area above grade: 826 (source: assessor)
- Construction: Combination construction materials; Stone and piling foundation
- Exterior features: Lot dimensions approximately 35 x 305; Tidal water: none; Other structures above grade and below grade
Interior
- Kitchen: Kitchen (appliances not specified)
- Bedrooms: One bedroom on the first upper level
- Bathrooms: One full bathroom
- Heating & cooling: Forced air heating (oil-fired); Electric cooling
- Interior features: Living room; Dining room; Loft
- Laundry & utility: Basement present (partial)
Neighborhood map
What this means for you Summary
Snapshot
- This is a 1-bed/1.0-bath single-family listed at $150k.
Deal economics
- At list price, monthly cash flow is $207 ($2k/yr) — positive.
- The deal already cash-flows at list — no discount required.
- Meets the 1% rule at list price ($2k rent vs $150k).
- Recommended offer: $145k (3.0% below list) — sets the bar for market timing.
- Cap rate 8.0% vs local median 2.3% in Woodstown — top-decile yield for the area; either an underpriced asset or a hidden risk that comps aren't pricing in. Stress-test before assuming the spread holds.
Location & tenants
- Location reads 69/100 on livability (#298 in NJ) — a middle-class / working-renter tenant base. Strengths: crime A+, employment A+, housing A+; Watch: amenities F, commute F, health & safety F.
- Woodstown-Pilesgrove Regional School District (town): math 23% / reading 48% proficiency, ranked #259 of 472 in NJ (top 55%) — families likely to look elsewhere, expect single-tenant / working-renter base with shorter leases.
- Market conditions: 63 active listings in the ZIP; 1 comparable units currently listed for rent nearby; 95 units permitted in Salem County in 2024 (0 in 5+ unit buildings).
Forward outlook
- In year one you build about $16k of equity ($1k loan paydown + $15k appreciation (10.0% local appreciation)).
- Salem County population projected at -23% by 2050 — secular population decline; favor cash flow + early exit over multi-decade hold.
- At projected returns (10.0% appreciation + 3.0% rent growth), your $42k cash investment doubles in ~3 years — after that, you're playing with house money.
- By year 3, paydown + projected appreciation supports a ~$41k cash-out refi (75% LTV) — recoverable capital for the next deal without selling this one.
Negotiation context
- It's been on market 52 days — a 3% lower offer ($145k) is reasonable based on typical stale-listing flexibility.
- Current owner paid $9k; list at $150k implies a 1566% gain — meaningful room to come down on a strong offer.
Risks & watch-outs
- Watch-outs: property tax is 2.9% of price; built in 1900 — expect roof / HVAC / electrical / plumbing capex.
- Climate carrying-cost: major wind risk, 27% chance of damaging wind over 30y; extreme-heat days projected 7→15/yr by 2055 (HVAC capex compounding) — expect insurance premiums to compound above CPI over the hold.
Questions for the listing agent
- It's been on market 52 days. Have you received any prior offers? Is the seller open to a 3% concession, seller financing, or rate buy-down credit?
- Built in 1900 — when were the roof, HVAC, electrical panel, plumbing, and water heater last replaced?
- Property tax is high relative to price — has the assessment been appealed recently, and will the sale trigger a re-assessment?
- Is there a deadline driving the sale (1031 exchange, divorce, estate, relocation)? That informs how much negotiation room exists.
- Schools are B-rated — typically a magnet for longer-tenancy family renters. What's the average tenant stay here, and is there a school-zone premium baked into asking?
- What's the average days-on-market for RENTAL listings here right now (not sales)? A rising rental-DOM trend means longer vacancies and softer asking-rent achievability than the comps imply.
- What's the recent tenant-quality profile in this submarket — average credit score on applications, eviction rate, late-payment / NSF rate, and stable-employment percentage? A property-management company in the area should have these aggregated.
- How much new for-sale + rental construction is in the pipeline within 1–3 miles? Heavy new supply typically softens prices + rents 12–24 months out; constrained supply supports both.
Investment metrics
- 1% rule
- 1.20% ✓
- Cap rate
- 7.95%
- Cash-on-cash
- 5.93%
- DSCR
- 1.26
- GRM
- 6.9
CMA / ARV
- ARV (median comp)
- $204,098
- List price
- $149,900
- Delta
- -26.56%
- Verdict
- UNDERPRICED
- Comps
- 11 within 1.0 mi
Projected returns pro-forma
10.0% appreciation · 3.0% rent growth · sell at horizon
- IRR
- 28.6%
- Equity multiple
- 3.26×
- Total profit
- $94,979
- Equity at exit
- $135,042
- IRR
- 24.9%
- Equity multiple
- 7.42×
- Total profit
- $269,588
- Equity at exit
- $291,223
Cash invested: $41,972 (down + closing). Projections, not guarantees.
Landlord ↔ Tenant lean methodology
- Overall (STATE)
- 21 Tenant-Leaning
- State New Jersey
- 21 Tenant-Leaning · D+6
- County
- — inherits STATE
- City
- — inherits STATE
ZIP-level market 08098
- Home prices YoY
- 3.7%
- Active inventory
- 63
- Price-to-rent
- 6.9×
Monthly cashflow live
- Estimated rent
- $1,800 medium interval (Pro) →
- Mortgage (P&I)
- −$786
- Tax from tax record
- −$366 /mo · $4,394/yr
- Insurance
- −$62
- HOA
- −$0
- Vacancy / Maint / Mgmt
- −$378
- Net cashflow
- $207
Break-even live
UW: 25.0% down · 7.5% · 30yr · 1.5% tax · 5.0% vac · 8.0% maint · 8.0% mgmt
Financing live
Cash to close
- Down payment
- $37,475
- Closing costs
- $4,497
- Reserves months
- —
- Total cash needed
- —
Loan-product check · same deal, 3 products live
Conventional
25% down · 7.5% · 30yr
- Down + closing
- —
- Monthly P&I
- —
- Monthly cashflow
- —
- DSCR
- —
- Eligible?
- —
Personal DTI + credit; lowest rate.
DSCR
20% down · 8.5% · 30yr
- Down + closing
- —
- Monthly P&I
- —
- Monthly cashflow
- —
- DSCR
- —
- Eligible?
- —
No personal income docs; deal must DSCR.
Hard money
10% down · 12.0% · 12mo
- Down + closing
- —
- Monthly P&I
- —
- Monthly cashflow
- —
- DSCR
- —
- Eligible?
- —
Short-term bridge; refi at stabilization.
Rent comps 1 comps
| Address | Beds | Baths | Sqft | Rent | $/sqft | DOM | Units | Dist |
|---|---|---|---|---|---|---|---|---|
| 21 N Main St Apt A Woodstown, NJ | 2.0 | 1.0 | 900 | $1,800 | $2.00 | 1d | 1 | 0.58mi |
Listing history 16 events
-
2026-06-18days on market $149,900 Active 52 DOM
-
2026-06-17days on market $149,900 Active 51 DOM
-
2026-06-16days on market $149,900 Active 50 DOM
-
2026-06-15days on market $149,900 Active 49 DOM
-
2026-06-13days on market $149,900 Active 47 DOM
-
2026-06-09days on market $149,900 Active 43 DOM
-
2026-06-08days on market $149,900 Active 42 DOM
-
2026-06-07days on market $149,900 Active 41 DOM
-
2026-06-04days on market $149,900 Active 38 DOM
-
2026-06-03days on market $149,900 Active 37 DOM
-
2026-06-02days on market $149,900 Active 36 DOM
-
2026-06-01days on market $149,900 Active 35 DOM
-
2026-05-31days on market $149,900 Active 34 DOM
-
2026-04-28$170,000 Active 387-char remark
-
2026-04-27historical $170,000 387-char remark
-
1977-10-14soldstatus $9,000
ⓘ Source: listings_history table (triggers on properties + properties_extension) + one-shot
backfill from property_details.listing_events for pre-trigger history.
Tax reassessment forecast NJ · Partial reset (capped growth)
- Current annual tax
- $4,394 · $366/mo
- Projected year-2 tax
- $4,394 · $366/mo
- Expected delta
- $0/yr ($0/mo · 0.0%)
ⓘ Screening estimate from a state-policy table — verify with the county assessor before closing.
Climate risk First Street
- Flood 4/10 Moderate FEMA zone X (unshaded) · 22% chance over 30 yrs
- Wildfire 3/10 Moderate
- Heat 7/10 Severe 7 d/yr ≥103°F today · 15 d/yr by 30 yrs out
- Wind 6/10 Major 27% chance of damaging wind over 30 yrs
- Air quality 3/10 Moderate 2 unhealthy d/yr today · 4 by 30 yrs out
Nearby sold comps map
Loading sold comps map…
Walkable amenities ~0.75 mi
Loading nearby amenities…
Taxation est. · year 1
- Rental income
- $21,600
- − Mortgage interest
- −$8,397
- − Property taxes
- −$4,394
- − Insurance
- −$750
- − Repairs & maintenance
- −$1,728
- − Management
- −$1,728
- − Depreciation
- −$4,361
- Taxable income
- $243
- Est. tax owed @ 24.0%
- −$58
- After-tax cash flow
- $2,429/yr
For passive investors: Depreciation is non-cash, so a rental often shows a tax loss while cash-flowing — sheltering income. Rental losses are passive: they offset passive income freely, and up to $25,000/yr can offset ordinary (W-2) income if you actively participate and your MAGI is under $100k (phasing out to $0 by $150k); unused losses carry forward. On sale, claimed depreciation is recaptured at up to 25%, and gains may owe capital-gains tax (a 1031 exchange can defer both). Figures are a year-1 estimate at your 24.0% rate — not tax advice; consult a CPA.
Schools (NCES district)
- District
- Woodstown-Pilesgrove Regional School District
- NCES district ID
- 3418330
- Math proficiency
- 23% ▼ -25.00%
- Reading proficiency
- 48% ▼ -18.00%
- Median HH income
- $76,323
- Composite
- 33.18/100
- National rank
- #5539
- State rank
- #259 of 472 in NJ
Livability — Woodstown
- Score
- 69/100
- State rank
- #298
- US rank
- #8999
Category grades
Schools grade is shown separately in the Schools card above.
Census & demographics
- Census place
- Woodstown, NJ
- City population
- 9,475
- Population (ZIP)
- 9,475
Population outlook (Salem County) Hauer SSP2
- Today (2025)
- 59,905 people
- By 2030
- 57,351 · -4.3%
- By 2040
- 51,837 · -13.5%
- By 2050
- 46,356 · -22.6%
- By 2075
- 36,452 · -39.2%
- By 2100
- 28,907 · -51.7%
Race, ethnicity, and origin ACS 2023
- Neighborhood character
- Predominantly White (76%)
- Race & ethnicity
- White 76% Hispanic / Latino 11% Two or more races 8% Black 8%
- Hispanic origin (detail)
- Mexican 6% Puerto Rican 4%
- Common ancestry
- Romanian 4% Iranian 1% Slovak 1%
- Foreign-born
- 6% · Canada
- Languages at home
- 96% English-only · Spanish 3%
Political lean MEDSL · Salem
- 2024 margin
- R (+19.2) · D 39.6% · R 58.8% · Other 1.6%
- 2008→2024 swing
- -23.1pp toward R · 2008: 3.9pp · 2024: -19.2pp
- All cycles
- 2024: R+19.2 2020: R+12.8 2016: R+15.4 2012: D+0.8 2008: D+3.9
Not yet ingested
- Civics
- —
Market trends
- HPI YoY
- ▲ 10.27%
- Current HPI
- 290.7359
- Rent YoY
- —
- Metro
- —
- State GDP YoY
- ▲ 2.05%
- F500 in state
- 34
Industry mix (Fortune 500 HQ in NJ)
| Industry | F500 HQs | Revenue |
|---|---|---|
| Consumer Goods | 3 | $31B |
|
||
| Pharmaceuticals | 2 | $153B |
|
||
| Technology | 2 | $21B |
|
||
| Insurance | 2 | $20B |
|
||
| Healthcare | 2 | $19B |
|
||
| Financial Services | 1 | $70B |
|
||
Price history
+1565.6% since first listed4 events — show timeline
- 2026-05-27 Price Changed $149,900 BRIGHT MLS
- 2026-04-28 Listed $170,000 BRIGHT MLS
- 2026-04-27 Coming Soon $170,000 BRIGHT MLS
- 1977-10-14 Sold (Public Records) $9,000 Public Records
Property tax history
+3.2%/yrLatest (2025): $4,394 · +3.4% YoY. Source: county tax records.
Cash-flow waterfall
monthlySold comps — $/sqft
last 12 mo · ≤1 miLoading sold comps…