144 E University Dr · Auburn, AL
Flood risk 1/10 · Minimal
- FEMA flood zone
- X (unshaded)
- Chance of flooding over 30 yrs
- 0.0%
- Est. flood insurance / yr
- $507 – $1,088
Fire risk 4/10 · Minor
- Est. fire insurance / yr
- $916 – $1,700
Heat risk 6/10 · Moderate
- Hot days now (above 105°F)
- 7 days/yr
- Hot days in 30 yrs
- 19 days/yr
Wind risk 6/10 · Moderate
- Chance of severe wind over 30 yrs
- 68.0%
Air-quality risk 2/10 · Minimal
- Unhealthy air days now
- 1 days/yr
- Unhealthy air days in 30 yrs
- 1 days/yr
Risk factors via First Street. Map © Google.
Why this score? — see what drove the C- grade
The composite is a weighted blend of 9 inputs, each scored 0–100. Each bar is that input's sub-score; the figure is the points it added to the 100-point composite (weight × sub-score).
- ARV discount +15.0/15.0
- Cash flow +12.9/30.0
- Schools +5.0/10.0
- Rent growth +4.0/5.0
- Livability +4.0/5.0
- DSCR +3.8/10.0
- Condition / age +3.8/5.0
- 1% rule +3.6/10.0
- Appreciation +0.0/10.0
$139,000
🖨 Deal sheet 📄 Offer letter ✓ Due diligence
Listing remarks
Association amenities include the following: pool, tennis, basketball and volleyball courts. Dues of $132 a month include water/sewer, trash, pest control, lawn and pool maintenance. Only 2.3 miles from AU! This GROUND FLOOR 1 bed/1 bath condo features a wonderful floor plan. Tiger transit route stop. What's NEW: HVAC inside and out units, new Hot water tank, stove and dishwasher. Ready for you!
Key facts
- Ground floor
- Tennis courts
- Pool
Tags
Property features AI
Exterior
- Parking: Parking pad
- Utilities: Public sewer
- Home design: Multi Family condominium; Residential property; Entry on lower floor (Unit 106 is on the bottom floor)
- Construction: Brick construction; Slab foundation
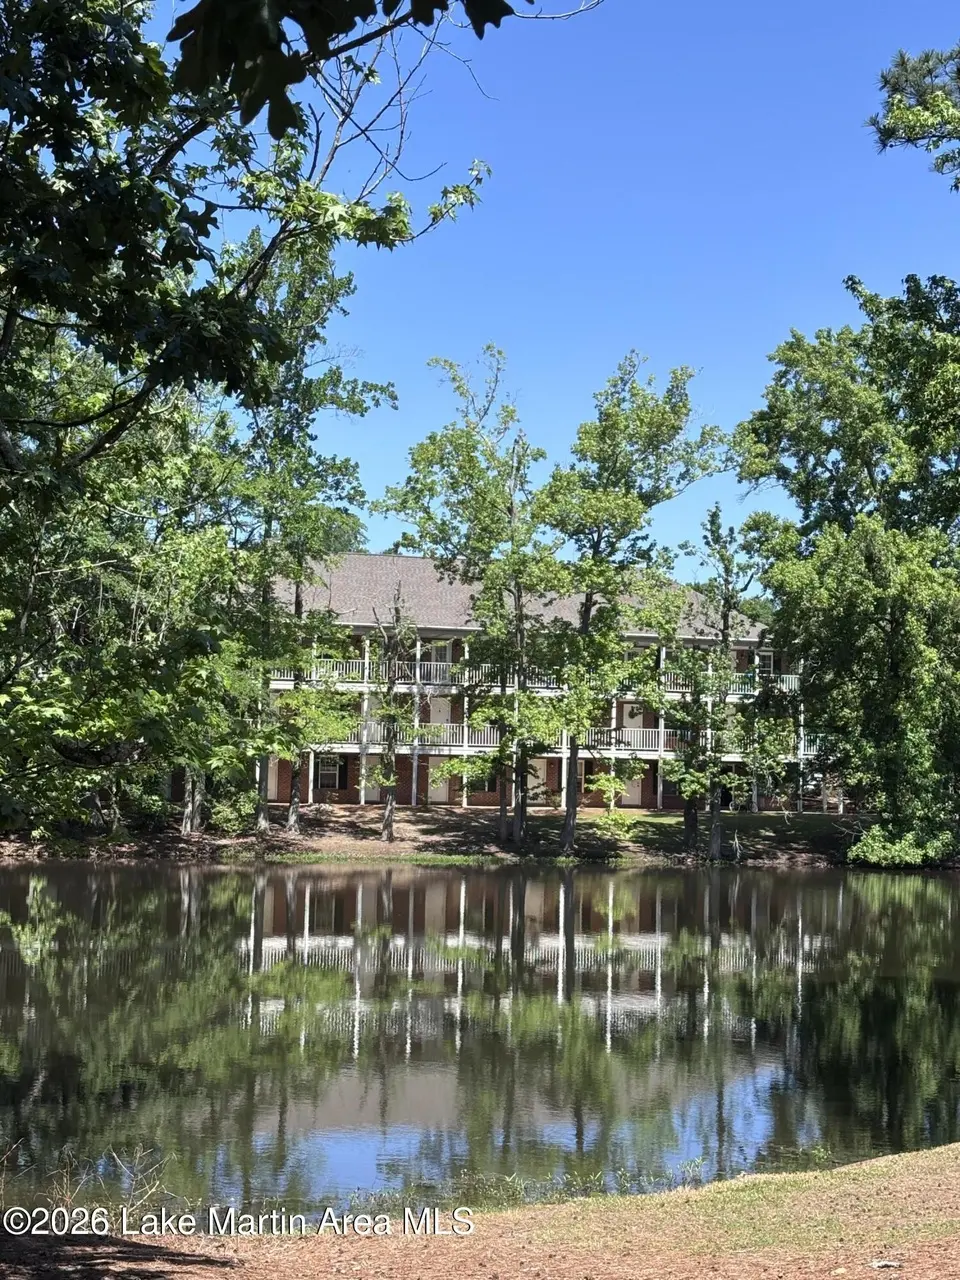
- Exterior features: On waterfront (water body: Other)
Interior
- Flooring: Laminate
- Heating & cooling: Heat pump heating; Heat pump cooling
- Interior features: Laminate flooring
Neighborhood map
What this means for you Summary
Snapshot
- This is a 1-bed/1.0-bath townhouse listed at $139k. Condition is rated good.
Deal economics
- At list price, monthly cash flow is $-11 ($-132/yr) — negative.
- To cash-flow at today's rent, offer at most $137k (1.1% below list).
- To meet the 1% rule (rent ≥ 1% of price), the offer needs to be $120k (13.5% below list).
- Recommended offer: $120k (13.5% below list) — sets the bar for 1% rule.
- Cap rate 6.2% vs local median 2.7% in Auburn — top-decile yield for the area; either an underpriced asset or a hidden risk that comps aren't pricing in. Stress-test before assuming the spread holds.
Location & tenants
- Location reads 80/100 on livability (#6 in AL, #1,842 nationally) — a professional / high-income tenant draw. Strengths: crime A+, amenities A+, health & safety A+; Watch: commute F.
- Auburn City (urban): math 51% / reading 69% proficiency, ranked #7 of 129 in AL (top 5%) — acceptable for families but not a draw, mixed tenant base, ~2y average lease.
- Market conditions: Rents rising fast (+6.2%/yr); 359 active listings in the ZIP; 4 comparable units currently listed for rent nearby; rentals at typical pace (median 21d on market — plan ~3-4 weeks tenant-placement turnaround); lower-income renter base — watch delinquency; 1,858 units permitted in Lee County in 2024 (113 in 5+ unit buildings).
- This rent runs 34% of the median local income ($43k/yr) — at the standard rent-burdened threshold; future hikes will face affordability resistance.
Forward outlook
- Local home prices are declining (-3.0%/yr); year-one equity from $961 of loan paydown is wiped out by about $4k of value loss. Plan a longer hold.
- Lee County population projected at +54% by 2050 — long-run rental-demand tailwind backs the buy-and-hold thesis.
Negotiation context
- It's been on market 44 days — a 3% lower offer ($135k) is reasonable based on typical stale-listing flexibility.
- 11 sale attempts since 2y ago; this cycle's ask has dropped $11k (7%) from the opening price — seller is motivated, your offer sets the floor, not the list.
Risks & watch-outs
- Climate carrying-cost: major wind risk, 68% chance of damaging wind over 30y; extreme-heat days projected 7→19/yr by 2055 (HVAC capex compounding) — expect insurance premiums to compound above CPI over the hold.
Questions for the listing agent
- What do current leases actually rent for vs. the listed asking? Can we see a recent rent roll and the last 12 months of T-12 income?
- It's been on market 44 days. Have you received any prior offers? Is the seller open to a 14% concession, seller financing, or rate buy-down credit?
- Is there a deadline driving the sale (1031 exchange, divorce, estate, relocation)? That informs how much negotiation room exists.
- Schools are A-rated — typically a magnet for longer-tenancy family renters. What's the average tenant stay here, and is there a school-zone premium baked into asking?
- What's the average days-on-market for RENTAL listings here right now (not sales)? A rising rental-DOM trend means longer vacancies and softer asking-rent achievability than the comps imply.
- What's the recent tenant-quality profile in this submarket — average credit score on applications, eviction rate, late-payment / NSF rate, and stable-employment percentage? A property-management company in the area should have these aggregated.
- How much new for-sale + rental construction is in the pipeline within 1–3 miles? Heavy new supply typically softens prices + rents 12–24 months out; constrained supply supports both.
Investment metrics
- 1% rule
- 0.86% ✗
- Cap rate
- 6.20%
- Cash-on-cash
- -0.34%
- DSCR
- 0.98
- GRM
- 9.6
CMA / ARV
- ARV (median comp)
- $184,015
- List price
- $139,000
- Delta
- -24.46%
- Verdict
- UNDERPRICED
- Comps
- 20 within 1.0 mi
Show comp detail 12 sales within ~0.75 mi
| Address | Dist | Beds/Ba | Sqft | Sold | Price | $/sf | Match |
|---|---|---|---|---|---|---|---|
| 152 University Dr Unit D101 | 0.05mi | 1/1.0 | 576 | 0mo | $133,750 | $232 | 85 |
| 164 E University Dr Unit J102 | 0.11mi | 1/1.0 | 576 | 2mo | $132,000 | $229 | 81 |
| 168 E University Dr Unit L107 | 0.13mi | 1/1.0 | 576 | 4mo | $135,000 | $234 | 79 |
| 164 E University Dr Unit J204 | 0.12mi | 2/2.0 (+1) | 1,152 | 2mo | $200,000 | $174 | 71 |
| 148 E University Dr Unit B207 | 0.05mi | 2/2.5 (+1) | 1,152 | 4mo | $209,000 | $181 | 71 |
| 160 E University Dr Unit H108 | 0.17mi | 1/1.0 | 576 | 11mo | $135,000 | $234 | 70 |
| 152 E University Dr Unit D201 | 0.05mi | 2/2.5 (+1) | 1,152 | 6mo | $200,000 | $174 | 70 |
| 162 E University Dr Unit I201 | 0.14mi | 2/2.5 (+1) | 1,152 | 6mo | $200,000 | $174 | 65 |
| 154 E University Dr Unit E205 | 0.07mi | 2/2.5 (+1) | 1,152 | 10mo | $169,500 | $147 | 65 |
| 1385 S Donahue Dr #2203 | 0.37mi | 2/2.0 (+1) | 913 | 2mo | $275,000 | $301 | 60 |
| 1114 S College St #5104 | 0.51mi | 2/2.0 (+1) | 984 | 3mo | $285,000 | $290 | 52 |
| 1114 S College St #4302 | 0.56mi | 2/2.0 (+1) | 955 | 6mo | $285,000 | $298 | 48 |
Match score weights: distance 35% · size 25% · config 20% · recency 20%. Top-matched comps best support the ARV.
Projected returns pro-forma
-3.0% appreciation · 6.18% rent growth · sell at horizon
- IRR
- -13.3%
- Equity multiple
- 0.51×
- Total profit
- $-19,237
- Equity at exit
- $20,725
- IRR
- -0.1%
- Equity multiple
- 1.00×
- Total profit
- $-194
- Equity at exit
- $12,018
Cash invested: $38,920 (down + closing). Projections, not guarantees.
Landlord ↔ Tenant lean methodology
- Overall (STATE)
- 90 Strongly Landlord-Friendly
- State Alabama
- 90 Strongly Landlord-Friendly · R+15
- County
- — inherits STATE
- City
- — inherits STATE
ZIP-level market 36832
- Home prices YoY
- -23.3%
- Rents YoY
- 6.2%
- Active inventory
- 359
- Price-to-rent
- 9.6×
Monthly cashflow live
- Estimated rent
- $1,202 medium interval (Pro) →
- Mortgage (P&I)
- −$729
- Tax est. 1.5%
- −$174 /mo · $2,085/yr
- Insurance
- −$58
- HOA
- −$0
- Vacancy / Maint / Mgmt
- −$252
- Net cashflow
- $-11
Break-even live
UW: 25.0% down · 7.5% · 30yr · 1.5% tax · 5.0% vac · 8.0% maint · 8.0% mgmt
Financing live
Cash to close
- Down payment
- $34,750
- Closing costs
- $4,170
- Reserves months
- —
- Total cash needed
- —
Loan-product check · same deal, 3 products live
Conventional
25% down · 7.5% · 30yr
- Down + closing
- —
- Monthly P&I
- —
- Monthly cashflow
- —
- DSCR
- —
- Eligible?
- —
Personal DTI + credit; lowest rate.
DSCR
20% down · 8.5% · 30yr
- Down + closing
- —
- Monthly P&I
- —
- Monthly cashflow
- —
- DSCR
- —
- Eligible?
- —
No personal income docs; deal must DSCR.
Hard money
10% down · 12.0% · 12mo
- Down + closing
- —
- Monthly P&I
- —
- Monthly cashflow
- —
- DSCR
- —
- Eligible?
- —
Short-term bridge; refi at stabilization.
Rent comps 4 comps
| Address | Beds | Baths | Sqft | Rent | $/sqft | DOM | Units | Dist |
|---|---|---|---|---|---|---|---|---|
| 1385 S Donahue Dr Auburn, AL | 1.0–2.0 | 1.0–2.0 | 913 | $650 | $0.71 | 13d | 1 | 0.38mi |
| 1761 Wire Rd Auburn, AL | 2.0 | 2.5 | 1117 | $1,400 | $1.25 | 21d | 1 | 1.33mi |
| 1761 Wire Rd Auburn, AL | 2.0 | 2.5 | 1084 | $1,375 | $1.27 | 44d | 2 | 1.33mi |
| 1276 Tigers Tail Trl Auburn, AL | 2.0 | 2.5 | 1400 | $2,500 | $1.79 | 13d | 1 | 1.43mi |
Listing history 38 events
-
2026-06-18days on market $139,000 Active 44 DOM
-
2026-06-17days on market $139,000 Active 43 DOM
-
2026-06-17price $139,000 Active 42 DOM
-
2026-06-16days on market $149,000 Active 42 DOM
-
2026-06-15days on market $149,000 Active 41 DOM
-
2026-06-14days on market $149,000 Active 39 DOM
-
2026-06-13days on market $149,000 Active 38 DOM
-
2026-06-10days on market $149,000 Active 36 DOM
-
2026-06-09days on market $149,000 Active 35 DOM
-
2026-06-09price $149,000 Active 34 DOM
-
2026-06-08days on market $160,000 Active 34 DOM
-
2026-06-07days on market $160,000 Active 33 DOM
-
2026-06-05days on market $160,000 Active 30 DOM
-
2026-06-03days on market $160,000 Active 29 DOM
-
2026-06-02days on market $160,000 Active 28 DOM
-
2026-06-01days on market $160,000 Active 27 DOM
-
2026-05-31days on market $160,000 Active 26 DOM
-
2026-05-30days on market $160,000 Active 25 DOM
-
2026-05-11historical Active Under Contract 399-char remark
-
2026-05-04$150,000 Active 399-char remark
-
2026-03-06historical $900
-
2026-03-06historical $900
-
2026-02-16$900
-
2026-02-16historical $1,050
-
2025-12-06$1,050
-
2025-12-06$1,500
-
2025-09-20historical $1,000
-
2025-08-04historical $1,000
-
2025-07-30$1,000
-
2025-06-27$1,400
-
2025-06-26historical $1,390
-
2025-06-16$1,390
-
2025-01-14historical $1,300
-
2024-12-06$1,300
-
2024-12-06historical $1,400
-
2024-08-28$1,400
-
2024-08-28historical $1,400
-
2024-08-22$1,400
ⓘ Source: listings_history table (triggers on properties + properties_extension) + one-shot
backfill from property_details.listing_events for pre-trigger history.
Climate risk First Street
- Flood 1/10 Low FEMA zone X (unshaded) · 0% chance over 30 yrs
- Wildfire 4/10 Moderate
- Heat 6/10 Major 7 d/yr ≥105°F today · 19 d/yr by 30 yrs out
- Wind 6/10 Major 68% chance of damaging wind over 30 yrs
- Air quality 2/10 Low 1 unhealthy d/yr today · 1 by 30 yrs out
Nearby sold comps map
Loading sold comps map…
Walkable amenities ~0.75 mi
Loading nearby amenities…
Taxation est. · year 1
- Rental income
- $14,424
- − Mortgage interest
- −$7,786
- − Property taxes
- −$2,085
- − Insurance
- −$695
- − Repairs & maintenance
- −$1,154
- − Management
- −$1,154
- − Depreciation
- −$4,044
- Taxable loss
- −$2,493
- Est. tax savings @ 24.0%
- +$598
- After-tax cash flow
- $467/yr
For passive investors: Depreciation is non-cash, so a rental often shows a tax loss while cash-flowing — sheltering income. Rental losses are passive: they offset passive income freely, and up to $25,000/yr can offset ordinary (W-2) income if you actively participate and your MAGI is under $100k (phasing out to $0 by $150k); unused losses carry forward. On sale, claimed depreciation is recaptured at up to 25%, and gains may owe capital-gains tax (a 1031 exchange can defer both). Figures are a year-1 estimate at your 24.0% rate — not tax advice; consult a CPA.
Condition & rehab AI · 13 photos
This ground-floor condo is in good condition with recent updates, ready for a new owner. The location, amenities, and fresh paint make it an attractive investment.
Value-add opportunities
- Both Paint exterior — Enhances curb appeal and resale value.
- Both Replace outdoor lighting — Improves safety and enhances curb appeal.
- Both Upgrade flooring in living areas — Aesthetically pleasing and increases value for both resale and rental.
Renovation cost estimate screening
Value-add ROI direction
- Both Paint exterior — Enhances curb appeal and resale value. ↑
- Both Replace outdoor lighting — Improves safety and enhances curb appeal. ↑
- Both Upgrade flooring in living areas — Aesthetically pleasing and increases value for both resale and rental. ↑
ⓘ Cost ranges are severity-bucket heuristics (US national rule-of-thumb). Get contractor quotes + a written scope before underwriting a rehab budget.
Schools (NCES district)
- District
- Auburn City
- NCES district ID
- 0100210
- Math proficiency
- 51% ▼ -21.00%
- Reading proficiency
- 69% ▲ 5.00%
- Median HH income
- $38,126
- Composite
- 49.87/100
- National rank
- #1944
- State rank
- #7 of 129 in AL
Livability — Auburn
- Score
- 80/100
- State rank
- #6
- US rank
- #1842
Category grades
Schools grade is shown separately in the Schools card above.
Census & demographics
- Census place
- Auburn, AL
- County
- Lee County · 144,175 people
- City population
- 80,251
- Metro
- Auburn-Opelika, AL
- Population (ZIP)
- 30,959
- Household income
- $42,717
- Rent vs Own
- Severe rent burden
- 2503.0
Population outlook (Lee County) Hauer SSP2
- Today (2025)
- 196,440 people
- By 2030
- 217,417 · +10.7%
- By 2040
- 259,467 · +32.1%
- By 2050
- 301,557 · +53.5%
- By 2075
- 402,186 · +104.7%
- By 2100
- 474,503 · +141.6%
Race, ethnicity, and origin ACS 2023
- Neighborhood character
- Diverse neighborhood (Simpson 0.58)
- Race & ethnicity
- White 59% Black 26% Asian 6% Hispanic / Latino 6% Two or more races 4%
- Hispanic origin (detail)
- Mexican 3%
- Common ancestry
- Italian 3% Slovak 2% Serbian 1%
- Foreign-born
- 8% · South Korea, Canada, China
- Languages at home
- 89% English-only · Spanish 4% Korean 2% Chinese 1%
Political lean MEDSL · Lee
- 2024 margin
- Strong R (+27.8) · D 35.5% · R 63.3% · Other 1.2%
- 2008→2024 swing
- -8.1pp toward R · 2008: -19.8pp · 2024: -27.8pp
- All cycles
- 2024: R+27.8 2020: R+20.1 2016: R+23.1 2012: R+19.9 2008: R+19.8
Not yet ingested
- Civics
- —
Market trends
- HPI YoY
- ▼ -75.65%
- Current HPI
- 248.9059
- Rent YoY
- ▲ 6.18%
- Metro
- Auburn-Opelika, AL
- State GDP YoY
- ▲ 2.94%
- F500 in state
- 4
Industry mix (Fortune 500 HQ in AL)
| Industry | F500 HQs | Revenue |
|---|---|---|
| Financial Services | 1 | $8B |
|
||
| Healthcare | 1 | $5B |
|
||
Price history
+9828.6% since first listed24 events — show timeline
- 2026-06-16 Price Changed $139,000 LMMLS
- 2026-06-08 Price Changed $149,000 LMMLS
- 2026-05-27 Relisted — LMMLS
- 2026-05-27 Price Changed $160,000 LMMLS
- 2026-05-11 Contingent — LMMLS
- 2026-05-04 Listed $150,000 LMMLS
- 2026-03-06 Rental Removed $900 APPFOLIO
- 2026-03-06 Rental Removed $900 APPFOLIO
- 2026-02-16 Listed for Rent $900 APPFOLIO
- 2026-02-16 Rental Removed $1,050 APPFOLIO
- 2025-12-06 Listed for Rent $1,050 APPFOLIO
- 2025-12-06 Listed for Rent $1,500 APPFOLIO
- 2025-09-20 Rental Removed $1,000 APPFOLIO
- 2025-08-04 Rental Removed $1,000 APPFOLIO
- 2025-07-30 Listed for Rent $1,000 APPFOLIO
- 2025-06-27 Listed for Rent $1,400 APPFOLIO
- 2025-06-26 Rental Removed $1,390 APPFOLIO
- 2025-06-16 Listed for Rent $1,390 APPFOLIO
- 2025-01-14 Rental Removed $1,300 APPFOLIO
- 2024-12-06 Listed for Rent $1,300 APPFOLIO
- 2024-12-06 Rental Removed $1,400 APPFOLIO
- 2024-08-28 Listed for Rent $1,400 APPFOLIO
- 2024-08-28 Rental Removed $1,400 APPFOLIO
- 2024-08-22 Listed for Rent $1,400 APPFOLIO
Cash-flow waterfall
monthlySold comps — $/sqft
last 12 mo · ≤1 miLoading sold comps…