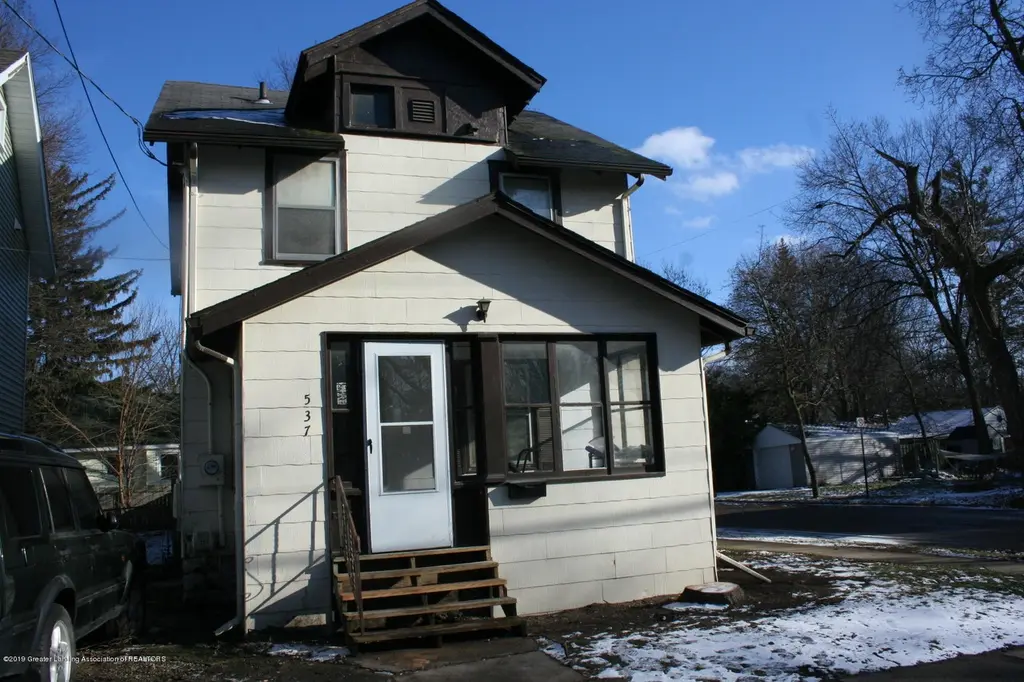
537 Lathrop St · Lansing, MI
Flood risk 4/10 · Minor
- FEMA flood zone
- X (unshaded)
- Chance of flooding over 30 yrs
- 0.24%
- Est. flood insurance / yr
- $473 – $860
Fire risk 1/10 · Minimal
- Est. fire insurance / yr
- $784 – $1,456
Heat risk 2/10 · Minimal
- Hot days now (above 96°F)
- 7 days/yr
- Hot days in 30 yrs
- 15 days/yr
Wind risk 2/10 · Minimal
- Chance of severe wind over 30 yrs
- —
Air-quality risk 2/10 · Minimal
- Unhealthy air days now
- 1 days/yr
- Unhealthy air days in 30 yrs
- 2 days/yr
Risk factors via First Street. Map © Google.
Why this score? — see what drove the C- grade
The composite is a weighted blend of 9 inputs, each scored 0–100. Each bar is that input's sub-score; the figure is the points it added to the 100-point composite (weight × sub-score).
- Cash flow +25.4/30.0
- DSCR +8.4/10.0
- 1% rule +7.4/10.0
- Rent growth +4.3/5.0
- Livability +4.0/5.0
- Condition / age +2.5/5.0
- Schools +1.9/10.0
- ARV discount +0.0/15.0
- Appreciation +0.0/10.0
$114,900
🖨 Deal sheet 📄 Offer letter ✓ Due diligence
Listing remarks
Move right into this charming 2-story home offering the perfect blend of classic character and modern updates. The bright enclosed front porch provides a welcoming entry and flexible living space, ideal for a morning coffee retreat. Inside, you'll find fresh paint, updated flooring, abundant natural light, and spacious living and dining areas designed for comfortable everyday living and entertaining. The updated kitchen features white cabinetry, modern countertops, and stainless steel appliances, creating a clean and inviting space to cook and gather. Comfortable bedrooms and neutral finishes throughout make it easy to personalize and call your own. Situated on a corner lot with convenient
Key facts
- Updated kitchen
- Enclosed front porch
- Corner lot location
Tags
Neighborhood map
What this means for you Summary
Snapshot
- This is a 3-bed/1.0-bath single-family listed at $115k.
Deal economics
- At list price, monthly cash flow is $263 ($3k/yr) — positive.
- The deal already cash-flows at list — no discount required.
- Meets the 1% rule at list price ($1k rent vs $115k).
- Recommended offer: $111k (3.0% below list) — sets the bar for market timing.
- Cap rate 9.0% vs local median 6.0% in Lansing — top-decile yield for the area; either an underpriced asset or a hidden risk that comps aren't pricing in. Stress-test before assuming the spread holds.
Location & tenants
- Location reads 79/100 on livability (#94 in MI, #2,182 nationally) — a middle-class / working-renter tenant base. Strengths: amenities A+, commute A+, cost of living A+; Watch: employment D, schools F, crime F.
- Lansing Public School District (urban): math 14% / reading 23% proficiency, ranked #650 of 760 in MI (top 86%) — low school quality limits family demand, transient renter base, plan for 1-2y turnover; 68% free/reduced lunch — lower-income household profile, screen leases tightly.
- Market conditions: Rents rising fast (+7.0%/yr); 98 active listings in the ZIP; 31 comparable units currently listed for rent nearby; rentals lingering (median 44d on market — plan ~5-8 weeks vacancy on turnover, expect pricing pressure); 61% of comp listings sitting > 30 days — soft ceiling on asking rent; 350 units permitted in Ingham County in 2024 (186 in 5+ unit buildings).
- This rent runs 31% of the median local income ($54k/yr) — at the standard rent-burdened threshold; future hikes will face affordability resistance.
Forward outlook
- Local home prices are declining (-3.0%/yr); year-one equity from $794 of loan paydown is wiped out by about $3k of value loss. Plan a longer hold.
- Ingham County population projected at +11% by 2050 — modest demand growth; plan on rents tracking national, not racing it.
- At projected returns (-3.0% appreciation + 7.0% rent growth), your $32k cash investment doubles in ~8 years — after that, you're playing with house money.
Negotiation context
- It's been on market 53 days — a 3% lower offer ($111k) is reasonable based on typical stale-listing flexibility.
- 7 sale attempts since 19y ago; this cycle's ask has dropped $15k (12%) from the opening price — seller is motivated, your offer sets the floor, not the list.
Risks & watch-outs
- Watch-outs: built in 1918 — expect roof / HVAC / electrical / plumbing capex.
Questions for the listing agent
- It's been on market 53 days. Have you received any prior offers? Is the seller open to a 3% concession, seller financing, or rate buy-down credit?
- Built in 1918 — when were the roof, HVAC, electrical panel, plumbing, and water heater last replaced?
- Is there a deadline driving the sale (1031 exchange, divorce, estate, relocation)? That informs how much negotiation room exists.
- Schools are F-rated, which usually means shorter tenancies and higher turnover. Who's the typical renter profile here, and what's been the actual vacancy rate?
- Crime grade is F in this area — have there been break-ins, vandalism, or insurance claims at this property in the last 3 years? What carrier currently insures it and at what premium?
- What's the average days-on-market for RENTAL listings here right now (not sales)? A rising rental-DOM trend means longer vacancies and softer asking-rent achievability than the comps imply.
- What's the recent tenant-quality profile in this submarket — average credit score on applications, eviction rate, late-payment / NSF rate, and stable-employment percentage? A property-management company in the area should have these aggregated.
- How much new for-sale + rental construction is in the pipeline within 1–3 miles? Heavy new supply typically softens prices + rents 12–24 months out; constrained supply supports both.
Investment metrics
- 1% rule
- 1.24% ✓
- Cap rate
- 9.04%
- Cash-on-cash
- 9.83%
- DSCR
- 1.44
- GRM
- 6.7
CMA / ARV
- ARV (median comp)
- $85,380
- List price
- $114,900
- Delta
- 34.57%
- Verdict
- OVERPRICED
- Comps
- 20 within 1.0 mi
Show comp detail 12 sales within ~0.75 mi
| Address | Dist | Beds/Ba | Sqft | Sold | Price | $/sf | Match |
|---|---|---|---|---|---|---|---|
| 400 Lathrop St | 0.16mi | 3/2.0 | 1,003 (-4%) | 1mo | $115,000 | $115 | 82 |
| 509 Clifford St | 0.08mi | 3/1.0 | 936 (-10%) | 0mo | $32,000 | $34 | 79 |
| 710 Leslie St | 0.19mi | 2/1.0 (-1) | 976 (-6%) | 0mo | $125,000 | $128 | 76 |
| 206 Custer Ave | 0.52mi | 2/1.0 (-1) | 1,040 (0%) | 2mo | $132,000 | $127 | 69 |
| 1240 Climax St | 0.35mi | 3/1.0 | 1,144 (+10%) | 0mo | $109,900 | $96 | 67 |
| 646 S Clemens Ave | 0.29mi | 3/1.0 | 912 (-12%) | 1mo | $105,100 | $115 | 65 |
| 531 S Hayford Ave | 0.49mi | 3/1.0 | 960 (-8%) | 3mo | $100,000 | $104 | 62 |
| 314 Bingham St | 0.47mi | 3/1.0 | 1,144 (+10%) | 2mo | $75,000 | $66 | 60 |
| 316 Jones St | 0.40mi | 4/1.0 (+1) | 1,176 (+13%) | 1mo | $70,500 | $60 | 54 |
| 1031 Bement St | 0.43mi | 2/1.0 (-1) | 908 (-13%) | 1mo | $106,500 | $117 | 53 |
| 404 S Hayford Ave | 0.49mi | 2/1.0 (-1) | 884 (-15%) | 2mo | $58,000 | $66 | 45 |
| 311 N Magnolia Ave | 0.74mi | 3/1.0 | 910 (-12%) | 1mo | $102,000 | $112 | 44 |
Match score weights: distance 35% · size 25% · config 20% · recency 20%. Top-matched comps best support the ARV.
Projected returns pro-forma
-3.0% appreciation · 7.02% rent growth · sell at horizon
- IRR
- 3.3%
- Equity multiple
- 1.13×
- Total profit
- $4,227
- Equity at exit
- $17,132
- IRR
- 16.5%
- Equity multiple
- 2.63×
- Total profit
- $52,304
- Equity at exit
- $9,934
Cash invested: $32,172 (down + closing). Projections, not guarantees.
Landlord ↔ Tenant lean methodology
- Overall (STATE)
- 62 Landlord-Friendly
- State Michigan
- 62 Landlord-Friendly · EVEN
- County
- — inherits STATE
- City
- — inherits STATE
ZIP-level market 48912
- Rents YoY
- 7.0%
- Active inventory
- 98
- Price-to-rent
- 6.7×
Monthly cashflow live
- Estimated rent
- $1,426 high interval (Pro) →
- Mortgage (P&I)
- −$603
- Tax from tax record
- −$213 /mo · $2,552/yr
- Insurance
- −$48
- HOA
- −$0
- Vacancy / Maint / Mgmt
- −$299
- Net cashflow
- $263
Break-even live
UW: 25.0% down · 7.5% · 30yr · 1.5% tax · 5.0% vac · 8.0% maint · 8.0% mgmt
Financing live
Cash to close
- Down payment
- $28,725
- Closing costs
- $3,447
- Reserves months
- —
- Total cash needed
- —
Loan-product check · same deal, 3 products live
Conventional
25% down · 7.5% · 30yr
- Down + closing
- —
- Monthly P&I
- —
- Monthly cashflow
- —
- DSCR
- —
- Eligible?
- —
Personal DTI + credit; lowest rate.
DSCR
20% down · 8.5% · 30yr
- Down + closing
- —
- Monthly P&I
- —
- Monthly cashflow
- —
- DSCR
- —
- Eligible?
- —
No personal income docs; deal must DSCR.
Hard money
10% down · 12.0% · 12mo
- Down + closing
- —
- Monthly P&I
- —
- Monthly cashflow
- —
- DSCR
- —
- Eligible?
- —
Short-term bridge; refi at stabilization.
Rent comps 31 comps
| Address | Beds | Baths | Sqft | Rent | $/sqft | DOM | Units | Dist |
|---|---|---|---|---|---|---|---|---|
| 409 Lathrop St Lansing, MI | 2.0 | 1.0 | 1342 | $1,500 | $1.12 | 21d | 1 | 0.11mi |
| 910 Dakin St Lansing, MI | 3.0 | 1.0 | 908 | $1,295 | $1.43 | 43d | 1 | 0.25mi |
| 329 S Clemens Ave Lansing, MI | 3.0 | 1.0 | 1194 | $1,400 | $1.17 | 21d | 1 | 0.32mi |
| 1629 E Michigan Ave Unit 306 Lansing, MI | 2.0 | 1.0 | 901 | $1,550 | $1.72 | 43d | 1 | 0.41mi |
| 1100 Malcolm X St Unit B Lansing, MI | 2.0 | 1.0 | 979 | $1,050 | $1.07 | 13d | 1 | 0.46mi |
| 1027 Climax St Lansing, MI | 3.0 | 1.5 | 1298 | $1,550 | $1.19 | 13d | 1 | 0.50mi |
| 208 S Bingham St Lansing, MI | 4.0 | 1.0 | 1020 | $1,500 | $1.47 | 13d | 1 | 0.52mi |
| 1223 Bensch St Lansing, MI | 3.0 | 1.0 | 850 | $1,200 | $1.41 | 21d | 1 | 0.57mi |
| 2222 E Michigan Ave Unit 206 Lansing, MI | 2.0 | 2.0 | 900 | $1,700 | $1.89 | 43d | 1 | 0.58mi |
| 2222 E Michigan Ave Unit 411 Lansing, MI | 2.0 | 2.0 | 900 | $1,700 | $1.89 | 21d | 1 | 0.59mi |
| 805 Bement St Unit Hosmer 507 Lansing, MI | 2.0 | 1.0 | 1120 | $1,075 | $0.96 | 43d | 1 | 0.65mi |
| 507 S Hosmer St Lansing, MI | 2.0 | 1.0 | 1120 | $1,075 | $0.96 | 43d | 1 | 0.66mi |
| 414 N Hayford Ave Lansing, MI | 3.0 | 1.0 | 990 | $1,425 | $1.44 | 43d | 1 | 0.83mi |
| 905 E Shiawassee St Unit 837-02 Lansing, MI | 2.0 | 1.0 | 800 | $750 | $0.94 | 43d | 1 | 0.86mi |
| 905 E Shiawassee St Unit 837-01 Lansing, MI | 2.0 | 1.0 | 800 | $850 | $1.06 | 43d | 1 | 0.86mi |
| 113 Pere Marquette Dr Lansing, MI | 1.0–2.0 | 1.0–2.0 | 1065 | $2,250 | $2.11 | 13d | 9 | 0.90mi |
| 335 E Saint Joseph St Unit 6 Lansing, MI | 2.0 | 1.0 | 700 | $949 | $1.36 | 43d | 1 | 1.01mi |
| 730 Johnson Ave Lansing, MI | 2.0 | 1.0 | 840 | $1,225 | $1.46 | 43d | 1 | 1.04mi |
| 824 Cleveland St Lansing, MI | 2.0 | 1.0 | 839 | $1,150 | $1.37 | 21d | 1 | 1.07mi |
| 605 S Grand Ave Unit 2 Lansing, MI | 4.0 | 1.0 | 1200 | $1,100 | $0.92 | 43d | 1 | 1.14mi |
| 936 N Fairview Ave Lansing, MI | 1.0–2.0 | 1.0 | 825 | $1,245 | $1.51 | 43d | 2 | 1.19mi |
| 401 S Washington Sq Unit 205 Lansing, MI | 2.0 | 1.0 | 968 | $1,355 | $1.40 | 43d | 1 | 1.22mi |
| 401 S Washington Sq Unit 201 Lansing, MI | 3.0 | 1.0 | 1254 | $1,560 | $1.24 | 43d | 1 | 1.22mi |
| 1102 Clark St Lansing, MI | 3.0 | 1.0 | 1232 | $1,550 | $1.26 | 21d | 1 | 1.24mi |
| 620 May St Lansing, MI | 1.0–2.0 | 1.0–2.0 | 1126 | $1,578 | $1.40 | 13d | 12 | 1.25mi |
| 920 S Washington Ave Lansing, MI | 1.0–2.0 | 1.0–2.0 | 900 | $1,250 | $1.39 | 13d | 1 | 1.30mi |
| 2620 Senate Dr Lansing, MI | 1.0–2.0 | 1.0–2.0 | 950 | $1,800 | $1.89 | 43d | 1 | 1.33mi |
| 832 N Larch St Apt 3 Lansing, MI | 2.0 | 1.0 | 890 | $1,095 | $1.23 | 43d | 1 | 1.35mi |
| 1228 N Fairview Ave Lansing, MI | 3.0 | 2.0 | 1100 | $1,700 | $1.55 | 43d | 1 | 1.40mi |
| 1245 Weber Dr Unit 2 Lansing, MI | 2.0 | 1.0 | 700 | $1,250 | $1.79 | 43d | 1 | 1.49mi |
| 1115 Chester Rd Unit Two Bedroom Lansing, MI | 2.0 | 1.5 | 1100 | $1,200 | $1.09 | 43d | 1 | 1.50mi |
Listing history 33 events
-
2026-06-18days on market $114,900 Active 53 DOM
-
2026-06-17days on market $114,900 Active 52 DOM
-
2026-06-16days on market $114,900 Active 51 DOM
-
2026-06-15days on market $114,900 Active 50 DOM
-
2026-06-14days on market $114,900 Active 48 DOM
-
2026-06-13days on market $114,900 Active 47 DOM
-
2026-06-10days on market $114,900 Active 45 DOM
-
2026-06-09days on market $114,900 Active 44 DOM
-
2026-06-08days on market $114,900 Active 43 DOM
-
2026-06-07days on market $114,900 Active 42 DOM
-
2026-06-05remarks 699-char remark
-
2026-06-05pricedays on market $114,900 Active 39 DOM
-
2026-06-03days on market $119,900 Active 38 DOM
-
2026-06-02days on market $119,900 Active 37 DOM
-
2026-06-01days on market $119,900 Active 36 DOM
-
2026-05-31days on market $119,900 Active 35 DOM
-
2026-05-30days on market $119,900 Active 34 DOM
-
2026-05-04historical
-
2026-04-16price $119,900
-
2026-04-16price $119,900
-
2026-04-09$129,900 Active
-
2026-04-09$129,900 Active
-
2026-01-05soldstatus $537,500
-
2019-01-17soldstatus $35,000
-
2019-01-17soldstatus $35,000
-
2019-01-04$39,900
-
2019-01-04$39,900
-
2016-06-01soldstatus $21,900
-
2016-06-01soldstatus $21,900
-
2015-03-23$28,900
-
2015-03-23$28,900
-
2008-01-30historical
-
2007-10-03$50,900
ⓘ Source: listings_history table (triggers on properties + properties_extension) + one-shot
backfill from property_details.listing_events for pre-trigger history.
Tax reassessment forecast MI · Partial reset (capped growth)
- Current annual tax
- $2,552 · $213/mo
- Projected year-2 tax
- $2,552 · $213/mo
- Expected delta
- $0/yr ($0/mo · 0.0%)
ⓘ Screening estimate from a state-policy table — verify with the county assessor before closing.
Climate risk First Street
- Flood 4/10 Moderate FEMA zone X (unshaded) · 24% chance over 30 yrs
- Wildfire 1/10 Low
- Heat 2/10 Low 7 d/yr ≥96°F today · 15 d/yr by 30 yrs out
- Wind 2/10 Low
- Air quality 2/10 Low 1 unhealthy d/yr today · 2 by 30 yrs out
Nearby sold comps map
Loading sold comps map…
Walkable amenities ~0.75 mi
Loading nearby amenities…
Taxation est. · year 1
- Rental income
- $17,112
- − Mortgage interest
- −$6,436
- − Property taxes
- −$2,552
- − Insurance
- −$574
- − Repairs & maintenance
- −$1,369
- − Management
- −$1,369
- − Depreciation
- −$3,343
- Taxable income
- $1,469
- Est. tax owed @ 24.0%
- −$353
- After-tax cash flow
- $2,809/yr
For passive investors: Depreciation is non-cash, so a rental often shows a tax loss while cash-flowing — sheltering income. Rental losses are passive: they offset passive income freely, and up to $25,000/yr can offset ordinary (W-2) income if you actively participate and your MAGI is under $100k (phasing out to $0 by $150k); unused losses carry forward. On sale, claimed depreciation is recaptured at up to 25%, and gains may owe capital-gains tax (a 1031 exchange can defer both). Figures are a year-1 estimate at your 24.0% rate — not tax advice; consult a CPA.
Schools (NCES district)
- District
- Lansing Public School District
- NCES district ID
- 2621150
- Math proficiency
- 14% ▲ 1.00%
- Reading proficiency
- 23% ▲ 3.00%
- Median HH income
- $37,453
- Composite
- 18.76/100
- National rank
- #14002
- State rank
- #650 of 760 in MI
Livability — Lansing
- Score
- 79/100
- State rank
- #94
- US rank
- #2182
Category grades
Schools grade is shown separately in the Schools card above.
Census & demographics
- Census place
- Lansing, MI
- County
- Ingham County · 237,052 people
- City population
- 161,269
- Metro
- Lansing-East Lansing, MI
- Population (ZIP)
- 17,674
- Household income
- $54,429
- Rent vs Own
- Severe rent burden
- 1171.0
Population outlook (Ingham County) Hauer SSP2
- Today (2025)
- 300,362 people
- By 2030
- 307,808 · +2.5%
- By 2040
- 320,492 · +6.7%
- By 2050
- 333,223 · +10.9%
- By 2075
- 373,693 · +24.4%
- By 2100
- 392,021 · +30.5%
Race, ethnicity, and origin ACS 2023
- Neighborhood character
- Diverse neighborhood (Simpson 0.62)
- Race & ethnicity
- White 56% Black 22% Two or more races 12% Hispanic / Latino 10% Asian 4%
- Hispanic origin (detail)
- Mexican 6% Cuban 1%
- Common ancestry
- Romanian 5% Iranian 4% Lithuanian 3%
- Foreign-born
- 12% · Canada, Vietnam, China
- Languages at home
- 84% English-only · Spanish 5% French/Haitian/Cajun 1% Korean 1%
Political lean MEDSL · Ingham
- 2024 margin
- Strong D (+29.7) · D 63.9% · R 34.2% · Other 2.0%
- 2008→2024 swing
- -3.6pp toward R · 2008: 33.3pp · 2024: 29.7pp
- All cycles
- 2024: D+29.7 2020: D+32.2 2016: D+27.6 2012: D+27.9 2008: D+33.3
Not yet ingested
- Civics
- —
Market trends
- HPI YoY
- ▼ -167.67%
- Current HPI
- 171.1549
- Rent YoY
- ▲ 7.02%
- Metro
- Lansing-East Lansing, MI
- State GDP YoY
- ▲ 1.37%
- F500 in state
- 28
Industry mix (Fortune 500 HQ in MI)
| Industry | F500 HQs | Revenue |
|---|---|---|
| Automotive Parts | 3 | $48B |
|
||
| Automotive | 2 | $372B |
|
||
| Chemicals | 1 | $45B |
|
||
| Automotive Retail | 1 | $29B |
|
||
| Healthcare / Medical Devices | 1 | $23B |
|
||
| Automotive Technology | 1 | $20B |
|
||
Price history
+135.6% since first listed16 events — show timeline
- 2026-05-04 Listing Removed — Greater Lansing AoR
- 2026-04-16 Price Changed $119,900 REALCOMP
- 2026-04-16 Price Changed $119,900 Greater Lansing AoR
- 2026-04-09 Listed $129,900 REALCOMP
- 2026-04-09 Listed $129,900 Greater Lansing AoR
- 2026-01-05 Sold (Public Records) $537,500 Public Records
- 2019-01-17 Sold (MLS) $35,000 Greater Lansing AoR
- 2019-01-17 Sold (MLS) $35,000 REALCOMP
- 2019-01-04 Listed $39,900 Greater Lansing AoR
- 2019-01-04 Listed $39,900 REALCOMP
- 2016-06-01 Sold (MLS) $21,900 Greater Lansing AoR
- 2016-06-01 Sold (MLS) $21,900 REALCOMP
- 2015-03-23 Listed $28,900 Greater Lansing AoR
- 2015-03-23 Listed $28,900 REALCOMP
- 2008-01-30 Listing Removed — Greater Lansing AoR
- 2007-10-03 Listed $50,900 Greater Lansing AoR
Property tax history
+4.9%/yrLatest (2025): $2,552 · +3.0% YoY. Source: county tax records.
Cash-flow waterfall
monthlySold comps — $/sqft
last 12 mo · ≤1 miLoading sold comps…