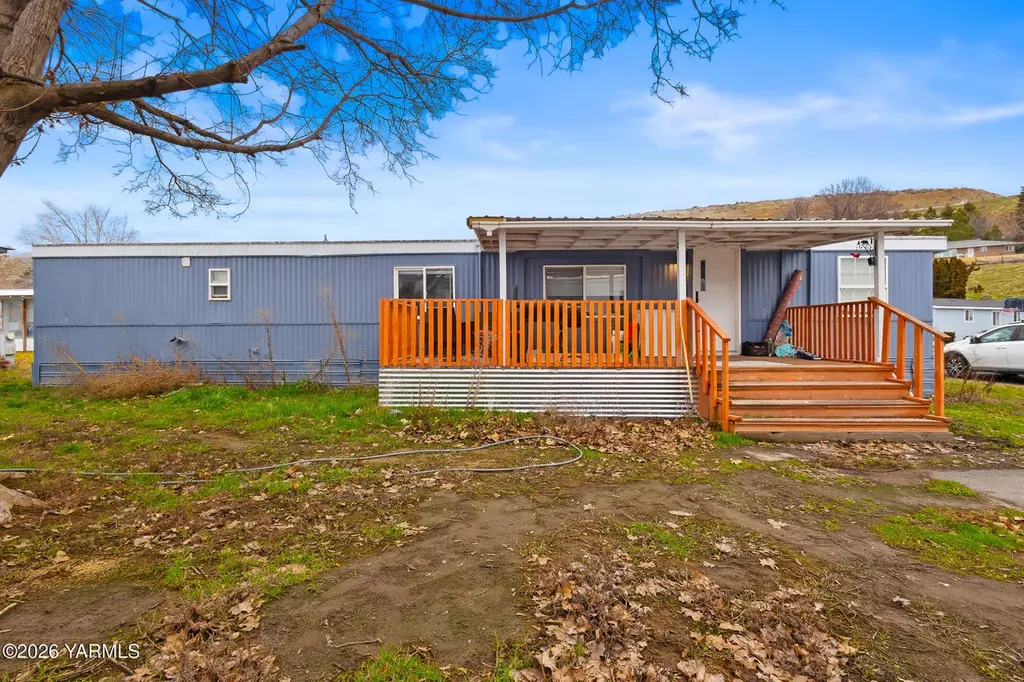
2205 Butterfield Rd #241 · Terrace Heights, WA
Flood risk 6/10 · Moderate
- FEMA flood zone
- X (unshaded)
- Chance of flooding over 30 yrs
- 0.27%
- Est. flood insurance / yr
- $507 – $1,088
Fire risk 6/10 · Moderate
- Est. fire insurance / yr
- $604 – $1,122
Heat risk 4/10 · Minor
- Hot days now (above 96°F)
- 7 days/yr
- Hot days in 30 yrs
- 14 days/yr
Wind risk 1/10 · Minimal
- Chance of severe wind over 30 yrs
- —
Air-quality risk 9/10 · Severe
- Unhealthy air days now
- 16 days/yr
- Unhealthy air days in 30 yrs
- 19 days/yr
Risk factors via First Street. Map © Google.
Why this score? — see what drove the B- grade
The composite is a weighted blend of 9 inputs, each scored 0–100. Each bar is that input's sub-score; the figure is the points it added to the 100-point composite (weight × sub-score).
- Cash flow +30.0/30.0
- 1% rule +10.0/10.0
- DSCR +10.0/10.0
- Schools +5.1/10.0
- Rent growth +4.8/5.0
- Livability +3.6/5.0
- Condition / age +2.5/5.0
- ARV discount +0.0/15.0
- Appreciation +0.0/10.0
$49,000
🖨 Deal sheet 📄 Offer letter ✓ Due diligence
Listing remarks MLS
Cozy 2 Bed 1 Bath in Skyline Estates - all ages welcome. This home offers a functional layout, comfortable living space and access to shopping. Tucked in the Terrace Heights community this home offers affordable living in a great area.
Key facts
- Access to shopping
- Functional layout
- Built 1980
Tags
Neighborhood map
What this means for you Summary
Snapshot
- This is a 2-bed/1.0-bath single-family listed at $49k.
Deal economics
- At list price, monthly cash flow is $438 ($5k/yr) — positive.
- The deal already cash-flows at list — no discount required.
- Meets the 1% rule at list price ($921 rent vs $49k).
- Recommended offer: $43k (12.0% below list) — sets the bar for market timing.
- Cap rate 17.0% vs local median 2.7% in Terrace Heights — top-decile yield for the area; either an underpriced asset or a hidden risk that comps aren't pricing in. Stress-test before assuming the spread holds.
Location & tenants
- Location reads 72/100 on livability (#210 in WA) — a middle-class / working-renter tenant base. Strengths: housing A+, health & safety A+, employment A; Watch: schools D, amenities F, commute F.
- East Valley School District (Yakima) (suburban): math 54% / reading 61% proficiency, ranked #76 of 291 in WA (top 26%) — acceptable for families but not a draw, mixed tenant base, ~2y average lease.
- Market conditions: Rents rising fast (+9.3%/yr); 168 active listings in the ZIP; 9 comparable units currently listed for rent nearby; rentals leasing fast (median 14d on market — plan ~1-2 weeks tenant-placement turnaround); 468 units permitted in Yakima County in 2024 (23 in 5+ unit buildings).
Forward outlook
- Local home prices are declining (-3.0%/yr); year-one equity from $339 of loan paydown is wiped out by about $1k of value loss. Plan a longer hold.
- Yakima County population projected at +6% by 2050 — modest demand growth; plan on rents tracking national, not racing it.
- At projected returns (-3.0% appreciation + 8.0% rent growth), your $14k cash investment doubles in ~3 years — after that, you're playing with house money.
Negotiation context
- It's been on market 133 days — a 12% lower offer ($43k) is reasonable based on typical stale-listing flexibility.
- Current owner paid $6k; list at $49k implies a 654% gain — meaningful room to come down on a strong offer.
Risks & watch-outs
- Climate carrying-cost: major flood risk; major wildfire risk — expect insurance premiums to compound above CPI over the hold.
Questions for the listing agent
- It's been on market 133 days. Have you received any prior offers? Is the seller open to a 12% concession, seller financing, or rate buy-down credit?
- Why hasn't it sold? Are there any deal-killer items the seller is aware of (foundation, flood, title, zoning, code violations)?
- Is there a deadline driving the sale (1031 exchange, divorce, estate, relocation)? That informs how much negotiation room exists.
- Schools are D-rated, which usually means shorter tenancies and higher turnover. Who's the typical renter profile here, and what's been the actual vacancy rate?
- What's the average days-on-market for RENTAL listings here right now (not sales)? A rising rental-DOM trend means longer vacancies and softer asking-rent achievability than the comps imply.
- What's the recent tenant-quality profile in this submarket — average credit score on applications, eviction rate, late-payment / NSF rate, and stable-employment percentage? A property-management company in the area should have these aggregated.
- How much new for-sale + rental construction is in the pipeline within 1–3 miles? Heavy new supply typically softens prices + rents 12–24 months out; constrained supply supports both.
Investment metrics
- 1% rule
- 1.88% ✓
- Cap rate
- 17.03%
- Cash-on-cash
- 38.34%
- DSCR
- 2.71
- GRM
- 4.4
CMA / ARV
- ARV (median comp)
- $36,055
- List price
- $49,000
- Delta
- 35.90%
- Verdict
- OVERPRICED
- Comps
- 2 within 1.0 mi
Projected returns pro-forma
-3.0% appreciation · 8.0% rent growth · sell at horizon
- IRR
- 39.7%
- Equity multiple
- 2.81×
- Total profit
- $24,831
- Equity at exit
- $7,306
- IRR
- 48.3%
- Equity multiple
- 6.81×
- Total profit
- $79,666
- Equity at exit
- $4,237
Cash invested: $13,720 (down + closing). Projections, not guarantees.
Landlord ↔ Tenant lean methodology
- Overall (STATE)
- 28 Tenant-Leaning
- State Washington
- 28 Tenant-Leaning · D+8
- County
- — inherits STATE
- City
- — inherits STATE
ZIP-level market 98901
- Home prices YoY
- -33.4%
- Rents YoY
- 9.3%
- Active inventory
- 168
- Price-to-rent
- 4.4×
Monthly cashflow live
- Estimated rent
- $921 high interval (Pro) →
- Mortgage (P&I)
- −$257
- Tax from tax record
- −$12 /mo · $145/yr
- Insurance
- −$20
- HOA
- −$0
- Vacancy / Maint / Mgmt
- −$193
- Net cashflow
- $438
Break-even live
UW: 25.0% down · 7.5% · 30yr · 1.5% tax · 5.0% vac · 8.0% maint · 8.0% mgmt
Financing live
Cash to close
- Down payment
- $12,250
- Closing costs
- $1,470
- Reserves months
- —
- Total cash needed
- —
Loan-product check · same deal, 3 products live
Conventional
25% down · 7.5% · 30yr
- Down + closing
- —
- Monthly P&I
- —
- Monthly cashflow
- —
- DSCR
- —
- Eligible?
- —
Personal DTI + credit; lowest rate.
DSCR
20% down · 8.5% · 30yr
- Down + closing
- —
- Monthly P&I
- —
- Monthly cashflow
- —
- DSCR
- —
- Eligible?
- —
No personal income docs; deal must DSCR.
Hard money
10% down · 12.0% · 12mo
- Down + closing
- —
- Monthly P&I
- —
- Monthly cashflow
- —
- DSCR
- —
- Eligible?
- —
Short-term bridge; refi at stabilization.
Rent comps 9 comps
| Address | Beds | Baths | Sqft | Rent | $/sqft | DOM | Units | Dist |
|---|---|---|---|---|---|---|---|---|
| 1205 E Spruce St Yakima, WA | 2.0–4.0 | 2.0 | 1023 | $950 | $0.93 | 13d | 1 | 1.16mi |
| 20 S Fair Ave Unit 2 Yakima, WA | 1.0 | 1.0 | 752 | $850 | $1.13 | 13d | 1 | 1.21mi |
| 201 N 10th St Unit 11 Yakima, WA | 1.0 | 1.0 | 550 | $950 | $1.73 | 13d | 1 | 1.24mi |
| 201 N 10th St Yakima, WA | 1.0 | 1.0 | 550 | $950 | $1.73 | 44d | 2 | 1.24mi |
| 201 N 10th St Unit 13 Yakima, WA | 1.0 | 1.0 | 550 | $900 | $1.64 | 13d | 1 | 1.24mi |
| 106 S 10th St Unit 106-2 Yakima, WA | 1.0 | 1.0 | 528 | $850 | $1.61 | 21d | 1 | 1.32mi |
| 106 S 10th St Unit 108-9 Yakima, WA | 1.0 | 1.0 | 528 | $850 | $1.61 | 44d | 1 | 1.32mi |
| 1017 E Spruce St Unit 1017 1/2 Yakima, WA | 1.0 | 1.0 | 875 | $825 | $0.94 | 13d | 1 | 1.33mi |
| 115 S Union St Unit D-2 Yakima, WA | 1.0 | 1.0 | 643 | $950 | $1.48 | 13d | 1 | 1.40mi |
Listing history 19 events
-
2026-06-19days on market $49,000 Active 133 DOM
-
2026-06-18days on market $49,000 Active 132 DOM
-
2026-06-17days on market $49,000 Active 131 DOM
-
2026-06-16days on market $49,000 Active 130 DOM
-
2026-06-15days on market $49,000 Active 129 DOM
-
2026-06-14days on market $49,000 Active 127 DOM
-
2026-06-13days on market $49,000 Active 126 DOM
-
2026-06-10days on market $49,000 Active 124 DOM
-
2026-06-09days on market $49,000 Active 123 DOM
-
2026-06-08days on market $49,000 Active 122 DOM
-
2026-06-07days on market $49,000 Active 121 DOM
-
2026-06-03days on market $49,000 Active 117 DOM
-
2026-06-02days on market $49,000 Active 116 DOM
-
2026-06-01days on market $49,000 Active 115 DOM
-
2026-05-31days on market $49,000 Active 114 DOM
-
2026-05-30days on market $49,000 Active 113 DOM
-
2026-04-06price $49,000 235-char remark
Show marketing remark (235 chars)
Cozy 2 Bed 1 Bath in Skyline Estates - all ages welcome. This home offers a functional layout, comfortable living space and access to shopping. Tucked in the Terrace Heights community this home offers affordable living in a great area.
-
2026-02-07$53,000 Active 235-char remark
Show marketing remark (235 chars)
Cozy 2 Bed 1 Bath in Skyline Estates - all ages welcome. This home offers a functional layout, comfortable living space and access to shopping. Tucked in the Terrace Heights community this home offers affordable living in a great area.
-
1990-09-10soldstatus $6,500
ⓘ Source: listings_history table (triggers on properties + properties_extension) + one-shot
backfill from property_details.listing_events for pre-trigger history.
Tax reassessment forecast WA · Resets to sale price
- Current annual tax
- $145 · $12/mo
- Projected year-2 tax
- $480 · $40/mo
- Expected delta
- +$335/yr (+$28/mo · 230.1%)
ⓘ Screening estimate from a state-policy table — verify with the county assessor before closing.
Climate risk First Street
- Flood 6/10 Major FEMA zone X (unshaded) · 27% chance over 30 yrs
- Wildfire 6/10 Major
- Heat 4/10 Moderate 7 d/yr ≥96°F today · 14 d/yr by 30 yrs out
- Wind 1/10 Low
- Air quality 9/10 Extreme 16 unhealthy d/yr today · 19 by 30 yrs out
Nearby sold comps map
Loading sold comps map…
Walkable amenities ~0.75 mi
Loading nearby amenities…
Taxation est. · year 1
- Rental income
- $11,056
- − Mortgage interest
- −$2,745
- − Property taxes
- −$145
- − Insurance
- −$245
- − Repairs & maintenance
- −$884
- − Management
- −$884
- − Depreciation
- −$1,425
- Taxable income
- $4,726
- Est. tax owed @ 24.0%
- −$1,134
- After-tax cash flow
- $4,126/yr
For passive investors: Depreciation is non-cash, so a rental often shows a tax loss while cash-flowing — sheltering income. Rental losses are passive: they offset passive income freely, and up to $25,000/yr can offset ordinary (W-2) income if you actively participate and your MAGI is under $100k (phasing out to $0 by $150k); unused losses carry forward. On sale, claimed depreciation is recaptured at up to 25%, and gains may owe capital-gains tax (a 1031 exchange can defer both). Figures are a year-1 estimate at your 24.0% rate — not tax advice; consult a CPA.
Schools (NCES district)
- District
- East Valley School District (Yakima)
- NCES district ID
- 5305370
- Math proficiency
- 54% ▲ 1.00%
- Reading proficiency
- 61% ▲ 5.00%
- Median HH income
- $57,936
- Composite
- 51.46/100
- National rank
- #3682
- State rank
- #76 of 291 in WA
Livability — Terrace Heights
- Score
- 72/100
- State rank
- #210
- US rank
- #5906
Category grades
Schools grade is shown separately in the Schools card above.
Census & demographics
- Census place
- Terrace Heights, WA
- County
- Yakima County · 134,789 people
- Metro
- Yakima, WA
- Population (ZIP)
- 31,366
- Household income
- $57,392
- Rent vs Own
- Severe rent burden
- 1317.0
Population outlook (Yakima County) Hauer SSP2
- Today (2025)
- 256,514 people
- By 2030
- 259,403 · +1.1%
- By 2040
- 265,677 · +3.6%
- By 2050
- 273,061 · +6.5%
- By 2075
- 296,991 · +15.8%
- By 2100
- 315,291 · +22.9%
Race, ethnicity, and origin ACS 2023
- Neighborhood character
- Majority Hispanic (54%)
- Race & ethnicity
- Hispanic / Latino 54% White 39% Two or more races 22% Native American 3% Black 1%
- Hispanic origin (detail)
- Mexican 49%
- Common ancestry
- Italian 3% Lithuanian 2% Scottish 1%
- Foreign-born
- 20% · Canada
- Languages at home
- 53% English-only · Spanish 46%
Political lean MEDSL · Yakima
- 2024 margin
- R (+14.3) · D 41.6% · R 55.9% · Other 2.5%
- 2008→2024 swing
- -3.8pp toward R · 2008: -10.6pp · 2024: -14.3pp
- All cycles
- 2024: R+14.3 2020: R+7.7 2016: R+15.4 2012: R+15.1 2008: R+10.6
Not yet ingested
- Civics
- —
Market trends
- HPI YoY
- ▼ -144.24%
- Current HPI
- 287.8283
- Rent YoY
- ▲ 9.31%
- Metro
- Yakima, WA
- State GDP YoY
- ▲ 4.65%
- F500 in state
- 22
Industry mix (Fortune 500 HQ in WA)
| Industry | F500 HQs | Revenue |
|---|---|---|
| Retail | 2 | $269B |
|
||
| Technology / Retail | 1 | $638B |
|
||
| Technology | 1 | $245B |
|
||
| Telecommunications | 1 | $38B |
|
||
| Food / Beverage | 1 | $36B |
|
||
| Automotive / Trucks | 1 | $34B |
|
||
Price history
+653.8% since first listed3 events — show timeline
- 2026-04-06 Price Changed $49,000 YAMLS
- 2026-02-07 Listed $53,000 YAMLS
- 1990-09-10 Sold (Public Records) $6,500 Public Records
Property tax history
+4.5%/yrLatest (2026): $145 · +2.8% YoY. Source: county tax records.
Cash-flow waterfall
monthlySold comps — $/sqft
last 12 mo · ≤1 miLoading sold comps…