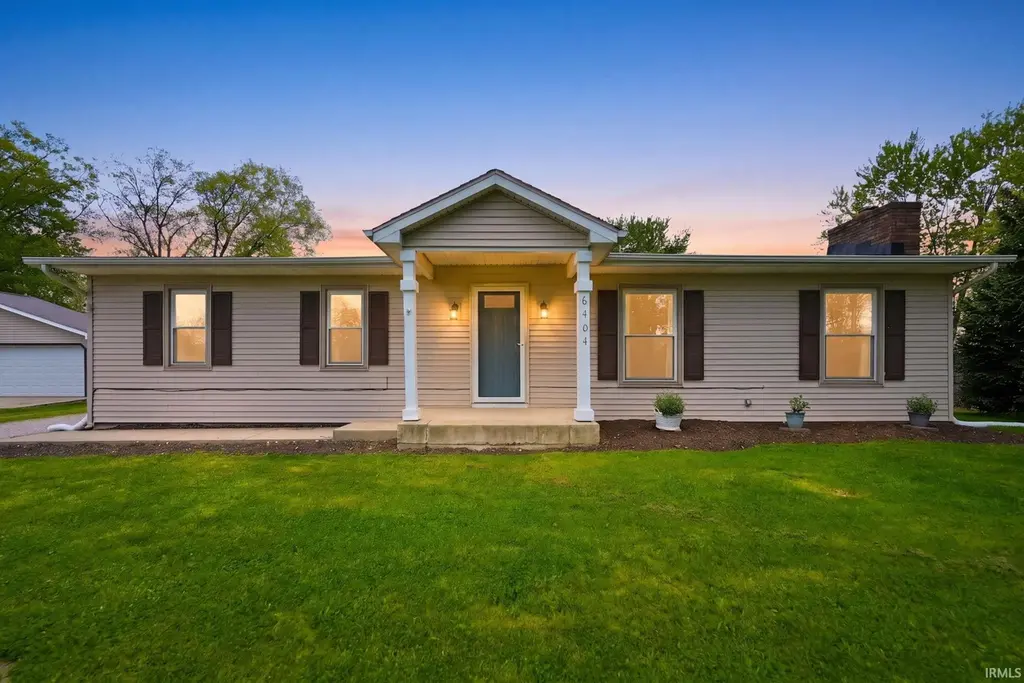
6404 Revere Pl · Fort Wayne, IN
Flood risk 1/10 · Minimal
- FEMA flood zone
- X (unshaded)
- Chance of flooding over 30 yrs
- 0.0%
- Est. flood insurance / yr
- $507 – $1,088
Fire risk 1/10 · Minimal
- Est. fire insurance / yr
- $717 – $1,331
Heat risk 3/10 · Minor
- Hot days now (above 100°F)
- 7 days/yr
- Hot days in 30 yrs
- 17 days/yr
Wind risk 2/10 · Minimal
- Chance of severe wind over 30 yrs
- —
Air-quality risk 3/10 · Minor
- Unhealthy air days now
- 2 days/yr
- Unhealthy air days in 30 yrs
- 3 days/yr
Risk factors via First Street. Map © Google.
Why this score? — see what drove the C grade
The composite is a weighted blend of 9 inputs, each scored 0–100. Each bar is that input's sub-score; the figure is the points it added to the 100-point composite (weight × sub-score).
- Cash flow +17.9/30.0
- ARV discount +15.0/15.0
- DSCR +5.6/10.0
- Rent growth +4.7/5.0
- Livability +4.2/5.0
- 1% rule +3.9/10.0
- Condition / age +2.5/5.0
- Schools +2.2/10.0
- Appreciation +0.0/10.0
$186,500
🖨 Deal sheet (PDF) 📄 Offer letter ✓ Due diligence
Listing remarks
Welcome to 6404 Revere Place in Northeast Fort Wayne — a one-story home offering space, functionality, and an incredible nearly half-acre lot in a highly convenient location near Maplecrest and I-469.With approximately 1,300 square feet of living space, this 3-bedroom, 1.5-bath home features a comfortable and practical layout designed for everyday living. The spacious living room showcases a cozy wood-burning fireplace and flows seamlessly into the dining area and kitchen, creating a connected living space perfect for gatherings and entertaining. Just off the kitchen, you’ll find a separate utility and laundry area for added convenience. Outside is where this property truly shin
Key facts
- 0.46 acre lot
- 2 garage spots
- Built 1960
Property features AI
Finance
- Other: Property listed as residential single-family
- Financial info: Financial details not specified
- HOA & community: HOA information not specified
Exterior
- Parking: Detached garage with garage door opener; Off-street parking; 2-car garage
- Security: Smoke detectors
- Utilities: Public water; Public sewer; Cable connected
- Home design: Single-family residence, site-built; One-story
- Construction: Vinyl siding; Crawl space foundation; Built as site-built home
- Exterior features: Covered porch; Patio; Wood privacy fencing; Level lot; Paved road access; Lot dimensions approximately 100 x 200 (0.46 acres)
Interior
- Kitchen: Disposal; Dishwasher; Refrigerator; Electric range
- Bedrooms: Bedroom count not specified (total rooms: 6)
- Flooring: Flooring details not specified
- Bathrooms: One full bathroom; One half bathroom; Two main-level bathrooms
- Heating & cooling: Natural gas forced-air heating; Central air conditioning
- Interior features: Master suite on the main level; Living room fireplace
- Laundry & utility: Main level laundry with electric dryer hookup; Gas water heater
Neighborhood map
What this means for you Summary
Snapshot
- This is a 3-bed/1.5-bath single-family listed at $186k.
Deal economics
- At list price, monthly cash flow is $158 ($2k/yr) — positive.
- The deal already cash-flows at list — no discount required.
- To meet the 1% rule (rent ≥ 1% of price), the offer needs to be $167k (10.7% below list).
- Recommended offer: $167k (10.7% below list) — sets the bar for 1% rule.
- Cap rate 7.3% vs local median 4.7% in Fort Wayne — top-decile yield for the area; either an underpriced asset or a hidden risk that comps aren't pricing in. Stress-test before assuming the spread holds.
Location & tenants
- Location reads 84/100 on livability (#6 in IN, #676 nationally) — a professional / high-income tenant draw. Strengths: amenities A+, commute A+, cost of living A+; Watch: crime C-, employment D+.
- Fort Wayne Community Schools (urban): math 22% / reading 29% proficiency, ranked #263 of 301 in IN (top 87%) — low school quality limits family demand, transient renter base, plan for 1-2y turnover; 60% free/reduced lunch — lower-income household profile, screen leases tightly.
- Zoned schools: Saint Joseph Central School (math 37% / reading 29%, grade F, #639 of 994 statewide, top 65%, 397 students, 48% FRL); Jefferson Middle School (math 22% / reading 29%, grade F, #243 of 330 statewide, top 74%, 682 students, 58% FRL); Northrop High School (math 25% / reading 62%, grade F, #191 of 369 statewide, top 52%, 2,136 students, 54% FRL).
- Market conditions: Rents rising fast (+8.9%/yr); 180 active listings in the ZIP; 7 comparable units currently listed for rent nearby; rentals at typical pace (median 23d on market — plan ~3-4 weeks tenant-placement turnaround); solid renter incomes; 1,861 units permitted in Allen County in 2024 (576 in 5+ unit buildings).
Forward outlook
- Local home prices are declining (-3.0%/yr); year-one equity from $1k of loan paydown is wiped out by about $6k of value loss. Plan a longer hold.
- Allen County population projected at +10% by 2050 — modest demand growth; plan on rents tracking national, not racing it.
- At projected returns (-3.0% appreciation + 8.0% rent growth), your $52k cash investment doubles in ~10 years — after that, you're playing with house money.
Negotiation context
- Only 2 days on market — expect competitive offers; lowballing is unlikely to land.
Questions for the listing agent
- Built in 1960 — when were the roof, HVAC, electrical panel, plumbing, and water heater last replaced?
- Is there a deadline driving the sale (1031 exchange, divorce, estate, relocation)? That informs how much negotiation room exists.
- Schools are D-rated, which usually means shorter tenancies and higher turnover. Who's the typical renter profile here, and what's been the actual vacancy rate?
- What's the average days-on-market for RENTAL listings here right now (not sales)? A rising rental-DOM trend means longer vacancies and softer asking-rent achievability than the comps imply.
- What's the recent tenant-quality profile in this submarket — average credit score on applications, eviction rate, late-payment / NSF rate, and stable-employment percentage? A property-management company in the area should have these aggregated.
- How much new for-sale + rental construction is in the pipeline within 1–3 miles? Heavy new supply typically softens prices + rents 12–24 months out; constrained supply supports both.
Investment metrics
- 1% rule
- 0.89% ✗
- Cap rate
- 7.31%
- Cash-on-cash
- 3.62%
- DSCR
- 1.16
- GRM
- 9.3
CMA / ARV
- ARV (median comp)
- $234,586
- List price
- $186,500
- Delta
- -20.50%
- Verdict
- UNDERPRICED
- Comps
- 20 within 1.0 mi
Show comp detail 12 sales within ~0.75 mi
| Address | Dist | Beds/Ba | Sqft | Sold | Price | $/sf | Match |
|---|---|---|---|---|---|---|---|
| 6423 Verandah Ln | 0.06mi | 3/2.0 | 1,310 (+1%) | 1mo | $235,000 | $179 | 94 |
| 6232 Verandah Ln | 0.11mi | 3/2.0 | 1,399 (+8%) | 1mo | $252,000 | $180 | 80 |
| 6302 Rockingham Dr | 0.34mi | 3/2.0 | 1,246 (-4%) | 1mo | $285,000 | $229 | 74 |
| 6705 Creekwood Ln | 0.45mi | 3/2.0 | 1,293 (-0%) | 3mo | $265,000 | $205 | 74 |
| 6397 Hunter Wood Dr | 0.34mi | 3/2.0 | 1,351 (+4%) | 7mo | $296,900 | $220 | 70 |
| 6717 Creekwood Ln | 0.42mi | 3/2.0 | 1,244 (-4%) | 6mo | $225,000 | $181 | 66 |
| 5925 Gate Tree Ln | 0.30mi | 3/2.0 | 1,438 (+11%) | 1mo | $250,000 | $174 | 65 |
| 7314 Wood Meadows Ln | 0.16mi | 4/2.0 (+1) | 1,462 (+12%) | 4mo | $267,500 | $183 | 62 |
| 6903 Wolfsboro Ln | 0.37mi | 3/2.0 | 1,452 (+12%) | 8mo | $195,000 | $134 | 55 |
| 6207 Prestwick Run | 0.62mi | 3/2.0 | 1,211 (-7%) | 4mo | $254,995 | $211 | 54 |
| 6211 Brandonwood Ln | 0.72mi | 3/2.0 | 1,196 (-8%) | 4mo | $58,000 | $48 | 48 |
| 6813 Hunterdon Cv | 0.55mi | 3/2.0 | 1,492 (+15%) | 8mo | $235,000 | $158 | 41 |
Match score weights: distance 35% · size 25% · config 20% · recency 20%. Top-matched comps best support the ARV.
Projected returns pro-forma
-3.0% appreciation · 8.0% rent growth · sell at horizon
- IRR
- -5.6%
- Equity multiple
- 0.78×
- Total profit
- $-11,442
- Equity at exit
- $27,808
- IRR
- 8.9%
- Equity multiple
- 1.82×
- Total profit
- $42,794
- Equity at exit
- $16,125
Cash invested: $52,220 (down + closing). Projections, not guarantees.
Landlord ↔ Tenant lean methodology
- Overall (STATE)
- 90 Strongly Landlord-Friendly
- State Indiana
- 90 Strongly Landlord-Friendly · R+11
- County
- — inherits STATE
- City
- — inherits STATE
ZIP-level market 46835
- Rents YoY
- 8.9%
- Active inventory
- 180
- Price-to-rent
- 9.3×
Monthly cashflow live
- Estimated rent
- $1,666 high interval (Pro) →
- Mortgage (P&I)
- −$978
- Tax from tax record
- −$103 /mo · $1,232/yr
- Insurance
- −$78
- HOA
- −$0
- Vacancy / Maint / Mgmt
- −$350
- Net cashflow
- $158
Break-even live
Sensitivity live
| Price | -10% $263 | -5% $210 | +0% $158 | +5% $105 | +10% $52 |
|---|---|---|---|---|---|
| Rent | -10% $26 | -5% $92 | +0% $158 | +5% $223 | +10% $289 |
| Rate | -1.0pp $251 | -0.5pp $205 | base $158 | +0.5pp $109 | +1.0pp $60 |
UW: 25.0% down · 7.5% · 30yr · 1.5% tax · 5.0% vac · 8.0% maint · 8.0% mgmt
Financing live
Cash to close
- Down payment
- $46,625
- Closing costs
- $5,595
- Reserves months
- —
- Total cash needed
- —
Loan-product check · same deal, 3 products live
Conventional
25% down · 7.5% · 30yr
- Down + closing
- —
- Monthly P&I
- —
- Monthly cashflow
- —
- DSCR
- —
- Eligible?
- —
Personal DTI + credit; lowest rate.
DSCR
20% down · 8.5% · 30yr
- Down + closing
- —
- Monthly P&I
- —
- Monthly cashflow
- —
- DSCR
- —
- Eligible?
- —
No personal income docs; deal must DSCR.
Hard money
10% down · 12.0% · 12mo
- Down + closing
- —
- Monthly P&I
- —
- Monthly cashflow
- —
- DSCR
- —
- Eligible?
- —
Short-term bridge; refi at stabilization.
Rent comps 7 comps
| Address | Beds | Baths | Sqft | Rent | $/sqft | DOM | Units | Dist |
|---|---|---|---|---|---|---|---|---|
| 7911 Sedgewick Pl Fort Wayne, IN | 3.0 | 2.5 | 1806 | $1,950 | $1.08 | 45d | 1 | 0.53mi |
| 6031 Evard Rd Fort Wayne, IN | 2.0 | 2.0 | 1200 | $1,600 | $1.33 | 22d | 1 | 0.75mi |
| 6031 Evard Rd Fort Wayne, IN | 2.0 | 2.0 | 1200 | $1,600 | $1.33 | 45d | 4 | 0.75mi |
| 6835 Solid Rock Dr Fort Wayne, IN | 2.0 | 2.0 | 1200 | $1,600 | $1.33 | 15d | 1 | 0.75mi |
| 5450 Kinzie Ct Fort Wayne, IN | 2.0 | 2.0 | 1294 | $1,992 | $1.54 | 15d | 2 | 0.81mi |
| 8422 Lionsgate Run Fort Wayne, IN | 3.0 | 2.5 | 1560 | $1,999 | $1.28 | 15d | 1 | 0.93mi |
| 5438 Evard Rd Fort Wayne, IN | 2.0 | 1.5 | 918 | $1,249 | $1.36 | 22d | 1 | 1.09mi |
Listing history 3 events
-
2026-05-16status Pending 1932-char remark
-
2026-05-14$186,500 Active 1932-char remark
-
2026-05-12historical $186,500 1932-char remark
ⓘ Source: listings_history table (triggers on properties + properties_extension) + one-shot
backfill from property_details.listing_events for pre-trigger history.
Tax reassessment forecast IN · Partial reset (capped growth)
- Current annual tax
- $1,232 · $103/mo
- Projected year-2 tax
- $1,408 · $117/mo
- Expected delta
- +$177/yr (+$15/mo · 14.4%)
ⓘ Screening estimate from a state-policy table — verify with the county assessor before closing.
Climate risk First Street
- Flood 1/10 Low FEMA zone X (unshaded) · 0% chance over 30 yrs
- Wildfire 1/10 Low
- Heat 3/10 Moderate 7 d/yr ≥100°F today · 17 d/yr by 30 yrs out
- Wind 2/10 Low
- Air quality 3/10 Moderate 2 unhealthy d/yr today · 3 by 30 yrs out
Nearby sold comps map
Loading sold comps map…
Walkable amenities ~0.75 mi
Loading nearby amenities…
Taxation est. · year 1
- Rental income
- $19,988
- − Mortgage interest
- −$10,447
- − Property taxes
- −$1,232
- − Insurance
- −$932
- − Repairs & maintenance
- −$1,599
- − Management
- −$1,599
- − Depreciation
- −$5,425
- Taxable loss
- −$1,247
- Est. tax savings @ 24.0%
- +$299
- After-tax cash flow
- $2,189/yr
For passive investors: Depreciation is non-cash, so a rental often shows a tax loss while cash-flowing — sheltering income. Rental losses are passive: they offset passive income freely, and up to $25,000/yr can offset ordinary (W-2) income if you actively participate and your MAGI is under $100k (phasing out to $0 by $150k); unused losses carry forward. On sale, claimed depreciation is recaptured at up to 25%, and gains may owe capital-gains tax (a 1031 exchange can defer both). Figures are a year-1 estimate at your 24.0% rate — not tax advice; consult a CPA.
Schools (NCES district)
- District
- Fort Wayne Community Schools
- NCES district ID
- 1803630
- Math proficiency
- 22% ▼ -11.00%
- Reading proficiency
- 29% ▼ -7.00%
- Median HH income
- $41,951
- Composite
- 21.68/100
- National rank
- #8275
- State rank
- #263 of 301 in IN
Livability — Fort Wayne
- Score
- 84/100
- State rank
- #6
- US rank
- #676
Category grades
Schools grade is shown separately in the Schools card above.
Census & demographics
- Census place
- Fort Wayne, IN
- County
- Allen County · 326,813 people
- City population
- 326,813
- Metro
- Fort Wayne, IN
- Population (ZIP)
- 38,166
- Household income
- $77,152
- Rent vs Own
- Severe rent burden
- 961.0
Population outlook (Allen County) Hauer SSP2
- Today (2025)
- 394,020 people
- By 2030
- 405,128 · +2.8%
- By 2040
- 423,476 · +7.5%
- By 2050
- 435,137 · +10.4%
- By 2075
- 450,293 · +14.3%
- By 2100
- 424,101 · +7.6%
Race, ethnicity, and origin ACS 2023
- Neighborhood character
- Predominantly White (77%)
- Race & ethnicity
- White 77% Two or more races 10% Hispanic / Latino 8% Black 6% Asian 3%
- Hispanic origin (detail)
- Mexican 6%
- Common ancestry
- Italian 3% Lithuanian 3% Romanian 2%
- Foreign-born
- 6% · Canada, Vietnam, Philippines
- Languages at home
- 91% English-only · Spanish 3% Other Asian/Pacific 2% Other Indo-European 1%
Political lean MEDSL · Allen
- 2024 margin
- R (+12.5) · D 42.9% · R 55.4% · Other 1.7%
- 2008→2024 swing
- -8.1pp toward R · 2008: -4.3pp · 2024: -12.5pp
- All cycles
- 2024: R+12.5 2020: R+11.2 2016: R+19.6 2012: R+16.8 2008: R+4.3
Not yet ingested
- Civics
- —
Market trends
- HPI YoY
- ▼ -236.62%
- Current HPI
- 236.3419
- Rent YoY
- ▲ 8.95%
- Metro
- Fort Wayne, IN
- State GDP YoY
- ▲ 2.90%
- F500 in state
- 18
Industry mix (Fortune 500 HQ in IN)
| Industry | F500 HQs | Revenue |
|---|---|---|
| Industrial Machinery | 2 | $37B |
|
||
| Healthcare | 1 | $177B |
|
||
| Pharmaceuticals | 1 | $45B |
|
||
| Metals / Steel | 1 | $18B |
|
||
| Agriculture | 1 | $17B |
|
||
| Packaging | 1 | $12B |
|
||
Price history
+0.0% since first listed3 events — show timeline
- 2026-05-16 Pending — IRMLS
- 2026-05-14 Listed $186,500 IRMLS
- 2026-05-12 Coming Soon $186,500 IRMLS
Property tax history
+4.8%/yrLatest (2024): $1,232 · +15.0% YoY. Source: county tax records.
Cash-flow waterfall
monthlySold comps — $/sqft
last 12 mo · ≤1 miLoading sold comps…