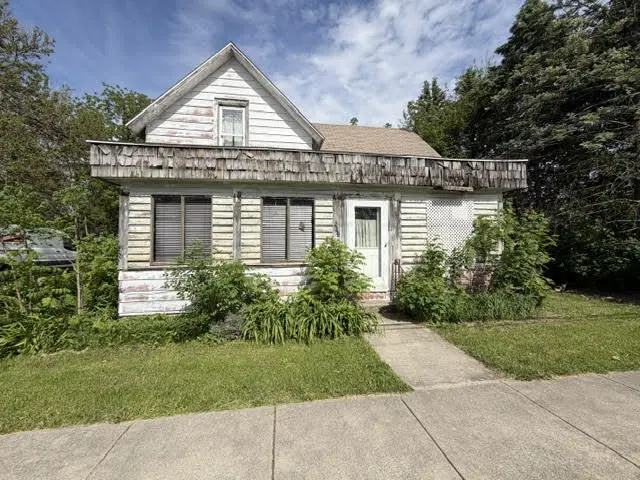
413 S Range St · Wolcott, IN
Flood risk 1/10 · Minimal
- FEMA flood zone
- X (unshaded)
- Chance of flooding over 30 yrs
- 0.0%
- Est. flood insurance / yr
- $507 – $1,088
Fire risk 1/10 · Minimal
- Est. fire insurance / yr
- $717 – $1,331
Heat risk 3/10 · Minor
- Hot days now (above 101°F)
- 7 days/yr
- Hot days in 30 yrs
- 17 days/yr
Wind risk 2/10 · Minimal
- Chance of severe wind over 30 yrs
- 0.0%
Air-quality risk 2/10 · Minimal
- Unhealthy air days now
- 1 days/yr
- Unhealthy air days in 30 yrs
- 2 days/yr
Risk factors via First Street. Map © Google.
Why this score? — see what drove the B+ grade
The composite is a weighted blend of 9 inputs, each scored 0–100. Each bar is that input's sub-score; the figure is the points it added to the 100-point composite (weight × sub-score).
- Cash flow +30.0/30.0
- 1% rule +10.0/10.0
- DSCR +10.0/10.0
- Appreciation +8.4/10.0
- ARV discount +7.5/15.0
- Livability +3.5/5.0
- Schools +3.4/10.0
- Rent growth +2.5/5.0
- Condition / age +2.5/5.0
$80,000
🖨 Deal sheet 📄 Offer letter ✓ Due diligence
Listing remarks
Opportunity knocks with this spacious 4-bedroom home offering nearly 1,900 square feet of living space and an attached 2-car garage. Packed with potential, this fixer-upper is ready for renovation and your personal touch. The functional floor plan provides generous room sizes and plenty of space to reimagine and customize. The roof is approximately 13 years old. Whether you're an investor, flipper, or buyer looking to build equity, this property presents an excellent opportunity. Conveniently located in the heart of Wolcott with easy access to local amenities and major routes. Property is being sold As-Is.
Key facts
- Attached garage
- Generous room sizes
- 0.27 acre lot
Tags
Property features AI
Finance
- Other: Property vacant
Exterior
- Parking: Attached garage; 2 garage spaces
- Utilities: Public water; Public sewer
- Home design: One and one half story; Built in 1900; Fixer condition
- Construction: Year built 1900
- Exterior features: Neighborhood view
Interior
- Kitchen: Range
- Bedrooms: Primary bedroom; Bedroom 2; Bedroom 3; Bedroom 4
- Bathrooms: 1 full bathroom
- Heating & cooling: Forced air heating (natural gas); No cooling
- Interior features: Eat-in kitchen; Loft; Den
- Laundry & utility: Crawl space basement
Neighborhood map
What this means for you Summary
Snapshot
- This is a 3-bed/1.0-bath single-family listed at $80k.
Deal economics
- At list price, monthly cash flow is $467 ($6k/yr) — positive.
- The deal already cash-flows at list — no discount required.
- Meets the 1% rule at list price ($1k rent vs $80k).
Location & tenants
- Location reads 70/100 on livability (#168 in IN) — a middle-class / working-renter tenant base. Strengths: crime A+, cost of living A+, housing A+; Watch: amenities F, commute F, health & safety F.
- Tri-County School Corporation (rural): math 36% / reading 42% proficiency, ranked #146 of 301 in IN (top 48%) — families likely to look elsewhere, expect single-tenant / working-renter base with shorter leases.
- Market conditions: 4 active listings in the ZIP; 47 units permitted in White County in 2024 (0 in 5+ unit buildings).
Forward outlook
- In year one you build about $6k of equity ($553 loan paydown + $5k appreciation (6.8% local appreciation)).
- White County population projected at -19% by 2050 — secular population decline; favor cash flow + early exit over multi-decade hold.
- At projected returns (6.8% appreciation + 3.0% rent growth), your $22k cash investment doubles in ~2 years — after that, you're playing with house money.
- By year 6, paydown + projected appreciation supports a ~$33k cash-out refi (75% LTV) — recoverable capital for the next deal without selling this one.
Negotiation context
- Only 9 days on market — expect competitive offers; lowballing is unlikely to land.
Risks & watch-outs
- Watch-outs: built in 1900 — expect roof / HVAC / electrical / plumbing capex.
Questions for the listing agent
- Built in 1900 — when were the roof, HVAC, electrical panel, plumbing, and water heater last replaced?
- Is there a deadline driving the sale (1031 exchange, divorce, estate, relocation)? That informs how much negotiation room exists.
- What's the average days-on-market for RENTAL listings here right now (not sales)? A rising rental-DOM trend means longer vacancies and softer asking-rent achievability than the comps imply.
- What's the recent tenant-quality profile in this submarket — average credit score on applications, eviction rate, late-payment / NSF rate, and stable-employment percentage? A property-management company in the area should have these aggregated.
- How much new for-sale + rental construction is in the pipeline within 1–3 miles? Heavy new supply typically softens prices + rents 12–24 months out; constrained supply supports both.
Investment metrics
- 1% rule
- 1.59% ✓
- Cap rate
- 13.29%
- Cash-on-cash
- 25.00%
- DSCR
- 2.11
- GRM
- 5.2
CMA / ARV
- ARV (on-the-fly)
- $212,464
- Comps found
- 4
Show comp detail 4 sales within ~0.75 mi
| Address | Dist | Beds/Ba | Sqft | Sold | Price | $/sf | Match |
|---|---|---|---|---|---|---|---|
| 206 E Johnson St | 0.38mi | 2/1.5 (-1) | 1,844 (-3%) | 9mo | $182,500 | $99 | 63 |
| 406 W Anderson St | 0.29mi | 3/2.0 | 1,650 (-13%) | 7mo | $185,000 | $112 | 55 |
| 107 N Homer Ln | 0.43mi | 3/2.0 | 1,777 (-6%) | 20mo | $235,000 | $132 | 49 |
| 302 W Johnson St | 0.39mi | 4/2.0 (+1) | 2,096 (+10%) | 8mo | $216,000 | $103 | 48 |
Match score weights: distance 35% · size 25% · config 20% · recency 20%. Top-matched comps best support the ARV.
Projected returns pro-forma
6.8% appreciation · 3.0% rent growth · sell at horizon
- IRR
- 37.8%
- Equity multiple
- 3.53×
- Total profit
- $56,707
- Equity at exit
- $54,413
- IRR
- 34.5%
- Equity multiple
- 7.37×
- Total profit
- $142,717
- Equity at exit
- $102,446
Cash invested: $22,400 (down + closing). Projections, not guarantees.
Landlord ↔ Tenant lean methodology
- Overall (STATE)
- 90 Strongly Landlord-Friendly
- State Indiana
- 90 Strongly Landlord-Friendly · R+11
- County
- — inherits STATE
- City
- — inherits STATE
ZIP-level market 47995
- Home prices YoY
- 2.6%
- Active inventory
- 4
- Price-to-rent
- 5.2×
Monthly cashflow live
- Estimated rent
- $1,272 medium interval (Pro) →
- Mortgage (P&I)
- −$420
- Tax from tax record
- −$85 /mo · $1,019/yr
- Insurance
- −$33
- HOA
- −$0
- Vacancy / Maint / Mgmt
- −$267
- Net cashflow
- $467
Break-even live
UW: 25.0% down · 7.5% · 30yr · 1.5% tax · 5.0% vac · 8.0% maint · 8.0% mgmt
Financing live
Cash to close
- Down payment
- $20,000
- Closing costs
- $2,400
- Reserves months
- —
- Total cash needed
- —
Loan-product check · same deal, 3 products live
Conventional
25% down · 7.5% · 30yr
- Down + closing
- —
- Monthly P&I
- —
- Monthly cashflow
- —
- DSCR
- —
- Eligible?
- —
Personal DTI + credit; lowest rate.
DSCR
20% down · 8.5% · 30yr
- Down + closing
- —
- Monthly P&I
- —
- Monthly cashflow
- —
- DSCR
- —
- Eligible?
- —
No personal income docs; deal must DSCR.
Hard money
10% down · 12.0% · 12mo
- Down + closing
- —
- Monthly P&I
- —
- Monthly cashflow
- —
- DSCR
- —
- Eligible?
- —
Short-term bridge; refi at stabilization.
Listing history 8 events
-
2026-06-19statusdays on market $80,000 Active 9 DOM
-
2026-06-10status $80,000 Pending 8 DOM
-
2026-06-09days on market $80,000 Active 8 DOM
-
2026-06-08days on market $80,000 Active 7 DOM
-
2026-06-07days on market $80,000 Active 6 DOM
-
2026-06-03days on market $80,000 Active 2 DOM
-
2026-06-01remarks 613-char remark
-
2026-06-01$80,000 Active 1 DOM
ⓘ Source: listings_history table (triggers on properties + properties_extension) + one-shot
backfill from property_details.listing_events for pre-trigger history.
Tax reassessment forecast IN · Partial reset (capped growth)
- Current annual tax
- $1,019 · $85/mo
- Projected year-2 tax
- $1,019 · $85/mo
- Expected delta
- $0/yr ($0/mo · 0.0%)
ⓘ Screening estimate from a state-policy table — verify with the county assessor before closing.
Climate risk First Street
- Flood 1/10 Low FEMA zone X (unshaded) · 0% chance over 30 yrs
- Wildfire 1/10 Low
- Heat 3/10 Moderate 7 d/yr ≥101°F today · 17 d/yr by 30 yrs out
- Wind 2/10 Low 0% chance of damaging wind over 30 yrs
- Air quality 2/10 Low 1 unhealthy d/yr today · 2 by 30 yrs out
Nearby sold comps map
Loading sold comps map…
Walkable amenities ~0.75 mi
Loading nearby amenities…
Taxation est. · year 1
- Rental income
- $15,258
- − Mortgage interest
- −$4,481
- − Property taxes
- −$1,019
- − Insurance
- −$400
- − Repairs & maintenance
- −$1,221
- − Management
- −$1,221
- − Depreciation
- −$2,327
- Taxable income
- $4,589
- Est. tax owed @ 24.0%
- −$1,101
- After-tax cash flow
- $4,499/yr
For passive investors: Depreciation is non-cash, so a rental often shows a tax loss while cash-flowing — sheltering income. Rental losses are passive: they offset passive income freely, and up to $25,000/yr can offset ordinary (W-2) income if you actively participate and your MAGI is under $100k (phasing out to $0 by $150k); unused losses carry forward. On sale, claimed depreciation is recaptured at up to 25%, and gains may owe capital-gains tax (a 1031 exchange can defer both). Figures are a year-1 estimate at your 24.0% rate — not tax advice; consult a CPA.
Schools (NCES district)
- District
- Tri-County School Corporation
- NCES district ID
- 1811430
- Math proficiency
- 36% ▼ -17.00%
- Reading proficiency
- 42% ▼ -16.00%
- Median HH income
- $52,924
- Composite
- 33.93/100
- National rank
- #5336
- State rank
- #146 of 301 in IN
Livability — Wolcott
- Score
- 70/100
- State rank
- #168
- US rank
- #7979
Category grades
Schools grade is shown separately in the Schools card above.
Census & demographics
- Census place
- Wolcott, IN
- Population (ZIP)
- 1,809
Population outlook (White County) Hauer SSP2
- Today (2025)
- 23,006 people
- By 2030
- 22,204 · -3.5%
- By 2040
- 20,441 · -11.1%
- By 2050
- 18,711 · -18.7%
- By 2075
- 14,989 · -34.8%
- By 2100
- 10,896 · -52.6%
Race, ethnicity, and origin ACS 2023
- Neighborhood character
- Predominantly White (90%)
- Race & ethnicity
- White 90% Hispanic / Latino 5% Black 3% Asian 1% Two or more races 1%
- Common ancestry
- Lithuanian 3% Iranian 1% Serbian 1%
- Foreign-born
- 3% · Canada
- Languages at home
- 96% English-only · Spanish 2% Tagalog/Filipino 1% German/W. Germanic 1%
Political lean MEDSL · White
- 2024 margin
- Solid R (+45.0) · D 26.4% · R 71.4% · Other 2.2%
- 2008→2024 swing
- -36.7pp toward R · 2008: -8.3pp · 2024: -45.0pp
- All cycles
- 2024: R+45.0 2020: R+44.1 2016: R+42.9 2012: R+23.6 2008: R+8.3
Not yet ingested
- Civics
- —
Market trends
- HPI YoY
- ▲ 6.80%
- Current HPI
- 271.9339
- Rent YoY
- —
- Metro
- —
- State GDP YoY
- ▲ 2.90%
- F500 in state
- 18
Industry mix (Fortune 500 HQ in IN)
| Industry | F500 HQs | Revenue |
|---|---|---|
| Industrial Machinery | 2 | $37B |
|
||
| Healthcare | 1 | $177B |
|
||
| Pharmaceuticals | 1 | $45B |
|
||
| Metals / Steel | 1 | $18B |
|
||
| Agriculture | 1 | $17B |
|
||
| Packaging | 1 | $12B |
|
||
Price history
1 event — show timeline
- 2026-06-01 Listed $80,000 NIRA MLS as Distributed by MLS Grid
Property tax history
-3.8%/yrLatest (2024): $1,019 · +7.9% YoY. Source: county tax records.
Cash-flow waterfall
monthlySold comps — $/sqft
last 12 mo · ≤1 miLoading sold comps…