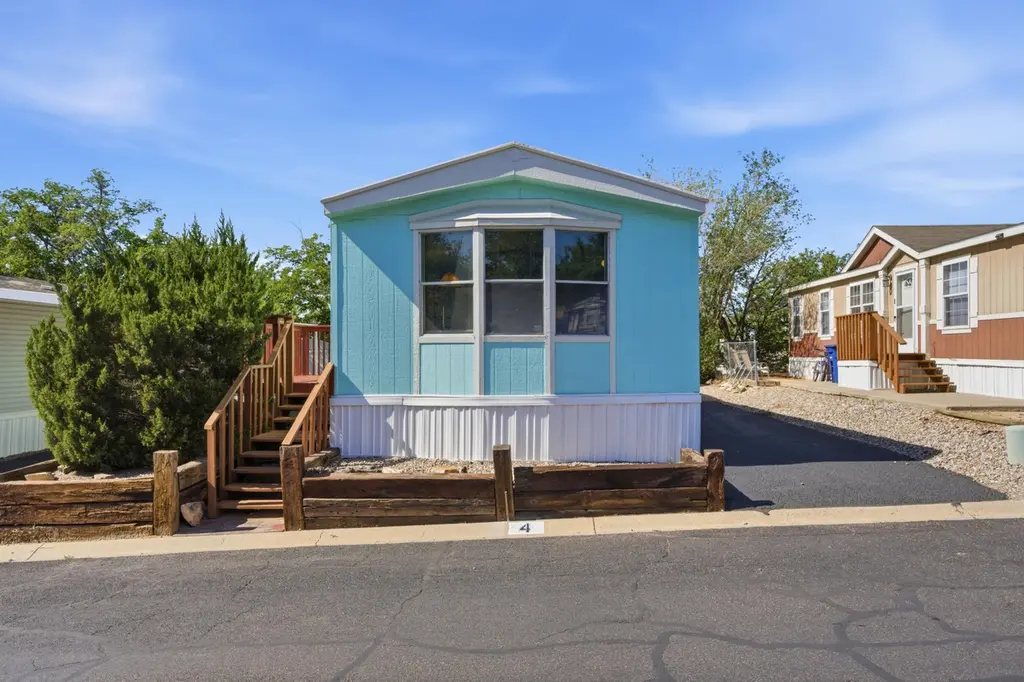
7401 San Pedro Dr NE Trlr 4 · Albuquerque, NM
Flood risk 1/10 · Minimal
- FEMA flood zone
- X (unshaded)
- Chance of flooding over 30 yrs
- 0.0%
- Est. flood insurance / yr
- $507 – $1,088
Fire risk 1/10 · Minimal
- Est. fire insurance / yr
- $706 – $1,312
Heat risk 4/10 · Minor
- Hot days now (above 95°F)
- 6 days/yr
- Hot days in 30 yrs
- 15 days/yr
Wind risk 1/10 · Minimal
- Chance of severe wind over 30 yrs
- —
Air-quality risk 3/10 · Minor
- Unhealthy air days now
- 3 days/yr
- Unhealthy air days in 30 yrs
- 3 days/yr
Risk factors via First Street. Map © Google.
Why this score? — see what drove the D+ grade
The composite is a weighted blend of 9 inputs, each scored 0–100. Each bar is that input's sub-score; the figure is the points it added to the 100-point composite (weight × sub-score).
- Cash flow +15.0/30.0
- ARV discount +7.5/15.0
- Schools +5.3/10.0
- 1% rule +5.0/10.0
- DSCR +5.0/10.0
- Livability +3.6/5.0
- Condition / age +2.5/5.0
- Rent growth +2.3/5.0
- Appreciation +0.0/10.0
$34,000
🖨 Deal sheet (PDF) 📄 Offer letter ✓ Due diligence
Listing remarks
Affordable living near Paseo del Norte and I-25 in Thesman Communities, serving Albuquerque since 1980. This 811 sq ft single-wide offers 2 bedrooms, 1 bath and carpet throughout. Enjoy the recently refurbished front deck, central ducted heating, and swamp cooler cooling. All appliances stay, including washer and dryer. Lot rent $626/month. Cash or chattel financing available. Easy access to shopping, dining, and freeway commutes.
Key facts
- Swamp cooler cooling
- Parking
- Built 1990
Tags
Property features AI
Finance
- Other: Zoning: R-MC*
- Financial info: Monthly land lease: $626
- HOA & community: Leased land (land lease applies)
Exterior
- Parking: Carport with 1 space
- Utilities: Electricity connected; Public water; Public sewer
- Home design: Single-story; Entry level: 1; West-facing; Resale
- Construction: Metal roof; Built by Palm, model 1052; Mobile home 54' x 14'
- Exterior features: Deck; Landscaped; City street frontage; Paved road
Interior
- Kitchen: Free-standing gas range; Dishwasher; Refrigerator
- Bedrooms: Two bedrooms on the main level
- Flooring: Carpet
- Bathrooms: One full bathroom
- Heating & cooling: Forced air heating (natural gas); Evaporative cooling
- Interior features: Ceiling fans; Single-pane windows; Main level primary
- Laundry & utility: Washer and dryer included; Electric dryer hookup
Neighborhood map
What this means for you Summary
Snapshot
- This is a 2-bed/1.0-bath manufactured listed at $34k.
Deal economics
- At list price, monthly cash flow is $1k ($15k/yr) — positive.
- The deal already cash-flows at list — no discount required.
- Meets the 1% rule at list price ($2k rent vs $34k).
- Recommended offer: $33k (1.5% below list) — sets the bar for market timing.
- Cap rate 49.5% vs local median 3.6% in Albuquerque — top-decile yield for the area; either an underpriced asset or a hidden risk that comps aren't pricing in. Stress-test before assuming the spread holds.
Location & tenants
- Location reads 72/100 on livability (#13 in NM) — a middle-class / working-renter tenant base. Strengths: amenities A+, commute A+, cost of living A+; Watch: crime F.
- Albuquerque Public Schools (urban): math 51% / reading 75% proficiency, ranked #3 of 29 in NM (top 10%) — acceptable for families but not a draw, mixed tenant base, ~2y average lease; 60% free/reduced lunch — lower-income household profile, screen leases tightly.
- Zoned schools: Edmund G Ross Elementary (405 students, 100% FRL); Mckinley Middle (486 students, 100% FRL); Del Norte High (1,070 students, 100% FRL) — zoned schools average 100% FRL vs 60% district-wide (40 pts higher); higher-poverty schools than district average — tighter screening recommended.
- Market conditions: Rents soft (-1.0%/yr); 158 active listings in the ZIP; 11 comparable units currently listed for rent nearby; rentals leasing fast (median 5d on market — plan ~1-2 weeks tenant-placement turnaround); 1,316 units permitted in Bernalillo County in 2024 (546 in 5+ unit buildings).
- This rent runs 38% of the median local income ($59k/yr) — at the standard rent-burdened threshold; future hikes will face affordability resistance.
Forward outlook
- Local home prices are declining (-3.0%/yr); year-one equity from $235 of loan paydown is wiped out by about $1k of value loss. Plan a longer hold.
- At projected returns (-3.0% appreciation + 0.0% rent growth), your $10k cash investment doubles in ~1 year — after that, you're playing with house money.
Negotiation context
- It's been on market 21 days — a 2% lower offer ($33k) is reasonable based on typical stale-listing flexibility.
Questions for the listing agent
- Is there a deadline driving the sale (1031 exchange, divorce, estate, relocation)? That informs how much negotiation room exists.
- Schools are D-rated, which usually means shorter tenancies and higher turnover. Who's the typical renter profile here, and what's been the actual vacancy rate?
- Crime grade is F in this area — have there been break-ins, vandalism, or insurance claims at this property in the last 3 years? What carrier currently insures it and at what premium?
- The area grade is low — what's the realistic commute time and amenity access for the typical tenant pool here? Any planned neighborhood developments (good or bad) we should know about?
- What's the average days-on-market for RENTAL listings here right now (not sales)? A rising rental-DOM trend means longer vacancies and softer asking-rent achievability than the comps imply.
- What's the recent tenant-quality profile in this submarket — average credit score on applications, eviction rate, late-payment / NSF rate, and stable-employment percentage? A property-management company in the area should have these aggregated.
- How much new for-sale + rental construction is in the pipeline within 1–3 miles? Heavy new supply typically softens prices + rents 12–24 months out; constrained supply supports both.
Investment metrics
- 1% rule
- 5.43% ✓
- Cap rate
- 49.52%
- Cash-on-cash
- 154.39%
- DSCR
- 7.87
- GRM
- 1.5
CMA / ARV
- ARV (median comp)
- $20,532
- List price
- $34,000
- Delta
- 65.59%
- Verdict
- OVERPRICED
- Comps
- 2 within 1.0 mi
Show comp detail 1 sale within ~0.75 mi
| Address | Dist | Beds/Ba | Sqft | Sold | Price | $/sf | Match |
|---|---|---|---|---|---|---|---|
| 7112 E Pan American Fwy NE #259 | 0.26mi | 2/1.0 | 910 (+12%) | 8mo | $26,000 | $29 | 61 |
Match score weights: distance 35% · size 25% · config 20% · recency 20%. Top-matched comps best support the ARV.
Projected returns pro-forma
-3.0% appreciation · 0.0% rent growth · sell at horizon
- IRR
- —
- Equity multiple
- 8.05×
- Total profit
- $67,111
- Equity at exit
- $5,070
- IRR
- —
- Equity multiple
- 15.50×
- Total profit
- $138,072
- Equity at exit
- $2,940
Cash invested: $9,520 (down + closing). Projections, not guarantees.
Landlord ↔ Tenant lean methodology
- Overall (STATE)
- 55 Moderately Landlord-Leaning
- State New Mexico
- 55 Moderately Landlord-Leaning · D+3
- County
- — inherits STATE
- City
- — inherits STATE
ZIP-level market 87109
- Rents YoY
- -1.0%
- Active inventory
- 158
- Price-to-rent
- 1.5×
Monthly cashflow live
- Estimated rent
- $1,848 high interval (Pro) →
- Mortgage (P&I)
- −$178
- Tax est. 1.5%
- −$42 /mo · $510/yr
- Insurance
- −$14
- HOA
- −$0
- Vacancy / Maint / Mgmt
- −$388
- Net cashflow
- $1,225
Break-even live
Sensitivity live
| Price | -10% $1,248 | -5% $1,237 | +0% $1,225 | +5% $1,213 | +10% $1,201 |
|---|---|---|---|---|---|
| Rent | -10% $1,079 | -5% $1,152 | +0% $1,225 | +5% $1,298 | +10% $1,371 |
| Rate | -1.0pp $1,242 | -0.5pp $1,233 | base $1,225 | +0.5pp $1,216 | +1.0pp $1,207 |
UW: 25.0% down · 7.5% · 30yr · 1.5% tax · 5.0% vac · 8.0% maint · 8.0% mgmt
Financing live
Cash to close
- Down payment
- $8,500
- Closing costs
- $1,020
- Reserves months
- —
- Total cash needed
- —
Loan-product check · same deal, 3 products live
Conventional
25% down · 7.5% · 30yr
- Down + closing
- —
- Monthly P&I
- —
- Monthly cashflow
- —
- DSCR
- —
- Eligible?
- —
Personal DTI + credit; lowest rate.
DSCR
20% down · 8.5% · 30yr
- Down + closing
- —
- Monthly P&I
- —
- Monthly cashflow
- —
- DSCR
- —
- Eligible?
- —
No personal income docs; deal must DSCR.
Hard money
10% down · 12.0% · 12mo
- Down + closing
- —
- Monthly P&I
- —
- Monthly cashflow
- —
- DSCR
- —
- Eligible?
- —
Short-term bridge; refi at stabilization.
Rent comps 11 comps
| Address | Beds | Baths | Sqft | Rent | $/sqft | DOM | Units | Dist |
|---|---|---|---|---|---|---|---|---|
| 6401 Santa Monica Ave NE Albuquerque, NM | 1.0–2.0 | 1.0–2.0 | 1068 | $2,151 | $2.01 | 5d | 26 | 0.34mi |
| 6501 San Antonio Dr NE Albuquerque, NM | 2.0 | 2.0–2.5 | 1075 | $1,875 | $1.74 | 16d | 2 | 0.55mi |
| 6441 Palomas Ave NE Albuquerque, NM | 1.0 | 1.0–1.5 | 758 | $2,088 | $2.75 | 5d | 2 | 0.62mi |
| 7800 Headline Blvd NE Albuquerque, NM | 2.0 | 1.0–2.0 | 961 | $2,343 | $2.44 | 5d | 16 | 0.68mi |
| 7100 Louisiana Blvd NE Albuquerque, NM | 1.0–2.0 | 1.0–2.0 | 763 | $1,790 | $2.35 | 5d | 15 | 0.74mi |
| 7501 Jefferson St NE Albuquerque, NM | 2.0 | 1.0–2.0 | 887 | $2,291 | $2.58 | 4d | 38 | 0.78mi |
| 7000 Louisiana Blvd NE Albuquerque, NM | 1.0–2.0 | 1.0–2.0 | 840 | $1,709 | $2.03 | 4d | 25 | 0.80mi |
| 6401 Academy Rd NE Albuquerque, NM | 3.0 | 1.0–2.0 | 808 | $1,560 | $1.93 | 5d | 16 | 1.23mi |
| 5741 Osuna Rd NE Albuquerque, NM | 1.0–2.0 | 1.0–2.0 | 769 | $1,565 | $2.03 | 5d | 17 | 1.30mi |
| 6301 Alameda Blvd NE Albuquerque, NM | 3.0 | 1.0–2.5 | 903 | $2,072 | $2.29 | 3d | 23 | 1.44mi |
| 5800 Osuna Rd NE Albuquerque, NM | 1.0–2.0 | 1.0–2.0 | 820 | $1,555 | $1.90 | 4d | 23 | 1.49mi |
Listing history 7 events
-
2026-06-07statusdays on market $34,000 Pending 21 DOM
-
2026-06-05days on market $34,000 Active 20 DOM
-
2026-06-03days on market $34,000 Active 19 DOM
-
2026-06-02days on market $34,000 Active 18 DOM
-
2026-06-01days on market $34,000 Active 17 DOM
-
2026-05-31days on market $34,000 Active 16 DOM
-
2026-05-14$34,000 Active 434-char remark
ⓘ Source: listings_history table (triggers on properties + properties_extension) + one-shot
backfill from property_details.listing_events for pre-trigger history.
Climate risk First Street
- Flood 1/10 Low FEMA zone X (unshaded) · 0% chance over 30 yrs
- Wildfire 1/10 Low
- Heat 4/10 Moderate 6 d/yr ≥95°F today · 15 d/yr by 30 yrs out
- Wind 1/10 Low
- Air quality 3/10 Moderate 3 unhealthy d/yr today · 3 by 30 yrs out
Nearby sold comps map
Loading sold comps map…
Walkable amenities ~0.75 mi
Loading nearby amenities…
Taxation est. · year 1
- Rental income
- $22,173
- − Mortgage interest
- −$1,905
- − Property taxes
- −$510
- − Insurance
- −$170
- − Repairs & maintenance
- −$1,774
- − Management
- −$1,774
- − Depreciation
- −$989
- Taxable income
- $15,052
- Est. tax owed @ 24.0%
- −$3,613
- After-tax cash flow
- $11,085/yr
For passive investors: Depreciation is non-cash, so a rental often shows a tax loss while cash-flowing — sheltering income. Rental losses are passive: they offset passive income freely, and up to $25,000/yr can offset ordinary (W-2) income if you actively participate and your MAGI is under $100k (phasing out to $0 by $150k); unused losses carry forward. On sale, claimed depreciation is recaptured at up to 25%, and gains may owe capital-gains tax (a 1031 exchange can defer both). Figures are a year-1 estimate at your 24.0% rate — not tax advice; consult a CPA.
Schools (NCES district)
- District
- Albuquerque Public Schools
- NCES district ID
- 3500060
- Math proficiency
- 51% ▲ 30.00%
- Reading proficiency
- 75% ▲ 45.00%
- Median HH income
- $48,151
- Composite
- 53.29/100
- National rank
- #1487
- State rank
- #3 of 29 in NM
Livability — Albuquerque
- Score
- 72/100
- State rank
- #13
- US rank
- #6219
Category grades
Schools grade is shown separately in the Schools card above.
Census & demographics
- Census place
- Albuquerque, NM
- County
- Bernalillo County · 647,165 people
- City population
- 647,165
- Metro
- Albuquerque, NM
- Population (ZIP)
- 39,324
- Household income
- $58,900
- Rent vs Own
- Severe rent burden
- 2187.0
Population outlook (Bernalillo County) Hauer SSP2
- Today (2025)
- 704,528 people
- By 2030
- 711,723 · +1.0%
- By 2040
- 714,522 · +1.4%
- By 2050
- 709,274 · +0.7%
- By 2075
- 680,015 · -3.5%
- By 2100
- 619,879 · -12.0%
Race, ethnicity, and origin ACS 2023
- Neighborhood character
- Diverse neighborhood (Simpson 0.64)
- Race & ethnicity
- White 47% Hispanic / Latino 36% Two or more races 17% Native American 9% Black 3% Asian 3%
- Hispanic origin (detail)
- Mexican 19%
- Common ancestry
- Lithuanian 2% Slovak 2% Portuguese 2%
- Foreign-born
- 7% · Canada, China
- Languages at home
- 84% English-only · Spanish 11% Other Indo-European 1%
Political lean MEDSL · Bernalillo
- 2024 margin
- Strong D (+21.0) · D 59.2% · R 38.2% · Other 2.6%
- 2008→2024 swing
- -0.3pp no change · 2008: 21.4pp · 2024: 21.0pp
- All cycles
- 2024: D+21.0 2020: D+24.4 2016: D+17.8 2012: D+16.2 2008: D+21.4
Not yet ingested
- Civics
- —
Market trends
- HPI YoY
- ▼ -303.11%
- Current HPI
- 250.5034
- Rent YoY
- ▼ -0.97%
- Metro
- Albuquerque, NM
- State GDP YoY
- —
- F500 in state
- 0
Price history
2 events — show timeline
- 2026-06-05 Pending — Southwest MLS
- 2026-05-14 Listed $34,000 Southwest MLS
Cash-flow waterfall
monthlySold comps — $/sqft
last 12 mo · ≤1 miLoading sold comps…