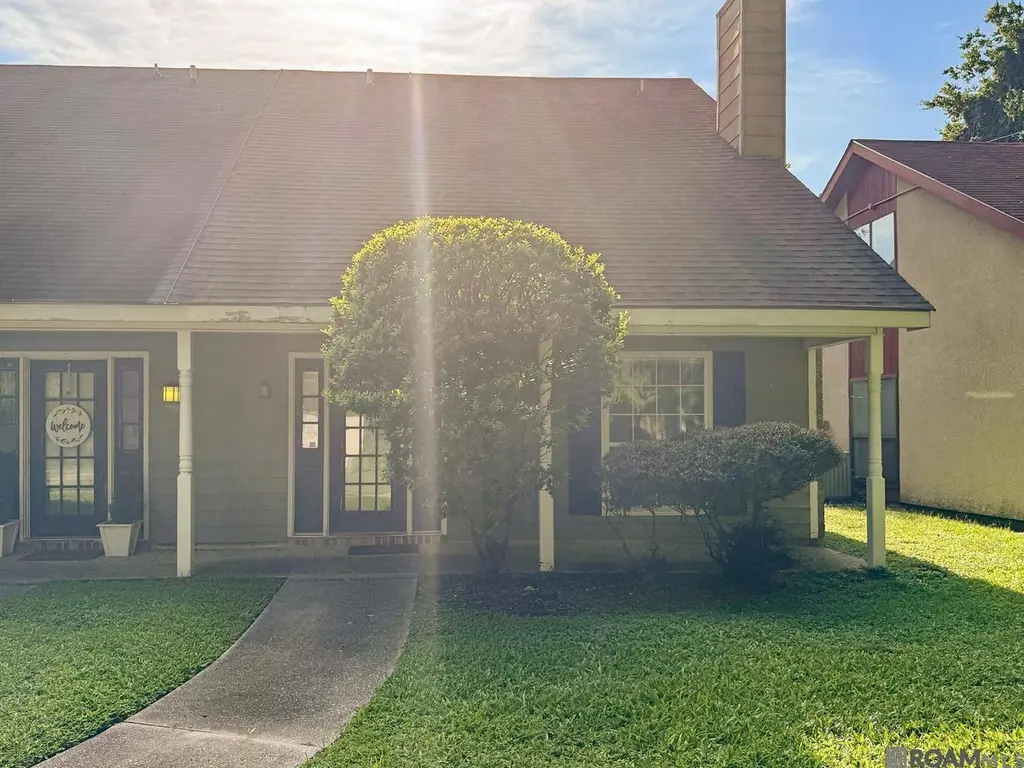
1446 Sharlo Ave · Baton Rouge, LA
Flood risk 1/10 · Minimal
- FEMA flood zone
- X
- Chance of flooding over 30 yrs
- 0.0%
- Est. flood insurance / yr
- $507 – $1,088
Fire risk 1/10 · Minimal
- Est. fire insurance / yr
- $1,269 – $2,357
Heat risk 8/10 · Major
- Hot days now (above 108°F)
- 7 days/yr
- Hot days in 30 yrs
- 21 days/yr
Wind risk 9/10 · Severe
- Chance of severe wind over 30 yrs
- 99.0%
Air-quality risk 2/10 · Minimal
- Unhealthy air days now
- 1 days/yr
- Unhealthy air days in 30 yrs
- 1 days/yr
Risk factors via First Street. Map © Google.
Why this score? — see what drove the D+ grade
The composite is a weighted blend of 9 inputs, each scored 0–100. Each bar is that input's sub-score; the figure is the points it added to the 100-point composite (weight × sub-score).
- Cash flow +14.1/30.0
- ARV discount +14.1/15.0
- DSCR +4.3/10.0
- 1% rule +4.0/10.0
- Livability +3.7/5.0
- Rent growth +3.2/5.0
- Condition / age +2.5/5.0
- Schools +2.4/10.0
- Appreciation +0.0/10.0
$129,900
🖨 Deal sheet (PDF) 📄 Offer letter ✓ Due diligence
Listing remarks MLS
This 2 bedroom, 2 bath home is spacious and thoughtfully designed. The large living room with fireplace is perfect for entertaining with the primary bedroom on the first floor. The second bedroom is accessed from the stairwell in the living room with a balcony overlooking into the living room. This is the perfect investment property or fulltime home. Schedule your appointment today.
Key facts
- 4,356 sq ft lot
- 2 parking spots
- Built 1981
Property features AI
Finance
- HOA & community: Homeowners association with annual fee of $480 (about $40/month); includes grounds maintenance
Exterior
- Parking: 2 total parking spaces; 2-space carport
- Utilities: Public water; Public sewer
- Home design: Attached single-family residence (half duplex); 2 stories
- Construction: Wood siding and frame construction; Composition roof; Slab foundation; Built as residential single-family
- Exterior features: Wood fencing; Sidewalks; Lot roughly 29 x 140 (about 4,356 sq ft / 0.1 acre)
Interior
- Flooring: Tile; Carpet; Ceramic tile; Laminate
- Bathrooms: 2 full bathrooms
- Heating & cooling: Central heating; Central air conditioning
- Interior features: Walk-in closet(s); Fireplace (1)
Neighborhood map
What this means for you Summary
Snapshot
- This is a 2-bed/2.0-bath single-family listed at $130k.
Deal economics
- At list price, monthly cash flow is $20 ($238/yr) — positive.
- The deal already cash-flows at list — no discount required.
- To meet the 1% rule (rent ≥ 1% of price), the offer needs to be $116k (10.5% below list).
- Recommended offer: $116k (10.5% below list) — sets the bar for 1% rule.
- Cap rate 6.5% vs local median 4.3% in Baton Rouge — top-decile yield for the area; either an underpriced asset or a hidden risk that comps aren't pricing in. Stress-test before assuming the spread holds.
Location & tenants
- Location reads 74/100 on livability (#24 in LA, #4,535 nationally) — a middle-class / working-renter tenant base. Strengths: commute A+, cost of living A+, health & safety A+; Watch: amenities D, crime F, employment D-.
- East Baton Rouge Parish (urban): math 22% / reading 34% proficiency, ranked #47 of 98 in LA (top 48%) — low school quality limits family demand, transient renter base, plan for 1-2y turnover; 77% free/reduced lunch — lower-income household profile, screen leases tightly.
- Zoned schools: Belfair Montessori School (math 27% / reading 47%, grade F, #251 of 646 statewide, top 41%, 264 students, 69% FRL); Glasgow Middle School (math 29% / reading 40%, grade F, #93 of 218 statewide, top 43%, 550 students, 60% FRL); Liberty High School (math 50% / reading 74%, grade B-, #15 of 265 statewide, top 6%, 1,208 students, 60% FRL).
- Zoned-school proficiency averages 44% at this address vs 28% district-wide (+16 pts) — the actual schools serving this property are materially stronger than the East Baton Rouge Parish average implies; a family-tenant draw the district grade alone would hide.
- Market conditions: Rents rising (+2.8%/yr); 320 active listings in the ZIP; 37 comparable units currently listed for rent nearby; rentals at typical pace (median 25d on market — plan ~3-4 weeks tenant-placement turnaround); 43% of comp listings sitting > 30 days — soft ceiling on asking rent; 2,252 units permitted in East Baton Rouge Parish in 2024 (440 in 5+ unit buildings).
Forward outlook
- Local home prices are declining (-3.0%/yr); year-one equity from $898 of loan paydown is wiped out by about $4k of value loss. Plan a longer hold.
- East Baton Rouge County population projected at +4% by 2050 — modest demand growth; plan on rents tracking national, not racing it.
Negotiation context
- It's been on market 18 days — a 2% lower offer ($128k) is reasonable based on typical stale-listing flexibility.
- 7 sale attempts since 25y ago with the ask held roughly flat each time — persistent listings suggest the price (not the market) is what's stuck; bring a comps-based counter.
Risks & watch-outs
- Climate carrying-cost: severe wind risk, 99% chance of damaging wind over 30y; extreme-heat days projected 7→21/yr by 2055 (HVAC capex compounding) — expect insurance premiums to compound above CPI over the hold.
Questions for the listing agent
- What does the HOA fee cover, when was the last increase, and are there any pending special assessments or reserve-fund shortfalls?
- Is there a deadline driving the sale (1031 exchange, divorce, estate, relocation)? That informs how much negotiation room exists.
- Crime grade is F in this area — have there been break-ins, vandalism, or insurance claims at this property in the last 3 years? What carrier currently insures it and at what premium?
- The area grade is low — what's the realistic commute time and amenity access for the typical tenant pool here? Any planned neighborhood developments (good or bad) we should know about?
- What's the average days-on-market for RENTAL listings here right now (not sales)? A rising rental-DOM trend means longer vacancies and softer asking-rent achievability than the comps imply.
- What's the recent tenant-quality profile in this submarket — average credit score on applications, eviction rate, late-payment / NSF rate, and stable-employment percentage? A property-management company in the area should have these aggregated.
- How much new for-sale + rental construction is in the pipeline within 1–3 miles? Heavy new supply typically softens prices + rents 12–24 months out; constrained supply supports both.
Investment metrics
- 1% rule
- 0.90% ✗
- Cap rate
- 6.48%
- Cash-on-cash
- 0.66%
- DSCR
- 1.03
- GRM
- 9.3
CMA / ARV
- ARV (median comp)
- $152,167
- List price
- $129,900
- Delta
- -14.63%
- Verdict
- UNDERPRICED
- Comps
- 20 within 1.0 mi
Projected returns pro-forma
-3.0% appreciation · 2.79% rent growth · sell at horizon
- IRR
- -15.5%
- Equity multiple
- 0.45×
- Total profit
- $-20,012
- Equity at exit
- $19,369
- IRR
- -7.3%
- Equity multiple
- 0.54×
- Total profit
- $-16,725
- Equity at exit
- $11,231
Cash invested: $36,372 (down + closing). Projections, not guarantees.
Landlord ↔ Tenant lean methodology
- Overall (STATE)
- 90 Strongly Landlord-Friendly
- State Louisiana
- 90 Strongly Landlord-Friendly · R+12
- County
- — inherits STATE
- City
- — inherits STATE
ZIP-level market 70820
- Home prices YoY
- -29.9%
- Rents YoY
- 2.8%
- Active inventory
- 320
- Price-to-rent
- 9.3×
Monthly cashflow live
- Estimated rent
- $1,163 high interval (Pro) →
- Mortgage (P&I)
- −$681
- Tax from tax record
- −$123 /mo · $1,482/yr
- Insurance
- −$54
- HOA
- −$40
- Vacancy / Maint / Mgmt
- −$244
- Net cashflow
- $20
Break-even live
Sensitivity live
| Price | -10% $93 | -5% $57 | +0% $20 | +5% $-17 | +10% $-54 |
|---|---|---|---|---|---|
| Rent | -10% $-72 | -5% $-26 | +0% $20 | +5% $66 | +10% $112 |
| Rate | -1.0pp $85 | -0.5pp $53 | base $20 | +0.5pp $-14 | +1.0pp $-48 |
UW: 25.0% down · 7.5% · 30yr · 1.5% tax · 5.0% vac · 8.0% maint · 8.0% mgmt
Financing live
Cash to close
- Down payment
- $32,475
- Closing costs
- $3,897
- Reserves months
- —
- Total cash needed
- —
Loan-product check · same deal, 3 products live
Conventional
25% down · 7.5% · 30yr
- Down + closing
- —
- Monthly P&I
- —
- Monthly cashflow
- —
- DSCR
- —
- Eligible?
- —
Personal DTI + credit; lowest rate.
DSCR
20% down · 8.5% · 30yr
- Down + closing
- —
- Monthly P&I
- —
- Monthly cashflow
- —
- DSCR
- —
- Eligible?
- —
No personal income docs; deal must DSCR.
Hard money
10% down · 12.0% · 12mo
- Down + closing
- —
- Monthly P&I
- —
- Monthly cashflow
- —
- DSCR
- —
- Eligible?
- —
Short-term bridge; refi at stabilization.
Rent comps 37 comps
| Address | Beds | Baths | Sqft | Rent | $/sqft | DOM | Units | Dist |
|---|---|---|---|---|---|---|---|---|
| 1413 Jim Taylor Dr Unit 216 Baton Rouge, LA | 1.0 | 1.0 | 600 | $550 | $0.92 | 45d | 1 | 0.08mi |
| 1222 Jim Taylor Dr Baton Rouge, LA | 1.0 | 1.0 | 650 | $725 | $1.12 | 16d | 2 | 0.17mi |
| 4639 Tigerland Ave Unit A11 Baton Rouge, LA | 2.0 | 1.0 | 695 | $750 | $1.08 | 45d | 1 | 0.18mi |
| 2000 Brightside Dr Baton Rouge, LA | 1.0–3.0 | 1.0–2.0 | 792 | $1,252 | $1.58 | 16d | 1 | 0.23mi |
| 4606 Y a Tittle Ave Baton Rouge, LA | 2.0 | 1.0 | 770 | $975 | $1.27 | 16d | 1 | 0.23mi |
| 4618 Alvin Dark Ave Baton Rouge, LA | 1.0 | 1.0 | 675 | $750 | $1.11 | 45d | 1 | 0.23mi |
| 4618 Alvin Dark Ave Baton Rouge, LA | 1.0 | 1.0 | 675 | $750 | $1.11 | 25d | 1 | 0.23mi |
| 4554 Y A Tittle Ave Unit B Baton Rouge, LA | 2.0 | 1.0 | 800 | $850 | $1.06 | 45d | 1 | 0.24mi |
| 4554 Y A Tittle Ave #2 Baton Rouge, LA | 2.0 | 1.0 | 900 | $825 | $0.92 | 16d | 1 | 0.24mi |
| 4554 Y A Tittle Ave Baton Rouge, LA | 2.0 | 1.0 | 800 | $800 | $1.00 | 45d | 1 | 0.24mi |
| 2073 Brightside Dr Baton Rouge, LA | 2.0 | 2.0 | 1100 | $1,200 | $1.09 | 25d | 1 | 0.24mi |
| 4547 Alvin Dark Ave Apt 1 Baton Rouge, LA | 1.0 | 1.0 | 550 | $795 | $1.45 | 16d | 1 | 0.29mi |
| 4547 Alvin Dark Ave Apt 2 Baton Rouge, LA | 1.0 | 1.0 | 550 | $1,000 | $1.82 | 45d | 1 | 0.29mi |
| 5124 Brightside View Dr #4 Baton Rouge, LA | 2.0 | 1.0 | 1000 | $875 | $0.88 | 45d | 1 | 0.30mi |
| 5124 Brightside View Dr #3 Baton Rouge, LA | 2.0 | 1.5 | 1000 | $875 | $0.88 | 45d | 1 | 0.30mi |
| 5124 Brightside View Dr #4 Baton Rouge, LA | 2.0 | 1.5 | 1000 | $999 | $1.00 | 25d | 1 | 0.30mi |
| 4609 Earl Gros Ave Unit 18 Baton Rouge, LA | 1.0 | 1.0 | 600 | $550 | $0.92 | 16d | 1 | 0.32mi |
| 1221 Bob Pettit Blvd Baton Rouge, LA | 1.0 | 1.0 | 585 | $738 | $1.26 | 20d | 2 | 0.35mi |
| 1302 Bob Pettit Blvd Baton Rouge, LA | 1.0 | 1.0 | 540 | $750 | $1.39 | 20d | 2 | 0.37mi |
| 1855 Brightside Dr Unit 3BR 15 BA Baton Rouge, LA | 3.0 | 1.5 | 820 | $1,095 | $1.34 | 45d | 1 | 0.39mi |
| 1983 S Brightside View Dr Unit C Baton Rouge, LA | 2.0 | 2.5 | 1124 | $1,195 | $1.06 | 45d | 1 | 0.41mi |
| 4445 Alvin Dark Ave Baton Rouge, LA | 1.0–3.0 | 1.0–3.0 | 869 | $1,003 | $1.15 | 16d | 14 | 0.41mi |
| 1855 Brightside Dr Baton Rouge, LA | 2.0 | 1.0 | 820 | $995 | $1.21 | 45d | 1 | 0.41mi |
| 1724 Brightside Dr Apt A Baton Rouge, LA | 2.0 | 1.5 | 1050 | $1,025 | $0.98 | 25d | 1 | 0.43mi |
| 1704 Brightside Dr Unit C Baton Rouge, LA | 2.0 | 2.0 | 1088 | $1,175 | $1.08 | 22d | 1 | 0.44mi |
| 1714 Brightside Dr Unit A Baton Rouge, LA | 2.0 | 1.5 | 1050 | $1,025 | $0.98 | 45d | 1 | 0.46mi |
| 1645 Brightside Dr Baton Rouge, LA | 1.0 | 1.0 | 650 | $905 | $1.39 | 45d | 2 | 0.53mi |
| 839 E Boyd Dr Unit C Baton Rouge, LA | 2.0 | 1.5 | 1080 | $1,400 | $1.30 | 20d | 1 | 0.61mi |
| 837 E Boyd Dr Unit A Baton Rouge, LA | 2.0 | 1.5 | 1080 | $1,300 | $1.20 | 20d | 1 | 0.61mi |
| 5107 Nicholson Dr Unit A31 Baton Rouge, LA | 1.0 | 1.0 | 741 | $1,050 | $1.42 | 45d | 1 | 0.73mi |
| 436 Jennifer Jean Dr Baton Rouge, LA | 3.0 | 2.0 | 1100 | $1,950 | $1.77 | 16d | 1 | 0.90mi |
| 436 Jennifer Jean Dr Baton Rouge, LA | 3.0 | 2.0 | 1100 | $1,950 | $1.77 | 25d | 1 | 0.90mi |
| 448 W Parker Blvd Baton Rouge, LA | 1.0 | 1.0 | 525 | $820 | $1.56 | 45d | 1 | 0.91mi |
| 4264 Oxford Ave Unit 4 Baton Rouge, LA | 2.0 | 1.0 | 1000 | $1,295 | $1.29 | 25d | 1 | 1.16mi |
| 4264 Oxford Ave Unit 3 Baton Rouge, LA | 2.0 | 1.0 | 1000 | $1,350 | $1.35 | 45d | 1 | 1.16mi |
| 5116 Highland Rd Baton Rouge, LA | 2.0 | 1.0–2.0 | 771 | $1,021 | $1.32 | 16d | 39 | 1.29mi |
| 5151 Highland Rd Baton Rouge, LA | 4.0 | 1.0–4.0 | 1129 | $1,256 | $1.11 | 16d | 150 | 1.44mi |
HOA detail
- Monthly dues
- $40 · $480/yr
Listing history 8 events
-
2026-05-05$129,900 Active 385-char remark
Show marketing remark (385 chars)
This 2 bedroom, 2 bath home is spacious and thoughtfully designed. The large living room with fireplace is perfect for entertaining with the primary bedroom on the first floor. The second bedroom is accessed from the stairwell in the living room with a balcony overlooking into the living room. This is the perfect investment property or fulltime home. Schedule your appointment today.
-
2026-05-05$129,900 Active 386-char remark
Show marketing remark (385 chars)
This 2 bedroom, 2 bath home is spacious and thoughtfully designed. The large living room with fireplace is perfect for entertaining with the primary bedroom on the first floor. The second bedroom is accessed from the stairwell in the living room with a balcony overlooking into the living room. This is the perfect investment property or fulltime home. Schedule your appointment today.
-
2025-07-09$139,900 Active
-
2025-07-09$139,900 Active
-
2012-05-23$113,000
-
2001-06-21soldstatus
-
2001-03-02$82,000
-
2001-03-02$82,000
ⓘ Source: listings_history table (triggers on properties + properties_extension) + one-shot
backfill from property_details.listing_events for pre-trigger history.
Tax reassessment forecast LA · Resets to sale price
- Current annual tax
- $1,482 · $123/mo
- Projected year-2 tax
- $1,482 · $123/mo
- Expected delta
- $0/yr ($0/mo · 0.0%)
ⓘ Screening estimate from a state-policy table — verify with the county assessor before closing.
Climate risk First Street
- Flood 1/10 Low FEMA zone X · 0% chance over 30 yrs
- Wildfire 1/10 Low
- Heat 8/10 Severe 7 d/yr ≥108°F today · 21 d/yr by 30 yrs out
- Wind 9/10 Extreme 99% chance of damaging wind over 30 yrs
- Air quality 2/10 Low 1 unhealthy d/yr today · 1 by 30 yrs out
Nearby sold comps map
Loading sold comps map…
Walkable amenities ~0.75 mi
Loading nearby amenities…
Taxation est. · year 1
- Rental income
- $13,955
- − Mortgage interest
- −$7,276
- − Property taxes
- −$1,482
- − Insurance
- −$650
- − Repairs & maintenance
- −$1,116
- − Management
- −$1,116
- − HOA
- −$480
- − Depreciation
- −$3,779
- Taxable loss
- −$1,945
- Est. tax savings @ 24.0%
- +$467
- After-tax cash flow
- $705/yr
For passive investors: Depreciation is non-cash, so a rental often shows a tax loss while cash-flowing — sheltering income. Rental losses are passive: they offset passive income freely, and up to $25,000/yr can offset ordinary (W-2) income if you actively participate and your MAGI is under $100k (phasing out to $0 by $150k); unused losses carry forward. On sale, claimed depreciation is recaptured at up to 25%, and gains may owe capital-gains tax (a 1031 exchange can defer both). Figures are a year-1 estimate at your 24.0% rate — not tax advice; consult a CPA.
Schools (NCES district)
- District
- East Baton Rouge Parish
- NCES district ID
- 2200540
- Math proficiency
- 22% ▼ -36.00%
- Reading proficiency
- 34% ▼ -31.00%
- Median HH income
- $46,263
- Composite
- 24.14/100
- National rank
- #7745
- State rank
- #47 of 98 in LA
Livability — Baton Rouge
- Score
- 74/100
- State rank
- #24
- US rank
- #4535
Category grades
Schools grade is shown separately in the Schools card above.
Census & demographics
- Census place
- Baton Rouge, LA
- County
- East Baton Rouge Parish · 399,686 people
- City population
- 351,868
- Metro
- Baton Rouge, LA
- Population (ZIP)
- 23,377
- Household income
- $47,429
- Rent vs Own
- Severe rent burden
- 1879.0
Population outlook (East Baton Rouge County) Hauer SSP2
- Today (2025)
- 464,810 people
- By 2030
- 472,137 · +1.6%
- By 2040
- 480,243 · +3.3%
- By 2050
- 484,422 · +4.2%
- By 2075
- 492,069 · +5.9%
- By 2100
- 476,347 · +2.5%
Race, ethnicity, and origin ACS 2023
- Neighborhood character
- Diverse neighborhood (Simpson 0.63)
- Race & ethnicity
- White 56% Black 21% Hispanic / Latino 13% Asian 7% Two or more races 5% Native American 2%
- Hispanic origin (detail)
- Mexican 3%
- Common ancestry
- Lithuanian 7% Italian 2% Scotch-Irish 1%
- Foreign-born
- 13% · Canada, China, South Korea
- Languages at home
- 84% English-only · Spanish 9% Other Indo-European 3% Chinese 1%
Political lean MEDSL · East Baton Rouge
- 2024 margin
- D (+11.1) · D 54.5% · R 43.4% · Other 2.1%
- 2008→2024 swing
- +8.9pp toward D · 2008: 2.2pp · 2024: 11.1pp
- All cycles
- 2024: D+11.1 2020: D+13.1 2016: D+9.2 2012: D+5.2 2008: D+2.2
Not yet ingested
- Civics
- —
Market trends
- HPI YoY
- ▼ -56.10%
- Current HPI
- 131.5382
- Rent YoY
- ▲ 2.79%
- Metro
- Baton Rouge, LA
- State GDP YoY
- ▲ 3.29%
- F500 in state
- 10
Industry mix (Fortune 500 HQ in LA)
| Industry | F500 HQs | Revenue |
|---|---|---|
| Telecommunications | 2 | $23B |
|
||
| Utilities | 1 | $12B |
|
||
| Wholesale / Distribution | 1 | $5B |
|
||
| Advertising | 1 | $2B |
|
||
Price history
+58.4% since first listed10 events — show timeline
- 2026-05-23 Pending — AcadianaMLS
- 2026-05-23 Pending — GBRMLS
- 2026-05-05 Listed $129,900 GBRMLS
- 2026-05-05 Listed $129,900 AcadianaMLS
- 2025-07-09 Listed $139,900 AcadianaMLS
- 2025-07-09 Listed $139,900 GBRMLS
- 2012-05-23 Listed $113,000 AcadianaMLS
- 2001-06-21 Sold (MLS) — GBRMLS
- 2001-03-02 Listed $82,000 GBRMLS
- 2001-03-02 Listed $82,000 AcadianaMLS
Property tax history
+0.5%/yrLatest (2025): $1,482 · +4.5% YoY. Source: county tax records.
Cash-flow waterfall
monthlySold comps — $/sqft
last 12 mo · ≤1 miLoading sold comps…