 Multi-family
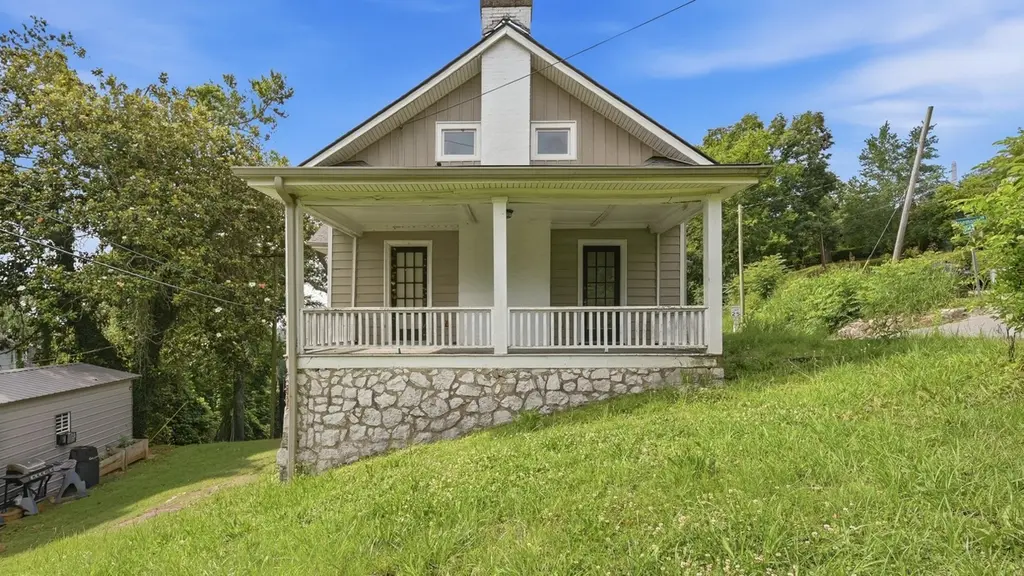
2 S Crest Rd · Chattanooga, TN
Flood risk 1/10 · Minimal
- FEMA flood zone
- X (unshaded)
- Chance of flooding over 30 yrs
- 0.0%
- Est. flood insurance / yr
- $507 – $1,088
Fire risk 1/10 · Minimal
- Est. fire insurance / yr
- $949 – $1,763
Heat risk 5/10 · Moderate
- Hot days now (above 105°F)
- 6 days/yr
- Hot days in 30 yrs
- 14 days/yr
Wind risk 4/10 · Minor
- Chance of severe wind over 30 yrs
- 12.0%
Air-quality risk 3/10 · Minor
- Unhealthy air days now
- 2 days/yr
- Unhealthy air days in 30 yrs
- 2 days/yr
Risk factors via First Street. Map © Google.
Why this score? — see what drove the B- grade
The composite is a weighted blend of 9 inputs, each scored 0–100. Each bar is that input's sub-score; the figure is the points it added to the 100-point composite (weight × sub-score).
- Cash flow +30.0/30.0
- 1% rule +10.0/10.0
- DSCR +10.0/10.0
- ARV discount +7.5/15.0
- Livability +3.9/5.0
- Schools +2.7/10.0
- Rent growth +2.5/5.0
- Condition / age +2.5/5.0
- Appreciation +0.0/10.0
$214,900
🖨 Deal sheet (PDF) 📄 Offer letter ✓ Due diligence
Multi-family units
County records classify this as Multi-Family (2-4 Unit). Listing-text estimate: 1 unit. estimate disagrees with records
Listing remarks MLS
This charming unfinished 1940's craftsman triplex home sits on Chattanooga historic Missionary ridge. This Investment property has tons of potential . with 6 bedrooms /7 bathrooms within 3 separate suites. Main floor suite includes wood floors, fireplace, tall ceilings, formal entry, spacious living with 3 bathroom and 3 bedrooms. . Downstairs: 2 separate suites with large covered porch, big lot, ample parking. Great investment to live mortgage free or rent out all three units for nice rental income.
Key facts
- Wood floors
- Formal entry
- Tall ceilings
Tags
Property features AI
Finance
- Other: Located in Rose Terrace Addn subdivision; Directions: through McCallie tunnels take right on S Seminole Dr., right on Rosemont Dr. to S Crest; home on the right
Exterior
- Parking: Gravel off-street parking
- Utilities: Water: Other; Sewer: Other; Utilities: Other
- Home design: Single-family residence; Residential property; Above-grade finished area reported
- Construction: Construction materials: Other
- Exterior features: Other exterior features; Lot roughly 0.51 acres (approx. 260 x 65)
Interior
- Bathrooms: 3 full bathrooms
- Heating & cooling: Has cooling (type: Other)
- Interior features: Fireplace (1); Basement; Accessible bedroom
Neighborhood map
What this means for you Summary
Snapshot
- This is a 4-bed/3.0-bath multifamily listed at $215k.
Deal economics
- At list price, monthly cash flow is $2k ($22k/yr) — positive.
- The deal already cash-flows at list — no discount required.
- Meets the 1% rule at list price ($4k rent vs $215k).
- Cap rate 16.6% vs local median 3.4% in Chattanooga — top-decile yield for the area; either an underpriced asset or a hidden risk that comps aren't pricing in. Stress-test before assuming the spread holds.
Location & tenants
- Location reads 78/100 on livability (#3 in TN, #2,582 nationally) — a middle-class / working-renter tenant base. Strengths: amenities A+, commute A+, cost of living A+; Watch: employment D+, crime F.
- Hamilton County (urban): math 31% / reading 31% proficiency, ranked #42 of 139 in TN (top 30%) — families likely to look elsewhere, expect single-tenant / working-renter base with shorter leases.
- Zoned schools: East Ridge Elementary (math 22% / reading 18%, grade F, #644 of 952 statewide, top 68%, 996 students, 0% FRL); East Ridge Middle School (math 12% / reading 14%, grade F, #237 of 333 statewide, top 72%, 701 students, 0% FRL); East Ridge High School (math 7% / reading 17%, grade F, #265 of 332 statewide, top 80%, 1,008 students, 0% FRL) — zoned schools average 0% FRL vs 52% district-wide (52 pts lower); this property's tenant base skews higher-income than the district average.
- Zoned-school proficiency averages 15% at this address vs 31% district-wide (-16 pts) — the specific schools serving this property underperform the Hamilton County average; the district grade overstates school quality for this exact location.
- Market conditions: Rents flat; 167 active listings in the ZIP; 8 comparable units currently listed for rent nearby; rentals at typical pace (median 25d on market — plan ~3-4 weeks tenant-placement turnaround); 2,133 units permitted in Hamilton County in 2024 (405 in 5+ unit buildings).
Forward outlook
- Local home prices are declining (-3.0%/yr); year-one equity from $1k of loan paydown is wiped out by about $6k of value loss. Plan a longer hold.
- Hamilton County population projected at +23% by 2050 — long-run rental-demand tailwind backs the buy-and-hold thesis.
- At projected returns (-3.0% appreciation + 0.0% rent growth), your $60k cash investment doubles in ~4 years — after that, you're playing with house money.
Negotiation context
- Only 10 days on market — expect competitive offers; lowballing is unlikely to land.
- 5 sale attempts since 27y ago with the ask held roughly flat each time — persistent listings suggest the price (not the market) is what's stuck; bring a comps-based counter.
- Current owner paid $150k; 43% above their basis — modest negotiation headroom, anchor on the comps not their cost.
Risks & watch-outs
- Watch-outs: built in 1940 — expect roof / HVAC / electrical / plumbing capex.
- Climate carrying-cost: extreme-heat days projected 6→14/yr by 2055 (HVAC capex compounding) — expect insurance premiums to compound above CPI over the hold.
Questions for the listing agent
- Built in 1940 — when were the roof, HVAC, electrical panel, plumbing, and water heater last replaced?
- Is there a deadline driving the sale (1031 exchange, divorce, estate, relocation)? That informs how much negotiation room exists.
- Schools are F-rated, which usually means shorter tenancies and higher turnover. Who's the typical renter profile here, and what's been the actual vacancy rate?
- Crime grade is F in this area — have there been break-ins, vandalism, or insurance claims at this property in the last 3 years? What carrier currently insures it and at what premium?
- What's the average days-on-market for RENTAL listings here right now (not sales)? A rising rental-DOM trend means longer vacancies and softer asking-rent achievability than the comps imply.
- What's the recent tenant-quality profile in this submarket — average credit score on applications, eviction rate, late-payment / NSF rate, and stable-employment percentage? A property-management company in the area should have these aggregated.
- How much new apartment / multifamily construction is in the pipeline within 1–3 miles? Heavy new supply (>2% of stock underway) typically softens rents 12–24 months out; light construction supports rent growth.
Investment metrics
- 1% rule
- 1.90% ✓
- Cap rate
- 16.61%
- Cash-on-cash
- 36.83%
- DSCR
- 2.64
- GRM
- 4.4
CMA / ARV
No comps found within radius.
Projected returns pro-forma
-3.0% appreciation · 0.03% rent growth · sell at horizon
- IRR
- 29.4%
- Equity multiple
- 2.18×
- Total profit
- $70,952
- Equity at exit
- $32,042
- IRR
- 35.0%
- Equity multiple
- 3.78×
- Total profit
- $167,401
- Equity at exit
- $18,581
Cash invested: $60,172 (down + closing). Projections, not guarantees.
Landlord ↔ Tenant lean methodology
- Overall (STATE)
- 87 Strongly Landlord-Friendly
- State Tennessee
- 87 Strongly Landlord-Friendly · R+13
- County
- — inherits STATE
- City
- — inherits STATE
ZIP-level market 37404
- Home prices YoY
- -30.6%
- Rents YoY
- 0.0%
- Active inventory
- 167
- Price-to-rent
- 13.2×
Monthly cashflow live
- Estimated rent
- $4,085 high interval (Pro) →
- Mortgage (P&I)
- −$1,127
- Tax from tax record
- −$164 /mo · $1,964/yr
- Insurance
- −$90
- HOA
- −$0
- Vacancy / Maint / Mgmt
- −$858
- Net cashflow
- $1,847
Break-even live
Sensitivity live
| Price | -10% $1,969 | -5% $1,908 | +0% $1,847 | +5% $1,786 | +10% $1,725 |
|---|---|---|---|---|---|
| Rent | -10% $1,524 | -5% $1,686 | +0% $1,847 | +5% $2,008 | +10% $2,170 |
| Rate | -1.0pp $1,955 | -0.5pp $1,902 | base $1,847 | +0.5pp $1,791 | +1.0pp $1,735 |
3-unit breakdown (identical units grouped — click to expand)
| Units | Beds | Baths | Est. rent |
|---|---|---|---|
| 3× units | 3 | 2 | $4,086 |
| #1 | 3 | 2 | $1,362 |
| #2 | 3 | 2 | $1,362 |
| #3 | 3 | 2 | $1,362 |
| Total (3 units) | $4,085 | ||
UW: 25.0% down · 7.5% · 30yr · 1.5% tax · 5.0% vac · 8.0% maint · 8.0% mgmt
Financing live
Cash to close
- Down payment
- $53,725
- Closing costs
- $6,447
- Reserves months
- —
- Total cash needed
- —
Loan-product check · same deal, 3 products live
Conventional
25% down · 7.5% · 30yr
- Down + closing
- —
- Monthly P&I
- —
- Monthly cashflow
- —
- DSCR
- —
- Eligible?
- —
Personal DTI + credit; lowest rate.
DSCR
20% down · 8.5% · 30yr
- Down + closing
- —
- Monthly P&I
- —
- Monthly cashflow
- —
- DSCR
- —
- Eligible?
- —
No personal income docs; deal must DSCR.
Hard money
10% down · 12.0% · 12mo
- Down + closing
- —
- Monthly P&I
- —
- Monthly cashflow
- —
- DSCR
- —
- Eligible?
- —
Short-term bridge; refi at stabilization.
Rent comps 8 comps
| Address | Beds | Baths | Sqft | Rent | $/sqft | DOM | Units | Dist |
|---|---|---|---|---|---|---|---|---|
| 3229 Westonia Dr Chattanooga, TN | 4.0 | 2.0 | 2130 | $2,695 | $1.27 | 24d | 1 | 0.98mi |
| 1906 Vine St Chattanooga, TN | 3.0 | 2.5 | 1881 | $2,200 | $1.17 | 24d | 1 | 1.08mi |
| 1905 Ivy St Chattanooga, TN | 4.0 | 3.0 | 1860 | $2,495 | $1.34 | 24d | 1 | 1.10mi |
| 1814 Duncan Ave Chattanooga, TN | 3.0 | 2.0 | 2056 | $2,500 | $1.22 | 22d | 1 | 1.13mi |
| 2380 E 18th Street Pl Chattanooga, TN | 3.0 | 2.5 | 1950 | $1,895 | $0.97 | 22d | 1 | 1.17mi |
| 2328 E 18th Street Pl Chattanooga, TN | 3.0 | 2.5 | 1950 | $1,995 | $1.02 | 22d | 1 | 1.19mi |
| 1908 Robbins St Chattanooga, TN | 3.0 | 2.0 | 1783 | $1,750 | $0.98 | 15d | 1 | 1.36mi |
| 1516 Union Ave Chattanooga, TN | 4.0 | 3.0 | 2800 | $3,800 | $1.36 | 24d | 1 | 1.40mi |
Listing history 8 events
-
2026-06-18days on market $214,900 Active 10 DOM
-
2026-06-17days on market $214,900 Active 9 DOM
-
2026-06-16days on market $214,900 Active 8 DOM
-
2026-06-15days on market $214,900 Active 7 DOM
-
2026-06-14days on market $214,900 Active 5 DOM
-
2026-06-10days on market $214,900 Active 2 DOM
-
2026-06-09remarks 504-char remark
-
2026-06-09$214,900 Active 1 DOM
ⓘ Source: listings_history table (triggers on properties + properties_extension) + one-shot
backfill from property_details.listing_events for pre-trigger history.
Tax reassessment forecast TN · Resets to sale price
- Current annual tax
- $1,964 · $164/mo
- Projected year-2 tax
- $1,964 · $164/mo
- Expected delta
- $0/yr ($0/mo · 0.0%)
ⓘ Screening estimate from a state-policy table — verify with the county assessor before closing.
Climate risk First Street
- Flood 1/10 Low FEMA zone X (unshaded) · 0% chance over 30 yrs
- Wildfire 1/10 Low
- Heat 5/10 Major 6 d/yr ≥105°F today · 14 d/yr by 30 yrs out
- Wind 4/10 Moderate 12% chance of damaging wind over 30 yrs
- Air quality 3/10 Moderate 2 unhealthy d/yr today · 2 by 30 yrs out
Nearby sold comps map
Loading sold comps map…
Walkable amenities ~0.75 mi
Loading nearby amenities…
Taxation est. · year 1
- Rental income
- $49,020
- − Mortgage interest
- −$12,038
- − Property taxes
- −$1,964
- − Insurance
- −$1,074
- − Repairs & maintenance
- −$3,922
- − Management
- −$3,922
- − Depreciation
- −$6,252
- Taxable income
- $19,849
- Est. tax owed @ 24.0%
- −$4,764
- After-tax cash flow
- $17,400/yr
For passive investors: Depreciation is non-cash, so a rental often shows a tax loss while cash-flowing — sheltering income. Rental losses are passive: they offset passive income freely, and up to $25,000/yr can offset ordinary (W-2) income if you actively participate and your MAGI is under $100k (phasing out to $0 by $150k); unused losses carry forward. On sale, claimed depreciation is recaptured at up to 25%, and gains may owe capital-gains tax (a 1031 exchange can defer both). Figures are a year-1 estimate at your 24.0% rate — not tax advice; consult a CPA.
Schools (NCES district)
- District
- Hamilton County
- NCES district ID
- 4701590
- Math proficiency
- 31% ▼ -10.00%
- Reading proficiency
- 31% ▼ -3.00%
- Median HH income
- $47,456
- Composite
- 26.8/100
- National rank
- #7122
- State rank
- #42 of 139 in TN
Livability — Chattanooga
- Score
- 78/100
- State rank
- #3
- US rank
- #2582
Category grades
Schools grade is shown separately in the Schools card above.
Census & demographics
- Census place
- Chattanooga, TN
- County
- Hamilton County · 312,777 people
- City population
- 131,999
- Metro
- Chattanooga, TN-GA
- Population (ZIP)
- 14,737
- Household income
- $56,637
- Rent vs Own
- Severe rent burden
- 486.0
Population outlook (Hamilton County) Hauer SSP2
- Today (2025)
- 393,784 people
- By 2030
- 412,983 · +4.9%
- By 2040
- 449,502 · +14.1%
- By 2050
- 484,341 · +23.0%
- By 2075
- 565,746 · +43.7%
- By 2100
- 618,394 · +57.0%
Race, ethnicity, and origin ACS 2023
- Neighborhood character
- Diverse neighborhood (Simpson 0.67)
- Race & ethnicity
- Black 38% White 38% Hispanic / Latino 21% Two or more races 11%
- Hispanic origin (detail)
- Mexican 3%
- Common ancestry
- Slovak 3% Romanian 1% Lithuanian 1%
- Foreign-born
- 11% · Canada
- Languages at home
- 81% English-only · Spanish 18%
Political lean MEDSL · Hamilton
- 2024 margin
- R (+13.1) · D 42.7% · R 55.7% · Other 1.6%
- 2008→2024 swing
- -1.2pp toward R · 2008: -11.8pp · 2024: -13.1pp
- All cycles
- 2024: R+13.1 2020: R+9.7 2016: R+16.6 2012: R+14.8 2008: R+11.8
Not yet ingested
- Civics
- —
Market trends
- HPI YoY
- ▼ -139.43%
- Current HPI
- 315.8539
- Rent YoY
- ▬ 0.03%
- Metro
- Chattanooga, TN-GA
- State GDP YoY
- ▲ 2.78%
- F500 in state
- 22
Industry mix (Fortune 500 HQ in TN)
| Industry | F500 HQs | Revenue |
|---|---|---|
| Healthcare | 3 | $91B |
|
||
| Retail | 3 | $72B |
|
||
| Transportation / Logistics | 1 | $88B |
|
||
| Paper / Packaging | 1 | $19B |
|
||
| Insurance | 1 | $13B |
|
||
| Energy | 1 | $12B |
|
||
Price history
+305.3% since first listed19 events — show timeline
- 2026-06-08 Listed $214,900 GCAR
- 2025-12-31 Price Changed $215,000 GCAR
- 2025-10-14 Sold (Public Records) $150,000 Public Records
- 2025-10-09 Sold (MLS) $150,000 GCAR
- 2025-08-28 Pending — GCAR
- 2025-08-15 Relisted — GCAR
- 2025-08-15 Price Changed $199,000 GCAR
- 2025-06-24 Price Changed $800,000 GCAR
- 2025-04-09 Listed $299,000 GCAR
- 2023-04-29 Sold (MLS) $200,000 REALTRACS as Distributed by MLS Grid
- 2023-04-29 Sold (MLS) $200,000 GCAR
- 2023-04-27 Sold (Public Records) $200,000 Public Records
- 2011-11-01 Sold (Public Records) $140,000 Public Records
- 2006-03-29 Sold (Public Records) $129,000 Public Records
- 2001-05-14 Sold (Public Records) $85,500 Public Records
- 2001-05-14 Sold (MLS) $85,500 GCAR
- 2001-02-12 Listed $96,900 GCAR
- 1999-09-20 Listed $110,000 RCAOR
- 1990-11-21 Sold (Public Records) $53,027 Public Records
Property tax history
+2.6%/yrLatest (2025): $1,964 · +52.4% YoY. Source: county tax records.
Cash-flow waterfall
monthlySold comps — $/sqft
last 12 mo · ≤1 miLoading sold comps…