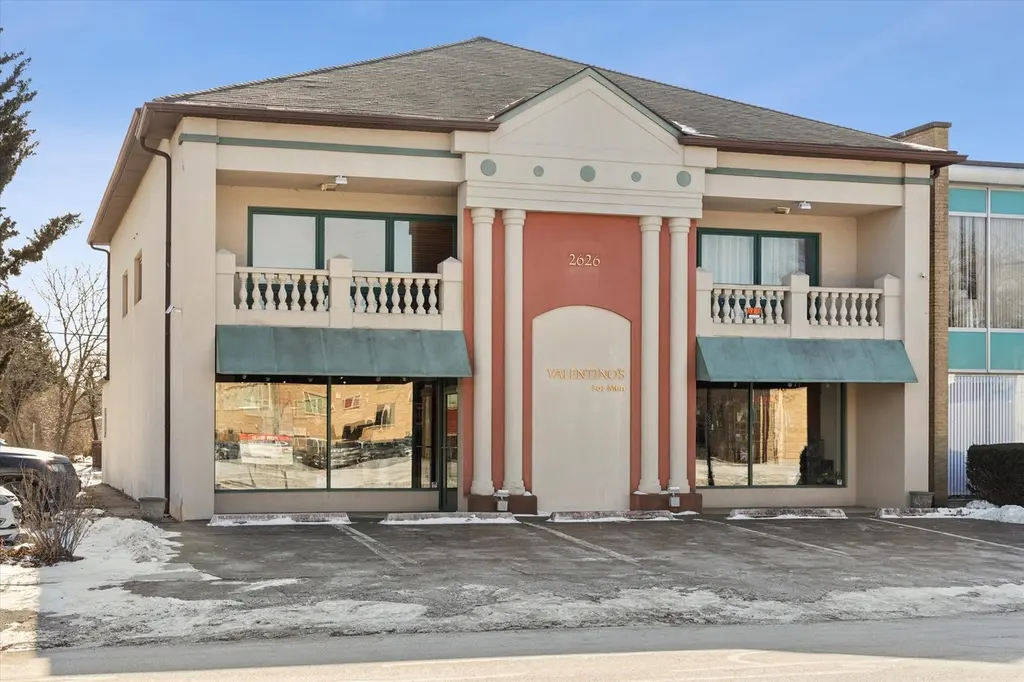
2626 Flossmoor Rd · Flossmoor, IL
Flood risk 3/10 · Minor
- FEMA flood zone
- X (unshaded)
- Chance of flooding over 30 yrs
- 0.1%
- Est. flood insurance / yr
- $473 – $860
Fire risk 1/10 · Minimal
- Est. fire insurance / yr
- $804 – $1,492
Heat risk 3/10 · Minor
- Hot days now (above 101°F)
- 7 days/yr
- Hot days in 30 yrs
- 15 days/yr
Wind risk 2/10 · Minimal
- Chance of severe wind over 30 yrs
- —
Air-quality risk 2/10 · Minimal
- Unhealthy air days now
- 1 days/yr
- Unhealthy air days in 30 yrs
- 1 days/yr
Risk factors via First Street. Map © Google.
Why this score? — see what drove the F grade
The composite is a weighted blend of 9 inputs, each scored 0–100. Each bar is that input's sub-score; the figure is the points it added to the 100-point composite (weight × sub-score).
- ARV discount +7.5/15.0
- Livability +4.0/5.0
- Rent growth +2.5/5.0
- Condition / age +2.5/5.0
- Schools +2.4/10.0
- Cash flow +0.0/30.0
- 1% rule +0.0/10.0
- DSCR +0.0/10.0
- Appreciation +0.0/10.0
$698,000
🖨 Deal sheet (PDF) 📄 Offer letter ✓ Due diligence
Listing remarks
Amazing Mixed-use investment opportunity in Flossmoor. Considered one of Chicago's best suburbs! Approx. 2900sqft ground floor commercial space plus two 2nd Floor - 3 bedroom/1.1 bath units with hardwood flooring, in-unit laundry, central air and a 24x16 terrace. 10 parking spaces! The first floor commercial space was originally 2 spaces, with - and still exist, separate furnaces, electric meters. It can be easily restored to provide a total of 4 unit incomes! Steps to downtown Flossmoor, shopping, Metra train station and more. New residential development going up across the street!
Key facts
- Hardwood flooring
- 24x16 terrace
- 10 parking spaces
Tags
Property features AI
Finance
- Other: 3 total units; Expense highlights: electric, water/sewer, trash, and insurance expenses reported
- Financial info: Gross and total monthly income reported as $7,750; Annual taxes reported (not included per instructions)
Exterior
- Parking: 1–5 outdoor parking spaces
- Utilities: Community water; Sewer connected; Electric to site (circuit breakers); Natural gas available
- Home design: Mixed-use property; Hip roof; Composition roofing
- Construction: Brick construction; Built before 1978; Concrete perimeter foundation
- Exterior features: City street frontage; Lot dimensions approximately 50 x 125
Interior
- Kitchen: 2 ranges
- Heating & cooling: Gas heating; Central air conditioning
- Interior features: Ceiling units and forced air ventilation; Central individual air conditioning
Neighborhood map
What this means for you Summary
Snapshot
- This is a 2-bed/2.5-bath condo listed at $698k.
Deal economics
- At list price, monthly cash flow is $-3k ($-41k/yr) — negative.
- To cash-flow at today's rent, offer at most $358k (48.7% below list).
- To meet the 1% rule (rent ≥ 1% of price), the offer needs to be $313k (55.1% below list).
- Recommended offer: $313k (55.1% below list) — sets the bar for 1% rule.
- Cap rate 0.5% vs local median 4.3% in Flossmoor — below-typical yield; the buyer is paying a premium for something (appreciation thesis, condition, location) that the cap rate doesn't capture.
Location & tenants
- Location reads 80/100 on livability (#107 in IL, #1,718 nationally) — a professional / high-income tenant draw. Strengths: employment A+, housing A+, crime B+; Watch: cost of living D, amenities F.
- Homewood Flossmoor Chsd 233 (suburban): math 21% / reading 27% proficiency, ranked #272 of 620 in IL (top 44%) — low school quality limits family demand, transient renter base, plan for 1-2y turnover.
- Zoned schools: Heather Hill Elem School (math 27% / reading 37%, grade F, #586 of 2,056 statewide, top 31%, 326 students, 0% FRL); Parker Junior High School (math 16% / reading 21%, grade F, #438 of 665 statewide, top 67%, 858 students, 0% FRL); Homewood-Flossmoor High School (math 21% / reading 27%, grade F, #304 of 693 statewide, top 44%, 2,798 students, 0% FRL).
- Market conditions: 95 active listings in the ZIP; 6,272 units permitted in Cook County in 2024 (4,658 in 5+ unit buildings).
Forward outlook
- Local home prices are declining (-3.0%/yr); year-one equity from $5k of loan paydown is wiped out by about $21k of value loss. Plan a longer hold.
Negotiation context
- Only 13 days on market — expect competitive offers; lowballing is unlikely to land.
- 7 sale attempts since 18y ago; this cycle's ask has dropped $92k (12%) from the opening price — seller is motivated, your offer sets the floor, not the list.
- Current owner paid $230k; list at $698k implies a 203% gain — meaningful room to come down on a strong offer.
Risks & watch-outs
- Watch-outs: property tax is 3.3% of price.
Questions for the listing agent
- What do current leases actually rent for vs. the listed asking? Can we see a recent rent roll and the last 12 months of T-12 income?
- Built in 1970 — when were the roof, HVAC, electrical panel, plumbing, and water heater last replaced?
- Property tax is high relative to price — has the assessment been appealed recently, and will the sale trigger a re-assessment?
- Any open or pending special assessments — roof, HVAC, plumbing, elevator, façade? What's the per-unit balance and payoff schedule, and is the seller paying it off at close or rolling it to the buyer?
- Is there a deadline driving the sale (1031 exchange, divorce, estate, relocation)? That informs how much negotiation room exists.
- Schools are B-rated — typically a magnet for longer-tenancy family renters. What's the average tenant stay here, and is there a school-zone premium baked into asking?
- The area grade is low — what's the realistic commute time and amenity access for the typical tenant pool here? Any planned neighborhood developments (good or bad) we should know about?
- What's the average days-on-market for RENTAL listings here right now (not sales)? A rising rental-DOM trend means longer vacancies and softer asking-rent achievability than the comps imply.
- What's the recent tenant-quality profile in this submarket — average credit score on applications, eviction rate, late-payment / NSF rate, and stable-employment percentage? A property-management company in the area should have these aggregated.
- How much new apartment / multifamily construction is in the pipeline within 1–3 miles? Heavy new supply (>2% of stock underway) typically softens rents 12–24 months out; light construction supports rent growth.
Investment metrics
- 1% rule
- 0.45% ✗
- Cap rate
- 0.46%
- Cash-on-cash
- -20.82%
- DSCR
- 0.07
- GRM
- 18.6
CMA / ARV
No comps found within radius.
Projected returns pro-forma
-3.0% appreciation · 3.0% rent growth · sell at horizon
- IRR
- -59.7%
- Equity multiple
- -0.68×
- Total profit
- $-328,379
- Equity at exit
- $104,074
- IRR
- —
- Equity multiple
- -1.87×
- Total profit
- $-561,235
- Equity at exit
- $60,350
Cash invested: $195,440 (down + closing). Projections, not guarantees.
Landlord ↔ Tenant lean methodology
- Overall (STATE)
- 43 Moderately Tenant-Leaning
- State Illinois
- 43 Moderately Tenant-Leaning · D+7
- County
- — inherits STATE
- City
- — inherits STATE
ZIP-level market 60422
- Home prices YoY
- -26.3%
- Active inventory
- 95
- Price-to-rent
- 18.6×
Monthly cashflow live
- Estimated rent
- $3,134 medium interval (Pro) →
- Mortgage (P&I)
- −$3,660
- Tax from tax record
- −$1,915 /mo · $22,985/yr
- Insurance
- −$291
- HOA
- −$0
- Vacancy / Maint / Mgmt
- −$658
- Net cashflow
- $-3,391
Break-even live
Sensitivity live
| Price | -10% $-2,996 | -5% $-3,193 | +0% $-3,391 | +5% $-3,588 | +10% $-3,786 |
|---|---|---|---|---|---|
| Rent | -10% $-3,638 | -5% $-3,515 | +0% $-3,391 | +5% $-3,267 | +10% $-3,143 |
| Rate | -1.0pp $-3,039 | -0.5pp $-3,213 | base $-3,391 | +0.5pp $-3,572 | +1.0pp $-3,756 |
UW: 25.0% down · 7.5% · 30yr · 1.5% tax · 5.0% vac · 8.0% maint · 8.0% mgmt
Financing live
Cash to close
- Down payment
- $174,500
- Closing costs
- $20,940
- Reserves months
- —
- Total cash needed
- —
Loan-product check · same deal, 3 products live
Conventional
25% down · 7.5% · 30yr
- Down + closing
- —
- Monthly P&I
- —
- Monthly cashflow
- —
- DSCR
- —
- Eligible?
- —
Personal DTI + credit; lowest rate.
DSCR
20% down · 8.5% · 30yr
- Down + closing
- —
- Monthly P&I
- —
- Monthly cashflow
- —
- DSCR
- —
- Eligible?
- —
No personal income docs; deal must DSCR.
Hard money
10% down · 12.0% · 12mo
- Down + closing
- —
- Monthly P&I
- —
- Monthly cashflow
- —
- DSCR
- —
- Eligible?
- —
Short-term bridge; refi at stabilization.
HOA detail condo
- Monthly dues
- $0 · $0/yr
- Likely covers
- electric
- Assessments
- None detected in remarks — confirm with the listing agent.
Listing history 30 events
-
2026-06-21days on market $698,000 Active 13 DOM
-
2026-06-18days on market $698,000 Active 10 DOM
-
2026-06-17days on market $698,000 Active 9 DOM
-
2026-06-16days on market $698,000 Active 8 DOM
-
2026-06-15days on market $698,000 Active 7 DOM
-
2026-06-13days on market $698,000 Active 5 DOM
-
2026-06-08pricedays on market $698,000 Active 1 DOM
-
2026-06-07days on market $729,000 Active 132 DOM
-
2026-06-04days on market $729,000 Active 129 DOM
-
2026-06-03days on market $729,000 Active 128 DOM
-
2026-06-02days on market $729,000 Active 127 DOM
-
2026-06-01days on market $729,000 Active 126 DOM
-
2026-05-31days on market $729,000 Active 125 DOM
-
2026-05-11price $729,000
-
2026-03-12price $749,000
-
2026-01-26$790,000 Active
-
2025-11-21historical
-
2025-09-22Active
-
2025-09-22historical
-
2025-04-23Active
-
2025-04-07historical
-
2025-01-03Active
-
2009-09-18historical
-
2009-07-27price Price Change
-
2009-06-17
-
2009-05-29historical
-
2009-02-28
-
2009-02-27historical
-
2008-10-01
-
1996-05-08soldstatus $230,000
ⓘ Source: listings_history table (triggers on properties + properties_extension) + one-shot
backfill from property_details.listing_events for pre-trigger history.
Tax reassessment forecast IL · Partial reset (capped growth)
- Current annual tax
- $22,985 · $1,915/mo
- Projected year-2 tax
- $22,985 · $1,915/mo
- Expected delta
- $0/yr ($0/mo · 0.0%)
ⓘ Screening estimate from a state-policy table — verify with the county assessor before closing.
Climate risk First Street
- Flood 3/10 Moderate FEMA zone X (unshaded) · 10% chance over 30 yrs
- Wildfire 1/10 Low
- Heat 3/10 Moderate 7 d/yr ≥101°F today · 15 d/yr by 30 yrs out
- Wind 2/10 Low
- Air quality 2/10 Low 1 unhealthy d/yr today · 1 by 30 yrs out
Nearby sold comps map
Loading sold comps map…
Walkable amenities ~0.75 mi
Loading nearby amenities…
Taxation est. · year 1
- Rental income
- $37,608
- − Mortgage interest
- −$39,099
- − Property taxes
- −$22,985
- − Insurance
- −$3,490
- − Repairs & maintenance
- −$3,009
- − Management
- −$3,009
- − Depreciation
- −$20,305
- Taxable loss
- −$54,289
- Est. tax savings @ 24.0%
- +$13,029
- After-tax cash flow
- $-27,660/yr
For passive investors: Depreciation is non-cash, so a rental often shows a tax loss while cash-flowing — sheltering income. Rental losses are passive: they offset passive income freely, and up to $25,000/yr can offset ordinary (W-2) income if you actively participate and your MAGI is under $100k (phasing out to $0 by $150k); unused losses carry forward. On sale, claimed depreciation is recaptured at up to 25%, and gains may owe capital-gains tax (a 1031 exchange can defer both). Figures are a year-1 estimate at your 24.0% rate — not tax advice; consult a CPA.
Schools (NCES district)
- District
- Homewood Flossmoor Chsd 233
- NCES district ID
- 1719560
- Math proficiency
- 21% ▼ -15.00%
- Reading proficiency
- 27% ▼ -13.00%
- Median HH income
- $83,564
- Composite
- 24.42/100
- National rank
- #7681
- State rank
- #272 of 620 in IL
Livability — Flossmoor
- Score
- 80/100
- State rank
- #107
- US rank
- #1718
Category grades
Schools grade is shown separately in the Schools card above.
Census & demographics
- Census place
- Flossmoor, IL
- City population
- 9,885
- Population (ZIP)
- 9,885
Population outlook (Cook County) Hauer SSP2
- Today (2025)
- 5,347,519 people
- By 2030
- 5,357,703 · +0.2%
- By 2040
- 5,324,924 · -0.4%
- By 2050
- 5,230,762 · -2.2%
- By 2075
- 4,785,735 · -10.5%
- By 2100
- 4,188,836 · -21.7%
Race, ethnicity, and origin ACS 2023
- Neighborhood character
- Majority Black (63%)
- Race & ethnicity
- Black 63% White 28% Hispanic / Latino 5% Two or more races 4% Asian 2%
- Common ancestry
- Iranian 3% Romanian 3% Portuguese 2%
- Foreign-born
- 5% · Canada
- Languages at home
- 92% English-only · Spanish 4% Other Asian/Pacific 2% Other Indo-European 1%
Political lean MEDSL · Cook
- 2024 margin
- Solid D (+42.0) · D 70.4% · R 28.4% · Other 1.2%
- 2008→2024 swing
- -11.4pp toward R · 2008: 53.4pp · 2024: 42.0pp
- All cycles
- 2024: D+42.0 2020: D+50.3 2016: D+53.0 2012: D+49.4 2008: D+53.4
Not yet ingested
- Civics
- —
Market trends
- HPI YoY
- ▼ -67.78%
- Current HPI
- 189.5534
- Rent YoY
- —
- Metro
- —
- State GDP YoY
- ▲ 1.59%
- F500 in state
- 60
Industry mix (Fortune 500 HQ in IL)
| Industry | F500 HQs | Revenue |
|---|---|---|
| Insurance | 4 | $201B |
|
||
| Consumer Goods | 4 | $87B |
|
||
| Industrial Machinery | 3 | $64B |
|
||
| Healthcare | 2 | $55B |
|
||
| Retail / Pharmacy | 1 | $148B |
|
||
| Agriculture / Food | 1 | $86B |
|
||
Price history
+217.0% since first listed17 events — show timeline
- 2026-05-11 Price Changed $729,000 MRED as Distributed by MLS Grid
- 2026-03-12 Price Changed $749,000 MRED as Distributed by MLS Grid
- 2026-01-26 Listed $790,000 MRED as Distributed by MLS Grid
- 2025-11-21 Listing Removed — MRED as Distributed by MLS Grid
- 2025-09-22 Listing Removed — MRED as Distributed by MLS Grid
- 2025-09-22 Listed — MRED as Distributed by MLS Grid
- 2025-04-23 Listed — MRED as Distributed by MLS Grid
- 2025-04-07 Listing Removed — MRED as Distributed by MLS Grid
- 2025-01-03 Listed — MRED as Distributed by MLS Grid
- 2009-09-18 Listing Removed — MRED as Distributed by MLS Grid
- 2009-07-27 Price Changed — MRED as Distributed by MLS Grid
- 2009-06-17 Listed — MRED as Distributed by MLS Grid
- 2009-05-29 Listing Removed — MRED as Distributed by MLS Grid
- 2009-02-28 Listed — MRED as Distributed by MLS Grid
- 2009-02-27 Listing Removed — MRED as Distributed by MLS Grid
- 2008-10-01 Listed — MRED as Distributed by MLS Grid
- 1996-05-08 Sold (Public Records) $230,000 Public Records
Property tax history
+3.5%/yrLatest (2023): $22,985 · +12.1% YoY. Source: county tax records.
Cash-flow waterfall
monthlySold comps — $/sqft
last 12 mo · ≤1 miLoading sold comps…