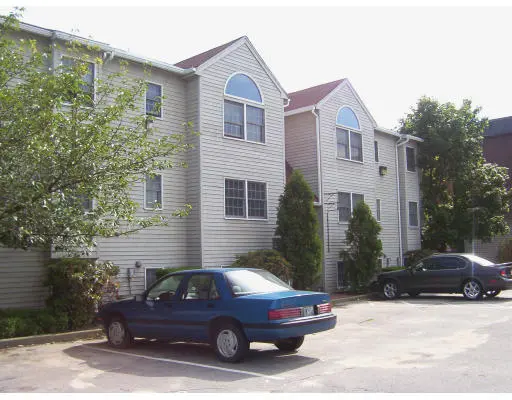
95 Park Pl #201 · Pawtucket, RI
Flood risk No data
- FEMA flood zone
- —
- Chance of flooding over 30 yrs
- —
- Est. flood insurance / yr
- —
Fire risk No data
- Est. fire insurance / yr
- —
Heat risk No data
- Hot days now (above threshold)
- —
- Hot days in 30 yrs
- —
Wind risk No data
- Chance of severe wind over 30 yrs
- —
Air-quality risk No data
- Unhealthy air days now
- —
- Unhealthy air days in 30 yrs
- —
Risk factors via First Street. Map © Google.
Why this score? — see what drove the D- grade
The composite is a weighted blend of 9 inputs, each scored 0–100. Each bar is that input's sub-score; the figure is the points it added to the 100-point composite (weight × sub-score).
- Cash flow +12.2/30.0
- ARV discount +7.5/15.0
- 1% rule +5.4/10.0
- DSCR +3.6/10.0
- Livability +3.6/5.0
- Rent growth +3.4/5.0
- Condition / age +2.5/5.0
- Schools +1.1/10.0
- Appreciation +0.0/10.0
$179,900
🖨 Deal sheet 📄 Offer letter ✓ Due diligence
Listing remarks
Welcome to 95 Park Place, Unit 201, a 2-bedroom, 1-bath condo offering comfortable, low-maintenance living in a desirable Pawtucket location. This unit features a functional layout with bright living spaces and ample room to relax or entertain. Enjoy the ease of one assigned parking space along with on-site community laundry for added convenience. Ideally located near local amenities, shopping, dining, and major routes, this is a great opportunity for owner-occupants or investors alike.
Key facts
- Shopping
- Local amenities
- Dining
Tags
Neighborhood map
What this means for you Summary
Snapshot
- This is a 2-bed/1.0-bath condo listed at $180k.
Deal economics
- At list price, monthly cash flow is $-36 ($-427/yr) — negative.
- To cash-flow at today's rent, offer at most $174k (3.5% below list).
- Meets the 1% rule at list price ($2k rent vs $180k).
- Recommended offer: $174k (3.5% below list) — sets the bar for cash-flow.
- Cap rate 6.1% vs local median 3.8% in Pawtucket — top-decile yield for the area; either an underpriced asset or a hidden risk that comps aren't pricing in. Stress-test before assuming the spread holds.
Location & tenants
- Location reads 71/100 on livability (#16 in RI) — a middle-class / working-renter tenant base. Strengths: housing A+, health & safety A+, cost of living B+; Watch: employment C-, schools D, amenities F.
- Pawtucket (suburban): math 7% / reading 19% proficiency, ranked #33 of 39 in RI (top 85%) — low school quality limits family demand, transient renter base, plan for 1-2y turnover; 67% free/reduced lunch — lower-income household profile, screen leases tightly.
- Market conditions: Rents rising (+3.5%/yr); 123 active listings in the ZIP; 40 comparable units currently listed for rent nearby; rentals at typical pace (median 24d on market — plan ~3-4 weeks tenant-placement turnaround); 45% of comp listings sitting > 30 days — soft ceiling on asking rent; 776 units permitted in Providence County in 2024 (229 in 5+ unit buildings).
- This rent runs 37% of the median local income ($62k/yr) — at the standard rent-burdened threshold; future hikes will face affordability resistance.
Forward outlook
- Local home prices are declining (-3.0%/yr); year-one equity from $1k of loan paydown is wiped out by about $5k of value loss. Plan a longer hold.
- Providence County population projected at +5% by 2050 — modest demand growth; plan on rents tracking national, not racing it.
Negotiation context
- Only 4 days on market — expect competitive offers; lowballing is unlikely to land.
- 4 sale attempts since 21y ago with the ask held roughly flat each time — persistent listings suggest the price (not the market) is what's stuck; bring a comps-based counter.
- Current owner paid $120k; 50% above their basis — modest negotiation headroom, anchor on the comps not their cost.
Questions for the listing agent
- What do current leases actually rent for vs. the listed asking? Can we see a recent rent roll and the last 12 months of T-12 income?
- What does the HOA fee cover, when was the last increase, and are there any pending special assessments or reserve-fund shortfalls?
- Any open or pending special assessments — roof, HVAC, plumbing, elevator, façade? What's the per-unit balance and payoff schedule, and is the seller paying it off at close or rolling it to the buyer?
- Is there a deadline driving the sale (1031 exchange, divorce, estate, relocation)? That informs how much negotiation room exists.
- Schools are D-rated, which usually means shorter tenancies and higher turnover. Who's the typical renter profile here, and what's been the actual vacancy rate?
- The area grade is low — what's the realistic commute time and amenity access for the typical tenant pool here? Any planned neighborhood developments (good or bad) we should know about?
- What's the average days-on-market for RENTAL listings here right now (not sales)? A rising rental-DOM trend means longer vacancies and softer asking-rent achievability than the comps imply.
- What's the recent tenant-quality profile in this submarket — average credit score on applications, eviction rate, late-payment / NSF rate, and stable-employment percentage? A property-management company in the area should have these aggregated.
- How much new apartment / multifamily construction is in the pipeline within 1–3 miles? Heavy new supply (>2% of stock underway) typically softens rents 12–24 months out; light construction supports rent growth.
Investment metrics
- 1% rule
- 1.04% ✓
- Cap rate
- 6.06%
- Cash-on-cash
- -0.85%
- DSCR
- 0.96
- GRM
- 8.0
CMA / ARV
No comps found within radius.
Projected returns pro-forma
-3.0% appreciation · 3.47% rent growth · sell at horizon
- IRR
- -16.9%
- Equity multiple
- 0.40×
- Total profit
- $-30,330
- Equity at exit
- $26,824
- IRR
- -7.6%
- Equity multiple
- 0.51×
- Total profit
- $-24,831
- Equity at exit
- $15,554
Cash invested: $50,372 (down + closing). Projections, not guarantees.
Landlord ↔ Tenant lean methodology
- Overall (STATE)
- 31 Tenant-Leaning
- State Rhode Island
- 31 Tenant-Leaning · D+8
- County
- — inherits STATE
- City
- — inherits STATE
ZIP-level market 02860
- Rents YoY
- 3.5%
- Active inventory
- 123
- Price-to-rent
- 8.0×
Monthly cashflow live
- Estimated rent
- $1,878 high interval (Pro) →
- Mortgage (P&I)
- −$943
- Tax from tax record
- −$166 /mo · $1,988/yr
- Insurance
- −$75
- HOA
- −$335
- Vacancy / Maint / Mgmt
- −$394
- Net cashflow
- $-36
Break-even live
UW: 25.0% down · 7.5% · 30yr · 1.5% tax · 5.0% vac · 8.0% maint · 8.0% mgmt
Financing live
Cash to close
- Down payment
- $44,975
- Closing costs
- $5,397
- Reserves months
- —
- Total cash needed
- —
Loan-product check · same deal, 3 products live
Conventional
25% down · 7.5% · 30yr
- Down + closing
- —
- Monthly P&I
- —
- Monthly cashflow
- —
- DSCR
- —
- Eligible?
- —
Personal DTI + credit; lowest rate.
DSCR
20% down · 8.5% · 30yr
- Down + closing
- —
- Monthly P&I
- —
- Monthly cashflow
- —
- DSCR
- —
- Eligible?
- —
No personal income docs; deal must DSCR.
Hard money
10% down · 12.0% · 12mo
- Down + closing
- —
- Monthly P&I
- —
- Monthly cashflow
- —
- DSCR
- —
- Eligible?
- —
Short-term bridge; refi at stabilization.
Rent comps 40 comps
| Address | Beds | Baths | Sqft | Rent | $/sqft | DOM | Units | Dist |
|---|---|---|---|---|---|---|---|---|
| 75 S Union St Pawtucket, RI | 1.0–2.0 | 1.0–2.0 | 1053 | $2,795 | $2.65 | 1d | 8 | 0.05mi |
| 136 George St Unit 8 Pawtucket, RI | 2.0 | 1.0 | 800 | $1,650 | $2.06 | 43d | 1 | 0.28mi |
| 44 Pine St Unit 2 Pawtucket, RI | 2.0 | 1.0 | 980 | $1,800 | $1.84 | 23d | 1 | 0.35mi |
| 19 Barney Ave Unit 1 Pawtucket, RI | 3.0 | 1.0 | 1000 | $1,950 | $1.95 | 43d | 1 | 0.36mi |
| 29 Pine St Unit 2 Pawtucket, RI | 3.0 | 1.0 | 1100 | $1,900 | $1.73 | 15d | 1 | 0.39mi |
| 183 Harrison St #1 Pawtucket, RI | 2.0 | 1.0 | 1080 | $1,375 | $1.27 | 43d | 1 | 0.41mi |
| 327 Pine St Unit 4018 Pawtucket, RI | 1.0 | 1.0 | 780 | $1,650 | $2.12 | 43d | 1 | 0.42mi |
| 327 Pine St Unit 2014 Pawtucket, RI | 1.0 | 1.0 | 780 | $1,600 | $2.05 | 43d | 1 | 0.42mi |
| 327 Pine St Pawtucket, RI | 1.0–2.0 | 1.0–2.0 | 940 | $2,400 | $2.55 | 1d | 2 | 0.42mi |
| 145 Randall St Pawtucket, RI | 1.0–2.0 | 1.0 | 955 | $2,150 | $2.25 | 4d | 5 | 0.45mi |
| 327 Pine St Unit 3002 Pawtucket, RI | 2.0 | 2.0 | 1100 | $2,400 | $2.18 | 1d | 1 | 0.46mi |
| 327 Pine St Unit 1034 Pawtucket, RI | 1.0 | 1.0 | 780 | $1,700 | $2.18 | 43d | 1 | 0.46mi |
| 31 Potter St Unit 1 Pawtucket, RI | 3.0 | 1.0 | 1100 | $2,000 | $1.82 | 43d | 1 | 0.55mi |
| 52 Jackson St Unit 1 Pawtucket, RI | 1.0 | 1.0 | 700 | $1,425 | $2.04 | 23d | 1 | 0.58mi |
| 13 Magill St Unit 2 Pawtucket, RI | 2.0 | 1.0 | 1100 | $1,850 | $1.68 | 43d | 1 | 0.60mi |
| 94 Lonsdale Ave Unit 7 Pawtucket, RI | 1.0 | 1.0 | 780 | $1,250 | $1.60 | 4d | 1 | 0.61mi |
| 106 Carpenter St Unit 2 Pawtucket, RI | 2.0 | 1.0 | 975 | $1,600 | $1.64 | 43d | 1 | 0.61mi |
| 106 Carpenter St Unit 3 Pawtucket, RI | 2.0 | 1.0 | 950 | $1,400 | $1.47 | 43d | 1 | 0.61mi |
| 74 Hawes St Unit 2 Central Falls, RI | 2.0 | 1.0 | 775 | $1,700 | $2.19 | 1d | 1 | 0.64mi |
| 65 Johnson St Unit 1R Pawtucket, RI | 2.0 | 1.0 | 650 | $1,600 | $2.46 | 16d | 1 | 0.65mi |
| 133 Clifford St Unit 2 Pawtucket, RI | 2.0 | 1.0 | 960 | $1,800 | $1.88 | 23d | 1 | 0.67mi |
| 850 Main St #2 Pawtucket, RI | 2.0 | 1.0 | 1000 | $1,495 | $1.50 | 23d | 1 | 0.70mi |
| 396 Weeden St Pawtucket, RI | 1.0–2.0 | 1.0 | 700 | $2,195 | $3.14 | 3d | 4 | 0.71mi |
| 53 S Bend St Unit 3 Pawtucket, RI | 3.0 | 1.0 | 922 | $1,900 | $2.06 | 23d | 1 | 0.79mi |
| 70 Watson St Apt 1 Central Falls, RI | 2.0 | 1.0 | 800 | $1,350 | $1.69 | 43d | 1 | 0.85mi |
| 422 Pawtucket Ave Unit 2 Pawtucket, RI | 3.0 | 1.0 | 900 | $1,875 | $2.08 | 43d | 1 | 0.85mi |
| 422 Pawtucket Ave Unit 11 Pawtucket, RI | 2.0 | 1.0 | 700 | $1,750 | $2.50 | 23d | 1 | 0.85mi |
| 664 Dexter St Unit 8 Central Falls, RI | 2.0 | 1.0 | 900 | $1,500 | $1.67 | 1d | 1 | 0.89mi |
| 132 Armistice Blvd Unit 3 Pawtucket, RI | 1.0 | 1.0 | 700 | $1,300 | $1.86 | 16d | 1 | 0.90mi |
| 48 Waltham St Pawtucket, RI | 3.0 | 1.0 | 1100 | $2,450 | $2.23 | 43d | 1 | 0.91mi |
| 61 Utton Ave Unit 2 Pawtucket, RI | 3.0 | 1.0 | 1105 | $2,400 | $2.17 | 1d | 1 | 0.95mi |
| 6 Lawton St Unit 5 Pawtucket, RI | 2.0 | 1.0 | 800 | $1,450 | $1.81 | 23d | 1 | 0.95mi |
| 223 Cottage St Unit 1 Pawtucket, RI | 1.0 | 1.0 | 1000 | $1,650 | $1.65 | 43d | 1 | 0.99mi |
| 34 Fletcher St Unit 4 Central Falls, RI | 2.0 | 1.0 | 550 | $1,600 | $2.91 | 16d | 1 | 1.00mi |
| 22 Heaton St Unit 3 Pawtucket, RI | 3.0 | 1.0 | 1117 | $2,300 | $2.06 | 43d | 1 | 1.04mi |
| 200 Esten Ave Unit 104 Pawtucket, RI | 1.0 | 1.0 | 1086 | $1,900 | $1.75 | 2d | 1 | 1.05mi |
| 200 Esten Ave Unit 316 Pawtucket, RI | 1.0 | 1.0 | 1086 | $1,995 | $1.84 | 43d | 1 | 1.05mi |
| 43 Trenton St Unit 2 Pawtucket, RI | 3.0 | 1.0 | 1092 | $2,500 | $2.29 | 43d | 1 | 1.09mi |
| 200 Esten Ave Pawtucket, RI | 1.0 | 1.0 | 1086 | $2,005 | $1.85 | 43d | 1 | 1.12mi |
| 301 Lowden St Pawtucket, RI | 3.0 | 1.0 | 1000 | $2,100 | $2.10 | 15d | 1 | 1.15mi |
HOA detail condo
- Monthly dues
- $335 · $4,020/yr
- Likely covers
- parking
- Assessments
- None detected in remarks — confirm with the listing agent.
Listing history 12 events
-
2026-03-24status Pending
-
2026-03-19$179,900 Active
-
2018-03-03status Pending
-
2018-03-02historical
-
2018-02-05$69,900 Active
-
2016-11-08price $114,000
-
2008-03-30historical
-
2007-03-30$124,900
-
2005-11-16soldstatus $120,000
-
2005-11-15soldstatus $120,000
-
2005-11-10historical
-
2005-06-30$124,900
ⓘ Source: listings_history table (triggers on properties + properties_extension) + one-shot
backfill from property_details.listing_events for pre-trigger history.
Tax reassessment forecast RI · Partial reset (capped growth)
- Current annual tax
- $1,988 · $166/mo
- Projected year-2 tax
- $2,460 · $205/mo
- Expected delta
- +$472/yr (+$39/mo · 23.8%)
ⓘ Screening estimate from a state-policy table — verify with the county assessor before closing.
Nearby sold comps map
Loading sold comps map…
Walkable amenities ~0.75 mi
Loading nearby amenities…
Taxation est. · year 1
- Rental income
- $22,533
- − Mortgage interest
- −$10,077
- − Property taxes
- −$1,988
- − Insurance
- −$900
- − Repairs & maintenance
- −$1,803
- − Management
- −$1,803
- − HOA
- −$4,020
- − Depreciation
- −$5,233
- Taxable loss
- −$3,290
- Est. tax savings @ 24.0%
- +$790
- After-tax cash flow
- $362/yr
For passive investors: Depreciation is non-cash, so a rental often shows a tax loss while cash-flowing — sheltering income. Rental losses are passive: they offset passive income freely, and up to $25,000/yr can offset ordinary (W-2) income if you actively participate and your MAGI is under $100k (phasing out to $0 by $150k); unused losses carry forward. On sale, claimed depreciation is recaptured at up to 25%, and gains may owe capital-gains tax (a 1031 exchange can defer both). Figures are a year-1 estimate at your 24.0% rate — not tax advice; consult a CPA.
Schools (NCES district)
- District
- Pawtucket
- NCES district ID
- 4400840
- Math proficiency
- 7% ▼ -10.00%
- Reading proficiency
- 19% ▼ -5.00%
- Median HH income
- $41,838
- Composite
- 11.29/100
- National rank
- #9718
- State rank
- #33 of 39 in RI
Livability — Pawtucket
- Score
- 71/100
- State rank
- #16
- US rank
- #7037
Category grades
Schools grade is shown separately in the Schools card above.
Census & demographics
- Census place
- Pawtucket, RI
- County
- Providence County · 548,917 people
- City population
- 75,942
- Metro
- Providence-Warwick, RI-MA
- Population (ZIP)
- 47,818
- Household income
- $61,539
- Rent vs Own
- Severe rent burden
- 2528.0
Population outlook (Providence County) Hauer SSP2
- Today (2025)
- 653,469 people
- By 2030
- 660,819 · +1.1%
- By 2040
- 672,747 · +3.0%
- By 2050
- 683,741 · +4.6%
- By 2075
- 720,435 · +10.2%
- By 2100
- 741,582 · +13.5%
Race, ethnicity, and origin ACS 2023
- Neighborhood character
- Highly diverse neighborhood (Simpson 0.74)
- Race & ethnicity
- White 40% Hispanic / Latino 29% Two or more races 22% Black 14% Asian 1%
- Hispanic origin (detail)
- Mexican 2% Puerto Rican 9% Dominican 6%
- Common ancestry
- Russian 9% Lithuanian 4% Romanian 2%
- Foreign-born
- 28% · Canada, Jamaica
- Languages at home
- 57% English-only · Spanish 22% Other Indo-European 9% French/Haitian/Cajun 9%
Political lean MEDSL · Providence
- 2024 margin
- D (+14.4) · D 56.1% · R 41.7% · Other 2.2%
- 2008→2024 swing
- -20.0pp toward R · 2008: 34.4pp · 2024: 14.4pp
- All cycles
- 2024: D+14.4 2020: D+22.9 2016: D+21.2 2012: D+34.9 2008: D+34.4
Not yet ingested
- Civics
- —
Market trends
- HPI YoY
- ▼ -215.00%
- Current HPI
- 355.0152
- Rent YoY
- ▲ 3.47%
- Metro
- Providence-Warwick, RI-MA
- State GDP YoY
- ▲ 2.25%
- F500 in state
- 10
Industry mix (Fortune 500 HQ in RI)
| Industry | F500 HQs | Revenue |
|---|---|---|
| Healthcare | 1 | $373B |
|
||
| Food Distribution | 1 | $31B |
|
||
| Aerospace / Defense | 1 | $14B |
|
||
| Financial Services | 1 | $8B |
|
||
| Consumer Goods | 1 | $4B |
|
||
Price history
+44.0% since first listed12 events — show timeline
- 2026-03-24 Pending — RIS
- 2026-03-19 Listed $179,900 RIS
- 2018-03-03 Pending — RIS
- 2018-03-02 Listing Removed — RIS
- 2018-02-05 Listed $69,900 RIS
- 2016-11-08 Price Changed $114,000 RIS
- 2008-03-30 Listing Removed — RIS
- 2007-03-30 Listed $124,900 RIS
- 2005-11-16 Sold (Public Records) $120,000 Public Records
- 2005-11-15 Sold (MLS) $120,000 MLS PIN
- 2005-11-10 Listing Removed — MLS PIN
- 2005-06-30 Listed $124,900 MLS PIN
Property tax history
+1.2%/yrLatest (2025): $1,988 · +6.5% YoY. Source: county tax records.
Cash-flow waterfall
monthlySold comps — $/sqft
last 12 mo · ≤1 miLoading sold comps…