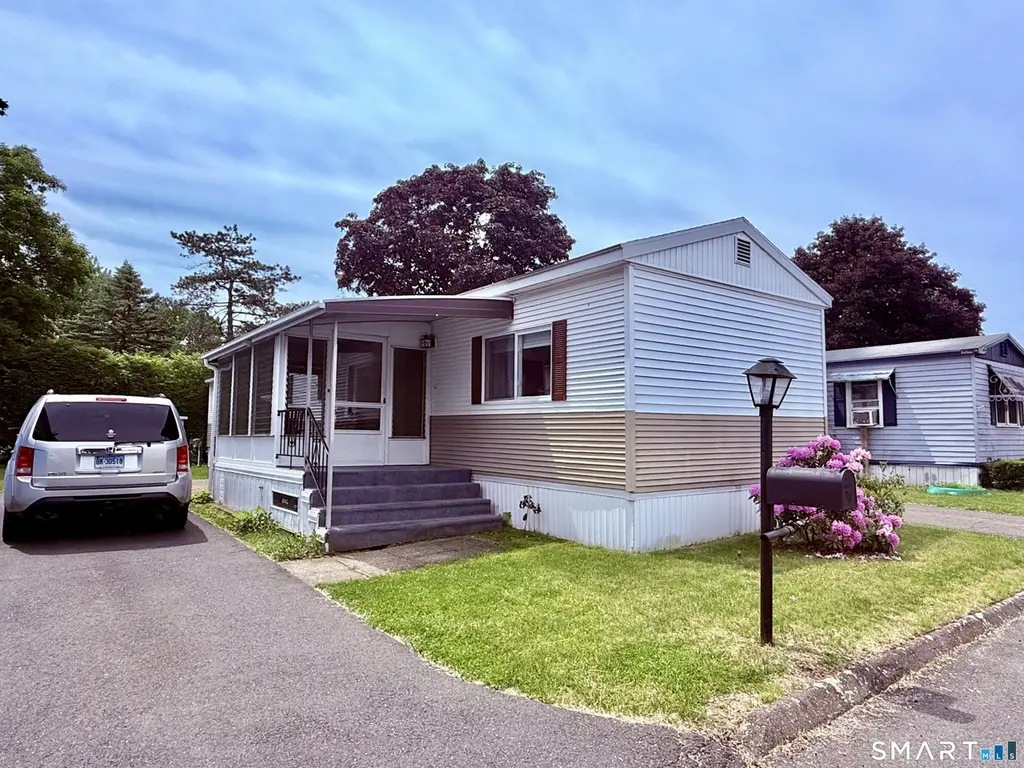
14 Arapaho Dr · East Hartford, CT
Flood risk No data
- FEMA flood zone
- —
- Chance of flooding over 30 yrs
- —
- Est. flood insurance / yr
- —
Fire risk No data
- Est. fire insurance / yr
- —
Heat risk No data
- Hot days now (above threshold)
- —
- Hot days in 30 yrs
- —
Wind risk No data
- Chance of severe wind over 30 yrs
- —
Air-quality risk No data
- Unhealthy air days now
- —
- Unhealthy air days in 30 yrs
- —
Risk factors via First Street. Map © Google.
Why this score? — see what drove the B- grade
The composite is a weighted blend of 9 inputs, each scored 0–100. Each bar is that input's sub-score; the figure is the points it added to the 100-point composite (weight × sub-score).
- Cash flow +30.0/30.0
- 1% rule +10.0/10.0
- DSCR +10.0/10.0
- ARV discount +7.5/15.0
- Livability +3.7/5.0
- Rent growth +2.5/5.0
- Condition / age +2.5/5.0
- Schools +2.1/10.0
- Appreciation +0.0/10.0
$70,000
🖨 Deal sheet (PDF) 📄 Offer letter ✓ Due diligence
Listing remarks MLS
Very well kept-move in condition-remodeled kitchen-newer roof & carpeting-enclosed porch-wheel chair handicap access inside-auto wheelchair lift outside-great park location-some furniture conveys-ez to show
Key facts
- Open floor plan
- Wheelchair lift
- Back patio
Tags
Property features AI
Finance
- Financial info: Property managed by on-site professional management
- HOA & community: Homeowners association with monthly fee; Monthly HOA fee; Association provides property management; Community clubhouse
Exterior
- Parking: Private paved driveway; 2 total parking spaces
- Utilities: Public water connected; Public sewer connected
- Home design: Single-family home; Prefab construction; White/tan exterior
- Construction: Asphalt shingle roof; Vinyl siding; No basement (no foundation listed)
- Exterior features: Enclosed porch; Open porch; Patio; Awnings; Shed; Gutters; Level lot
Interior
- Kitchen: Gas range; Refrigerator
- Bedrooms: 2 bedrooms
- Bathrooms: 1 full bath
- Heating & cooling: Central air; Hot air heating; Kerosene-fueled heat; In-ground fuel tank; Propane hot water
- Interior features: Chair lift; Storm doors; Thermopane windows
- Laundry & utility: Washer; Dryer; Main-level laundry
Neighborhood map
What this means for you Summary
Snapshot
- This is a 2-bed/1.0-bath manufactured listed at $70k.
Deal economics
- At list price, monthly cash flow is $429 ($5k/yr) — positive.
- The deal already cash-flows at list — no discount required.
- Meets the 1% rule at list price ($2k rent vs $70k).
- Recommended offer: $69k (1.5% below list) — sets the bar for market timing.
- Cap rate 13.6% vs local median 4.1% in East Hartford — top-decile yield for the area; either an underpriced asset or a hidden risk that comps aren't pricing in. Stress-test before assuming the spread holds.
Location & tenants
- Location reads 73/100 on livability (#76 in CT) — a middle-class / working-renter tenant base. Strengths: housing A+, crime A, commute A-; Watch: amenities F, health & safety F.
- East Hartford School District (urban): math 17% / reading 30% proficiency, ranked #140 of 153 in CT (top 92%) — low school quality limits family demand, transient renter base, plan for 1-2y turnover.
- Zoned schools: Joseph O. Goodwin School (math 22% / reading 42%, grade F, #361 of 553 statewide, top 68%, 344 students, 71% FRL); East Hartford Middle School (math 12% / reading 26%, grade F, #163 of 175 statewide, top 94%, 890 students, 70% FRL); East Hartford High School (math 11% / reading 33%, grade F, #156 of 194 statewide, top 82%, 1,698 students, 63% FRL).
- Market conditions: 100 active listings in the ZIP; 4 comparable units currently listed for rent nearby; rentals leasing fast (median 4d on market — plan ~1-2 weeks tenant-placement turnaround); solid renter incomes; 1,867 units permitted in Capitol Planning Region in 2024 (1,399 in 5+ unit buildings).
- This rent runs 32% of the median local income ($80k/yr) — at the standard rent-burdened threshold; future hikes will face affordability resistance.
Forward outlook
- Local home prices are declining (-3.0%/yr); year-one equity from $484 of loan paydown is wiped out by about $2k of value loss. Plan a longer hold.
- At projected returns (-3.0% appreciation + 3.0% rent growth), your $20k cash investment doubles in ~5 years — after that, you're playing with house money.
Negotiation context
- It's been on market 25 days — a 2% lower offer ($69k) is reasonable based on typical stale-listing flexibility.
- 2 sale attempts since 23y ago with the ask held roughly flat each time — persistent listings suggest the price (not the market) is what's stuck; bring a comps-based counter.
- Current owner paid $50k; 39% above their basis — modest negotiation headroom, anchor on the comps not their cost.
Risks & watch-outs
- Watch-outs: HOA is 36% of rent.
Questions for the listing agent
- Built in 1975 — when were the roof, HVAC, electrical panel, plumbing, and water heater last replaced?
- What does the HOA fee cover, when was the last increase, and are there any pending special assessments or reserve-fund shortfalls?
- Is there a deadline driving the sale (1031 exchange, divorce, estate, relocation)? That informs how much negotiation room exists.
- Schools are D-rated, which usually means shorter tenancies and higher turnover. Who's the typical renter profile here, and what's been the actual vacancy rate?
- What's the average days-on-market for RENTAL listings here right now (not sales)? A rising rental-DOM trend means longer vacancies and softer asking-rent achievability than the comps imply.
- What's the recent tenant-quality profile in this submarket — average credit score on applications, eviction rate, late-payment / NSF rate, and stable-employment percentage? A property-management company in the area should have these aggregated.
- How much new for-sale + rental construction is in the pipeline within 1–3 miles? Heavy new supply typically softens prices + rents 12–24 months out; constrained supply supports both.
Investment metrics
- 1% rule
- 3.05% ✓
- Cap rate
- 13.65%
- Cash-on-cash
- 26.27%
- DSCR
- 2.17
- GRM
- 2.7
CMA / ARV
No comps found within radius.
Projected returns pro-forma
-3.0% appreciation · 3.0% rent growth · sell at horizon
- IRR
- 20.5%
- Equity multiple
- 1.84×
- Total profit
- $16,489
- Equity at exit
- $10,437
- IRR
- 29.0%
- Equity multiple
- 3.63×
- Total profit
- $51,602
- Equity at exit
- $6,052
Cash invested: $19,600 (down + closing). Projections, not guarantees.
Landlord ↔ Tenant lean methodology
- Overall (STATE)
- 27 Tenant-Leaning
- State Connecticut
- 27 Tenant-Leaning · D+7
- County
- — inherits STATE
- City
- — inherits STATE
ZIP-level market 06118
- Home prices YoY
- -33.7%
- Active inventory
- 100
- Price-to-rent
- 2.7×
Monthly cashflow live
- Estimated rent
- $2,132 medium interval (Pro) →
- Mortgage (P&I)
- −$367
- Tax from tax record
- −$83 /mo · $995/yr
- Insurance
- −$29
- HOA
- −$776
- Vacancy / Maint / Mgmt
- −$448
- Net cashflow
- $429
Break-even live
Sensitivity live
| Price | -10% $469 | -5% $449 | +0% $429 | +5% $409 | +10% $389 |
|---|---|---|---|---|---|
| Rent | -10% $261 | -5% $345 | +0% $429 | +5% $513 | +10% $597 |
| Rate | -1.0pp $464 | -0.5pp $447 | base $429 | +0.5pp $411 | +1.0pp $392 |
UW: 25.0% down · 7.5% · 30yr · 1.5% tax · 5.0% vac · 8.0% maint · 8.0% mgmt
Financing live
Cash to close
- Down payment
- $17,500
- Closing costs
- $2,100
- Reserves months
- —
- Total cash needed
- —
Loan-product check · same deal, 3 products live
Conventional
25% down · 7.5% · 30yr
- Down + closing
- —
- Monthly P&I
- —
- Monthly cashflow
- —
- DSCR
- —
- Eligible?
- —
Personal DTI + credit; lowest rate.
DSCR
20% down · 8.5% · 30yr
- Down + closing
- —
- Monthly P&I
- —
- Monthly cashflow
- —
- DSCR
- —
- Eligible?
- —
No personal income docs; deal must DSCR.
Hard money
10% down · 12.0% · 12mo
- Down + closing
- —
- Monthly P&I
- —
- Monthly cashflow
- —
- DSCR
- —
- Eligible?
- —
Short-term bridge; refi at stabilization.
Rent comps 4 comps
| Address | Beds | Baths | Sqft | Rent | $/sqft | DOM | Units | Dist |
|---|---|---|---|---|---|---|---|---|
| 92 Main St East Hartford, CT | 2.0 | 1.0 | 1100 | $2,200 | $2.00 | 4d | 1 | 0.56mi |
| 210 Handel Rd East Hartford, CT | 3.0 | 1.5 | 912 | $2,400 | $2.63 | 3d | 1 | 0.88mi |
| 10 Glastonbury Blvd Glastonbury, CT | 1.0–3.0 | 1.0–3.0 | 1083 | $3,372 | $3.11 | 3d | 4 | 1.24mi |
| 49 Brewster Rd Unit C Glastonbury, CT | 1.0 | 1.0 | 670 | $1,600 | $2.39 | 5d | 1 | 1.28mi |
HOA detail
- Monthly dues
- $776 · $9,312/yr
Listing history 18 events
-
2026-06-21days on market $70,000 Active 25 DOM
-
2026-06-18days on market $70,000 Active 22 DOM
-
2026-06-17days on market $70,000 Active 21 DOM
-
2026-06-16days on market $70,000 Active 20 DOM
-
2026-06-15days on market $70,000 Active 19 DOM
-
2026-06-13days on market $70,000 Active 17 DOM
-
2026-06-10days on market $70,000 Active 14 DOM
-
2026-06-09days on market $70,000 Active 13 DOM
-
2026-06-08days on market $70,000 Active 12 DOM
-
2026-06-07days on market $70,000 Active 11 DOM
-
2026-06-05days on market $70,000 Active 8 DOM
-
2026-06-03days on market $70,000 Active 7 DOM
-
2026-06-02days on market $70,000 Active 6 DOM
-
2026-06-01days on market $70,000 Active 5 DOM
-
2026-05-31days on market $70,000 Active 4 DOM
-
2026-05-27$70,000 Active
-
2003-10-30soldstatus $50,500 210-char remark
Show marketing remark (210 chars)
Very well kept-move in condition-remodeled kitchen-newer roof & carpeting-enclosed porch-wheel chair handicap access inside-auto wheelchair lift outside-great park location-some furniture conveys-ez to show
-
2003-07-16$54,900 210-char remark
Show marketing remark (210 chars)
Very well kept-move in condition-remodeled kitchen-newer roof & carpeting-enclosed porch-wheel chair handicap access inside-auto wheelchair lift outside-great park location-some furniture conveys-ez to show
ⓘ Source: listings_history table (triggers on properties + properties_extension) + one-shot
backfill from property_details.listing_events for pre-trigger history.
Tax reassessment forecast CT · Partial reset (capped growth)
- Current annual tax
- $995 · $83/mo
- Projected year-2 tax
- $1,246 · $104/mo
- Expected delta
- +$252/yr (+$21/mo · 25.3%)
ⓘ Screening estimate from a state-policy table — verify with the county assessor before closing.
Nearby sold comps map
Loading sold comps map…
Walkable amenities ~0.75 mi
Loading nearby amenities…
Taxation est. · year 1
- Rental income
- $25,583
- − Mortgage interest
- −$3,921
- − Property taxes
- −$995
- − Insurance
- −$350
- − Repairs & maintenance
- −$2,047
- − Management
- −$2,047
- − HOA
- −$9,312
- − Depreciation
- −$2,036
- Taxable income
- $4,875
- Est. tax owed @ 24.0%
- −$1,170
- After-tax cash flow
- $3,978/yr
For passive investors: Depreciation is non-cash, so a rental often shows a tax loss while cash-flowing — sheltering income. Rental losses are passive: they offset passive income freely, and up to $25,000/yr can offset ordinary (W-2) income if you actively participate and your MAGI is under $100k (phasing out to $0 by $150k); unused losses carry forward. On sale, claimed depreciation is recaptured at up to 25%, and gains may owe capital-gains tax (a 1031 exchange can defer both). Figures are a year-1 estimate at your 24.0% rate — not tax advice; consult a CPA.
Schools (NCES district)
- District
- East Hartford School District
- NCES district ID
- 0901260
- Math proficiency
- 17% ▼ -5.00%
- Reading proficiency
- 30% ▼ -7.00%
- Median HH income
- $49,691
- Composite
- 20.74/100
- National rank
- #8519
- State rank
- #140 of 153 in CT
Livability — East Hartford
- Score
- 73/100
- State rank
- #76
- US rank
- #5527
Category grades
Schools grade is shown separately in the Schools card above.
Census & demographics
- Census place
- East Hartford, CT
- County
- Hartford County · 754,208 people
- City population
- 50,918
- Metro
- Hartford-East Hartford-Middletown, CT
- Population (ZIP)
- 27,419
- Household income
- $79,740
- Rent vs Own
- Severe rent burden
- 820.0
Population outlook (Capitol County) Hauer SSP2
- By 2040
- 1,063,519
Race, ethnicity, and origin ACS 2023
- Neighborhood character
- Diverse neighborhood (Simpson 0.69)
- Race & ethnicity
- White 40% Hispanic / Latino 33% Black 20% Two or more races 14% Asian 4%
- Hispanic origin (detail)
- Puerto Rican 22% Dominican 3%
- Common ancestry
- Romanian 4% Lithuanian 4% Scotch-Irish 2%
- Foreign-born
- 17% · Canada, Vietnam, Jamaica
- Languages at home
- 65% English-only · Spanish 23% Other Indo-European 3% Russian/Polish/Slavic 2%
Political lean MEDSL · Capitol
- 2024 margin
- Strong D (+21.9) · D 60.1% · R 38.2% · Other 1.7%
- All cycles
- 2024: D+21.9
Not yet ingested
- Civics
- —
Market trends
- HPI YoY
- ▼ -127.16%
- Current HPI
- 250.5647
- Rent YoY
- —
- Metro
- Hartford-East Hartford-Middletown, CT
- State GDP YoY
- ▲ 1.06%
- F500 in state
- 38
Industry mix (Fortune 500 HQ in CT)
| Industry | F500 HQs | Revenue |
|---|---|---|
| Industrial Machinery | 4 | $38B |
|
||
| Insurance | 3 | $71B |
|
||
| Financial Services | 2 | $25B |
|
||
| Transportation / Logistics | 2 | $18B |
|
||
| Healthcare | 1 | $247B |
|
||
| Telecommunications | 1 | $55B |
|
||
Price history
+27.5% since first listed3 events — show timeline
- 2026-05-27 Listed $70,000 Smart MLS
- 2003-10-30 Sold (MLS) $50,500 Smart MLS
- 2003-07-16 Listed $54,900 Smart MLS
Property tax history
+0.7%/yrLatest (2025): $995 · +4.3% YoY. Source: county tax records.
Cash-flow waterfall
monthlySold comps — $/sqft
last 12 mo · ≤1 miLoading sold comps…