258 S Spencer St · Altamont, PA
Flood risk 1/10 · Minimal
- FEMA flood zone
- X (unshaded)
- Chance of flooding over 30 yrs
- 0.0%
- Est. flood insurance / yr
- $473 – $860
Fire risk 3/10 · Minor
- Est. fire insurance / yr
- $511 – $949
Heat risk 3/10 · Minor
- Hot days now (above 93°F)
- 7 days/yr
- Hot days in 30 yrs
- 15 days/yr
Wind risk 4/10 · Minor
- Chance of severe wind over 30 yrs
- 8.0%
Air-quality risk 2/10 · Minimal
- Unhealthy air days now
- 1 days/yr
- Unhealthy air days in 30 yrs
- 1 days/yr
Risk factors via First Street. Map © Google.
Why this score? — see what drove the B+ grade
The composite is a weighted blend of 9 inputs, each scored 0–100. Each bar is that input's sub-score; the figure is the points it added to the 100-point composite (weight × sub-score).
- Cash flow +30.0/30.0
- ARV discount +15.0/15.0
- DSCR +10.0/10.0
- 1% rule +9.0/10.0
- Livability +3.7/5.0
- Rent growth +2.5/5.0
- Condition / age +2.5/5.0
- Schools +2.4/10.0
- Appreciation +0.0/10.0
$79,900
🖨 Deal sheet (PDF) 📄 Offer letter ✓ Due diligence
Listing remarks
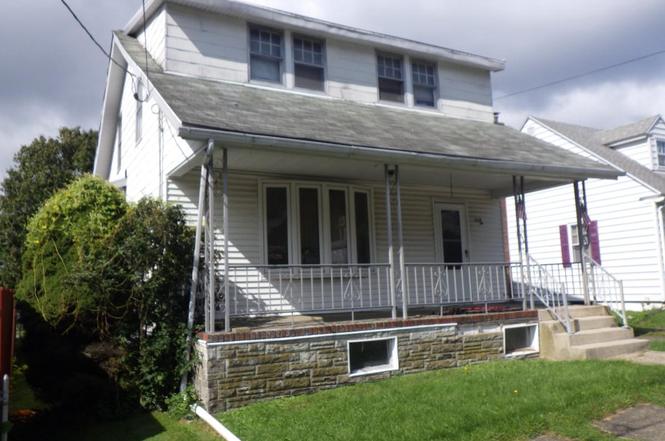
Opportunity awaits at 258 S Spencer Street in Frackville! This 3-bedroom, 1-bath single-family home offers approximately 1,216 square feet of living space and sits on a generous 35' x 150' lot with a spacious backyard, providing plenty of room for outdoor enjoyment, gardening, entertaining, or future improvements. The home has been cleaned out and is ready for its next owner to bring their vision to life. While the property needs cosmetic updates and renovations throughout, it offers solid potential for a homeowner looking to build sweat equity, an investor seeking their next rental property, or a flipper looking for their next project. Conveniently located in the heart of Frackville, this
Key facts
- Spacious backyard
- Nearby attractions
- 5,227 sq ft lot
Tags
Property features AI
Exterior
- Parking: On-street parking
- Utilities: Public water; Public sewer
- Home design: Detached single-family home; Above-grade finished living area approximately 1,216 (estimated)
- Construction: Stick-built construction; Stone foundation; Above- and below-grade structures
- Exterior features: Lot approximately 35 x 150; Not in a federal flood zone
Interior
- Bedrooms: Three bedrooms on the upper level
- Bathrooms: One full bathroom
- Heating & cooling: Hot water baseboard heating; Oil-fired heat; Electric hot water
- Interior features: Full basement
Neighborhood map
What this means for you Summary
Snapshot
- This is a 3-bed/1.0-bath single-family listed at $80k.
Deal economics
- At list price, monthly cash flow is $331 ($4k/yr) — positive.
- The deal already cash-flows at list — no discount required.
- Meets the 1% rule at list price ($1k rent vs $80k).
Location & tenants
- Location reads 74/100 on livability (#482 in PA, #4,451 nationally) — a middle-class / working-renter tenant base. Strengths: cost of living A+, housing A+, health & safety A+; Watch: schools D, amenities F, commute F.
- Shenandoah Valley SD (town): math 20% / reading 38% proficiency, ranked #454 of 539 in PA (top 84%) — low school quality limits family demand, transient renter base, plan for 1-2y turnover; 66% free/reduced lunch — lower-income household profile, screen leases tightly.
- Market conditions: 32 active listings in the ZIP; 169 units permitted in Schuylkill County in 2024 (0 in 5+ unit buildings).
Forward outlook
- Local home prices are declining (-3.0%/yr); year-one equity from $552 of loan paydown is wiped out by about $2k of value loss. Plan a longer hold.
- Schuylkill County population projected at -16% by 2050 — secular population decline; favor cash flow + early exit over multi-decade hold.
- At projected returns (-3.0% appreciation + 3.0% rent growth), your $22k cash investment doubles in ~7 years — after that, you're playing with house money.
Negotiation context
- Only 2 days on market — expect competitive offers; lowballing is unlikely to land.
- Current owner paid $45k; list at $80k implies a 78% gain — meaningful room to come down on a strong offer.
Risks & watch-outs
- Watch-outs: built in 1924 — expect roof / HVAC / electrical / plumbing capex.
Questions for the listing agent
- Built in 1924 — when were the roof, HVAC, electrical panel, plumbing, and water heater last replaced?
- Is there a deadline driving the sale (1031 exchange, divorce, estate, relocation)? That informs how much negotiation room exists.
- Schools are D-rated, which usually means shorter tenancies and higher turnover. Who's the typical renter profile here, and what's been the actual vacancy rate?
- What's the average days-on-market for RENTAL listings here right now (not sales)? A rising rental-DOM trend means longer vacancies and softer asking-rent achievability than the comps imply.
- What's the recent tenant-quality profile in this submarket — average credit score on applications, eviction rate, late-payment / NSF rate, and stable-employment percentage? A property-management company in the area should have these aggregated.
- How much new for-sale + rental construction is in the pipeline within 1–3 miles? Heavy new supply typically softens prices + rents 12–24 months out; constrained supply supports both.
Investment metrics
- 1% rule
- 1.40% ✓
- Cap rate
- 11.27%
- Cash-on-cash
- 17.77%
- DSCR
- 1.79
- GRM
- 6.0
CMA / ARV
- ARV (on-the-fly)
- $124,032
- Comps found
- 9
Show comp detail 9 sales within ~0.75 mi
| Address | Dist | Beds/Ba | Sqft | Sold | Price | $/sf | Match |
|---|---|---|---|---|---|---|---|
| 15 2nd St | 0.67mi | 3/1.0 | 1,242 (+2%) | 9mo | $169,000 | $136 | 58 |
| 241 S Lehigh Ave | 0.33mi | 2/1.0 (-1) | 1,163 (-4%) | 21mo | $115,000 | $99 | 55 |
| 406 Chestnut St | 0.65mi | 4/2.0 (+1) | 1,176 (-3%) | 8mo | $115,000 | $98 | 49 |
| 233 S Lehigh Ave | 0.33mi | 3/2.0 | 1,360 (+12%) | 15mo | $160,000 | $118 | 48 |
| 400 S Nice | 0.51mi | 2/2.0 (-1) | 1,335 (+10%) | 4mo | $220,000 | $165 | 48 |
| 246 N Bell St | 0.62mi | 2/— (-1) | 1,075 (-12%) | 2mo | $110,000 | $102 | 45 |
| 110 E Oak St | 0.29mi | 4/1.0 (+1) | 1,344 (+10%) | 23mo | $130,000 | $97 | 45 |
| 118 W Washington St | 0.62mi | 3/1.0 | 1,350 (+11%) | 14mo | $110,000 | $81 | 41 |
| 312 S 2nd St | 0.64mi | 3/1.0 | 1,120 (-8%) | 23mo | $160,000 | $143 | 38 |
Match score weights: distance 35% · size 25% · config 20% · recency 20%. Top-matched comps best support the ARV.
Projected returns pro-forma
-3.0% appreciation · 3.0% rent growth · sell at horizon
- IRR
- 9.3%
- Equity multiple
- 1.37×
- Total profit
- $8,173
- Equity at exit
- $11,913
- IRR
- 18.5%
- Equity multiple
- 2.54×
- Total profit
- $34,360
- Equity at exit
- $6,908
Cash invested: $22,372 (down + closing). Projections, not guarantees.
Landlord ↔ Tenant lean methodology
- Overall (STATE)
- 62 Landlord-Friendly
- State Pennsylvania
- 62 Landlord-Friendly · EVEN
- County
- — inherits STATE
- City
- — inherits STATE
ZIP-level market 17931
- Home prices YoY
- -22.6%
- Active inventory
- 32
- Price-to-rent
- 6.0×
Monthly cashflow live
- Estimated rent
- $1,118 medium interval (Pro) →
- Mortgage (P&I)
- −$419
- Tax est. 1.5%
- −$100 /mo · $1,198/yr
- Insurance
- −$33
- HOA
- −$0
- Vacancy / Maint / Mgmt
- −$235
- Net cashflow
- $331
Break-even live
Sensitivity live
| Price | -10% $387 | -5% $359 | +0% $331 | +5% $304 | +10% $276 |
|---|---|---|---|---|---|
| Rent | -10% $243 | -5% $287 | +0% $331 | +5% $376 | +10% $420 |
| Rate | -1.0pp $372 | -0.5pp $352 | base $331 | +0.5pp $311 | +1.0pp $290 |
UW: 25.0% down · 7.5% · 30yr · 1.5% tax · 5.0% vac · 8.0% maint · 8.0% mgmt
Financing live
Cash to close
- Down payment
- $19,975
- Closing costs
- $2,397
- Reserves months
- —
- Total cash needed
- —
Loan-product check · same deal, 3 products live
Conventional
25% down · 7.5% · 30yr
- Down + closing
- —
- Monthly P&I
- —
- Monthly cashflow
- —
- DSCR
- —
- Eligible?
- —
Personal DTI + credit; lowest rate.
DSCR
20% down · 8.5% · 30yr
- Down + closing
- —
- Monthly P&I
- —
- Monthly cashflow
- —
- DSCR
- —
- Eligible?
- —
No personal income docs; deal must DSCR.
Hard money
10% down · 12.0% · 12mo
- Down + closing
- —
- Monthly P&I
- —
- Monthly cashflow
- —
- DSCR
- —
- Eligible?
- —
Short-term bridge; refi at stabilization.
Listing history 8 events
-
2026-06-21statusdays on market $79,900 Active 2 DOM
-
2026-06-18days on market $79,900 Coming Soon 7 DOM
-
2026-06-17days on market $79,900 Coming Soon 6 DOM
-
2026-06-16days on market $79,900 Coming Soon 5 DOM
-
2026-06-15days on market $79,900 Coming Soon 4 DOM
-
2026-06-13days on market $79,900 Coming Soon 2 DOM
-
2026-06-12remarks 699-char remark
-
2026-06-12$79,900 Coming Soon 1 DOM
ⓘ Source: listings_history table (triggers on properties + properties_extension) + one-shot
backfill from property_details.listing_events for pre-trigger history.
Climate risk First Street
- Flood 1/10 Low FEMA zone X (unshaded) · 0% chance over 30 yrs
- Wildfire 3/10 Moderate
- Heat 3/10 Moderate 7 d/yr ≥93°F today · 15 d/yr by 30 yrs out
- Wind 4/10 Moderate 8% chance of damaging wind over 30 yrs
- Air quality 2/10 Low 1 unhealthy d/yr today · 1 by 30 yrs out
Nearby sold comps map
Loading sold comps map…
Walkable amenities ~0.75 mi
Loading nearby amenities…
Taxation est. · year 1
- Rental income
- $13,421
- − Mortgage interest
- −$4,476
- − Property taxes
- −$1,198
- − Insurance
- −$400
- − Repairs & maintenance
- −$1,074
- − Management
- −$1,074
- − Depreciation
- −$2,324
- Taxable income
- $2,875
- Est. tax owed @ 24.0%
- −$690
- After-tax cash flow
- $3,286/yr
For passive investors: Depreciation is non-cash, so a rental often shows a tax loss while cash-flowing — sheltering income. Rental losses are passive: they offset passive income freely, and up to $25,000/yr can offset ordinary (W-2) income if you actively participate and your MAGI is under $100k (phasing out to $0 by $150k); unused losses carry forward. On sale, claimed depreciation is recaptured at up to 25%, and gains may owe capital-gains tax (a 1031 exchange can defer both). Figures are a year-1 estimate at your 24.0% rate — not tax advice; consult a CPA.
Schools (NCES district)
- District
- Shenandoah Valley SD
- NCES district ID
- 4221490
- Math proficiency
- 20% ▼ -8.00%
- Reading proficiency
- 38% ▼ -6.00%
- Median HH income
- $31,968
- Composite
- 23.58/100
- National rank
- #7851
- State rank
- #454 of 539 in PA
Livability — Altamont
- Score
- 74/100
- State rank
- #482
- US rank
- #4451
Category grades
Schools grade is shown separately in the Schools card above.
Census & demographics
- Census place
- Altamont, PA
- City population
- 8,726
- Population (ZIP)
- 8,726
Population outlook (Schuylkill County) Hauer SSP2
- Today (2025)
- 137,447 people
- By 2030
- 133,121 · -3.1%
- By 2040
- 124,172 · -9.7%
- By 2050
- 115,611 · -15.9%
- By 2075
- 100,796 · -26.7%
- By 2100
- 86,667 · -36.9%
Race, ethnicity, and origin ACS 2023
- Neighborhood character
- Predominantly White (66%)
- Race & ethnicity
- White 66% Black 23% Hispanic / Latino 9% Two or more races 5%
- Hispanic origin (detail)
- Puerto Rican 4% Dominican 2%
- Common ancestry
- Romanian 10% Iranian 3% Subsaharan African 3%
- Foreign-born
- 1%
- Languages at home
- 91% English-only · Spanish 6% Russian/Polish/Slavic 1% Korean 1%
Political lean MEDSL · Schuylkill
- 2024 margin
- Solid R (+42.1) · D 28.5% · R 70.6%
- 2008→2024 swing
- -33.4pp toward R · 2008: -8.7pp · 2024: -42.1pp
- All cycles
- 2024: R+42.1 2020: R+39.9 2016: R+43.4 2012: R+13.4 2008: R+8.7
Not yet ingested
- Civics
- —
Market trends
- HPI YoY
- ▼ -48.47%
- Current HPI
- 165.7692
- Rent YoY
- —
- Metro
- —
- State GDP YoY
- ▲ 1.68%
- F500 in state
- 34
Industry mix (Fortune 500 HQ in PA)
| Industry | F500 HQs | Revenue |
|---|---|---|
| Healthcare | 2 | $309B |
|
||
| Insurance | 2 | $27B |
|
||
| Telecommunications / Media | 1 | $124B |
|
||
| Industrial Distribution | 1 | $22B |
|
||
| Financial Services | 1 | $20B |
|
||
| Chemicals / Materials | 1 | $18B |
|
||
Price history
+77.6% since first listed2 events — show timeline
- 2026-06-11 Coming Soon $79,900 BRIGHT MLS
- 1991-03-27 Sold (Public Records) $45,000 Public Records
Property tax history
+18.6%/yrLatest (2026): $9,462 · +485.1% YoY. Source: county tax records.
Cash-flow waterfall
monthlySold comps — $/sqft
last 12 mo · ≤1 miLoading sold comps…