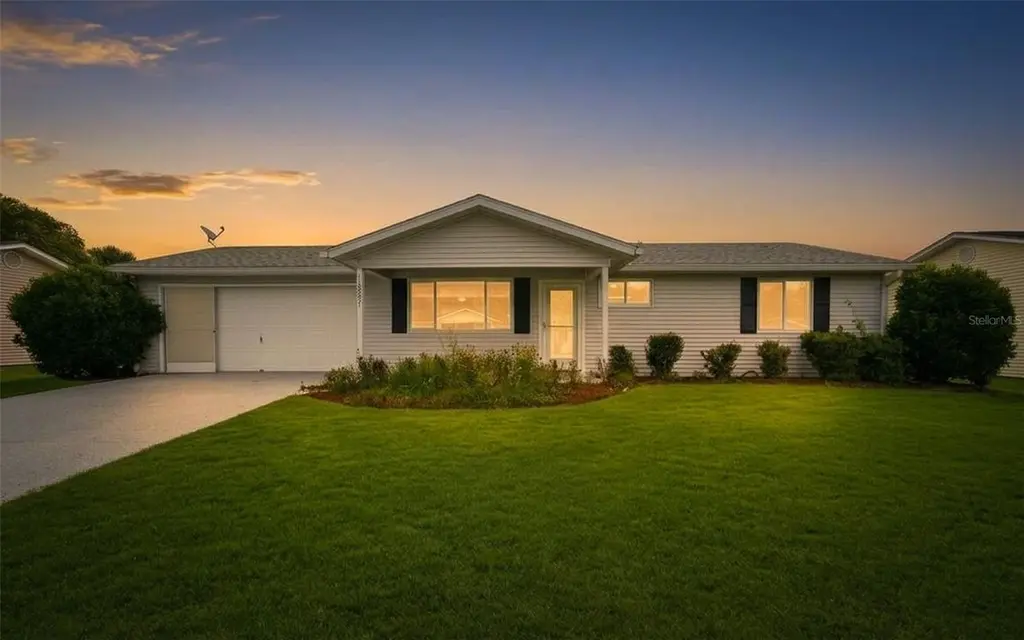
10937 SW 83rd Ter · Liberty Triangle, FL
Flood risk 1/10 · Minimal
- FEMA flood zone
- X (unshaded)
- Chance of flooding over 30 yrs
- 0.0%
- Est. flood insurance / yr
- $507 – $1,088
Fire risk 4/10 · Minor
- Est. fire insurance / yr
- $947 – $1,759
Heat risk 8/10 · Major
- Hot days now (above 107°F)
- 7 days/yr
- Hot days in 30 yrs
- 23 days/yr
Wind risk 9/10 · Severe
- Chance of severe wind over 30 yrs
- 99.0%
Air-quality risk 3/10 · Minor
- Unhealthy air days now
- 3 days/yr
- Unhealthy air days in 30 yrs
- 3 days/yr
Risk factors via First Street. Map © Google.
Why this score? — see what drove the D grade
The composite is a weighted blend of 9 inputs, each scored 0–100. Each bar is that input's sub-score; the figure is the points it added to the 100-point composite (weight × sub-score).
- Cash flow +14.5/30.0
- ARV discount +6.6/15.0
- 1% rule +4.9/10.0
- DSCR +4.4/10.0
- Schools +3.6/10.0
- Rent growth +2.5/5.0
- Livability +2.5/5.0
- Condition / age +2.5/5.0
- Appreciation +0.0/10.0
$160,000
🖨 Deal sheet (PDF) 📄 Offer letter ✓ Due diligence
Listing remarks MLS
What a SCORE! This 2/1/2 in the highly desirable 55+ golf community Oak Run, has essentially been brought back to life. New hvac, roof, kitchen counter tops, enclosed lanai with screen/vinyl windows, hot water heater and a completely remodeled bathroom. Move right in with only your belongings and start living! Ample living space throughout complete with new ceiling fans. Bedrooms provide generous space and plenty of closet storage. Bathroom has been fitted with new toilet, granite his & her sink space, and walk-in shower with handrails which accommodates easy transition. New appliances have been added to kitchen complete with custom fitted microwave. Lanai area lets you enjoy Florida in any season as it's completely screened with vinyl windows and includes stand-alone air conditioning unit. But don't stop there, your 2 car garage space has workshop area complete with tools and even a newly added utility sink perfect for washing up or aiding in laundry. Driveway has even been re-finished and painted! Don't pass up your opportunity to own a like-new home in a beautiful SW Ocala community.
Key facts
- Gated community
- Indoor heated pool
- Tile flooring
Tags
Property features AI
Finance
- Other: Unfurnished; Lease restrictions apply
- HOA & community: Monthly HOA fee $150 (includes recreational facilities); Association amenities: clubhouse, fitness center, gated community, park, pool, pickleball courts, recreation facilities, spa/hot tub; Buyer approval required for association; Senior community; Pets allowed
Exterior
- Parking: Attached garage; 2-car garage
- Utilities: Public water; Public sewer; Public utilities
- Home design: Single family residence; One story; Entry faces east; PUD zoning
- Construction: Vinyl siding; Shingle roof; Slab foundation; Built on one level
- Exterior features: Covered and enclosed patio/porches; Front porch; Rear porch; Level lot; Mature landscaping; Asphalt road
Interior
- Kitchen: Dishwasher; Microwave; Refrigerator
- Bedrooms: 2 bedrooms
- Flooring: Carpet; Ceramic tile; Vinyl
- Bathrooms: 1 full bathroom
- Heating & cooling: Central heating; Central air conditioning
- Interior features: Ceiling fans; Eat-in kitchen; Window treatments; Blinds
- Laundry & utility: Washer in garage
Neighborhood map
What this means for you Summary
Snapshot
- This is a 2-bed/1.0-bath single-family listed at $160k.
Deal economics
- At list price, monthly cash flow is $35 ($416/yr) — positive.
- The deal already cash-flows at list — no discount required.
- To meet the 1% rule (rent ≥ 1% of price), the offer needs to be $159k (0.8% below list).
- Recommended offer: $158k (1.5% below list) — sets the bar for market timing.
- Cap rate 6.6% vs local median 4.5% in Liberty Triangle — top-decile yield for the area; either an underpriced asset or a hidden risk that comps aren't pricing in. Stress-test before assuming the spread holds.
Location & tenants
- Location reads: area grade D — affects rentability + tenant quality, not the cash-flow math above.
- Marion (rural): math 42% / reading 43% proficiency, ranked #61 of 73 in FL (top 84%) — families likely to look elsewhere, expect single-tenant / working-renter base with shorter leases; 61% free/reduced lunch — lower-income household profile, screen leases tightly.
- Zoned schools: Marion Oaks Elementary School (math 38% / reading 39%, grade F, #1,575 of 2,144 statewide, top 74%, 939 students, 65% FRL); Liberty Middle School (math 40% / reading 41%, grade F, #360 of 571 statewide, top 64%, 1,365 students, 54% FRL); West Port High School (math 34% / reading 52%, grade F, #255 of 667 statewide, top 39%, 2,906 students, 52% FRL) — zoned schools at 57% FRL track the district average.
- Market conditions: 1161 active listings in the ZIP; 6 comparable units currently listed for rent nearby; rentals at typical pace (median 23d on market — plan ~3-4 weeks tenant-placement turnaround); 7,071 units permitted in Marion County in 2024 (534 in 5+ unit buildings).
- This rent runs 33% of the median local income ($57k/yr) — at the standard rent-burdened threshold; future hikes will face affordability resistance.
Forward outlook
- Local home prices are declining (-3.0%/yr); year-one equity from $1k of loan paydown is wiped out by about $5k of value loss. Plan a longer hold.
- Marion County population projected at +13% by 2050 — modest demand growth; plan on rents tracking national, not racing it.
Negotiation context
- It's been on market 19 days — a 2% lower offer ($158k) is reasonable based on typical stale-listing flexibility.
- 4 sale attempts since 12y ago with the ask held roughly flat each time — persistent listings suggest the price (not the market) is what's stuck; bring a comps-based counter.
- Current owner paid $128k; 25% above their basis — modest negotiation headroom, anchor on the comps not their cost.
Risks & watch-outs
- Climate carrying-cost: severe wind risk, 99% chance of damaging wind over 30y; extreme-heat days projected 7→23/yr by 2055 (HVAC capex compounding) — expect insurance premiums to compound above CPI over the hold.
Questions for the listing agent
- What does the HOA fee cover, when was the last increase, and are there any pending special assessments or reserve-fund shortfalls?
- Is there a deadline driving the sale (1031 exchange, divorce, estate, relocation)? That informs how much negotiation room exists.
- The area grade is low — what's the realistic commute time and amenity access for the typical tenant pool here? Any planned neighborhood developments (good or bad) we should know about?
- What's the average days-on-market for RENTAL listings here right now (not sales)? A rising rental-DOM trend means longer vacancies and softer asking-rent achievability than the comps imply.
- What's the recent tenant-quality profile in this submarket — average credit score on applications, eviction rate, late-payment / NSF rate, and stable-employment percentage? A property-management company in the area should have these aggregated.
- How much new for-sale + rental construction is in the pipeline within 1–3 miles? Heavy new supply typically softens prices + rents 12–24 months out; constrained supply supports both.
Investment metrics
- 1% rule
- 0.99% ✗
- Cap rate
- 6.55%
- Cash-on-cash
- 0.93%
- DSCR
- 1.04
- GRM
- 8.4
CMA / ARV
- ARV (on-the-fly)
- $156,864
- Comps found
- 12
Show comp detail 12 sales within ~0.75 mi
| Address | Dist | Beds/Ba | Sqft | Sold | Price | $/sf | Match |
|---|---|---|---|---|---|---|---|
| 8431 SW 109th Lane Rd | 0.13mi | 1/1.0 (-1) | 912 (0%) | 4mo | $103,000 | $113 | 86 |
| 10940 SW 87th Ct | 0.39mi | 2/2.0 | 960 (+5%) | 2mo | $178,000 | $185 | 68 |
| 8108 SW 108th Place Rd | 0.30mi | 2/2.0 | 992 (+9%) | 4mo | $160,000 | $161 | 64 |
| 11401 SW 85th Ct | 0.34mi | 2/2.0 | 1,000 (+10%) | 4mo | $187,000 | $187 | 61 |
| 8140 SW 109th Street Rd | 0.22mi | 2/2.0 | 1,000 (+10%) | 12mo | $204,900 | $205 | 60 |
| 11520 SW 85th Ct | 0.42mi | 2/2.0 | 988 (+8%) | 3mo | $170,000 | $172 | 60 |
| 10917 SW 82nd Ter | 0.15mi | 2/2.0 | 1,032 (+13%) | 11mo | $115,000 | $111 | 58 |
| 8344 SW 107th Pl | 0.54mi | 2/2.0 | 960 (+5%) | 8mo | $143,200 | $149 | 56 |
| 8329 SW 105th Pl | 0.74mi | 2/2.0 | 960 (+5%) | 2mo | $185,000 | $193 | 51 |
| 8473 SW 106th St | 0.69mi | 2/2.0 | 936 (+3%) | 10mo | $133,000 | $142 | 51 |
| 8343 SW 105th Pl | 0.74mi | 2/2.0 | 936 (+3%) | 11mo | $150,000 | $160 | 48 |
| 8244 SW 106th Pl | 0.60mi | 2/2.0 | 990 (+9%) | 12mo | $183,000 | $185 | 44 |
Match score weights: distance 35% · size 25% · config 20% · recency 20%. Top-matched comps best support the ARV.
Projected returns pro-forma
-3.0% appreciation · 3.0% rent growth · sell at horizon
- IRR
- -14.7%
- Equity multiple
- 0.47×
- Total profit
- $-23,623
- Equity at exit
- $23,857
- IRR
- -6.0%
- Equity multiple
- 0.61×
- Total profit
- $-17,343
- Equity at exit
- $13,834
Cash invested: $44,800 (down + closing). Projections, not guarantees.
Landlord ↔ Tenant lean methodology
- Overall (STATE)
- 87 Strongly Landlord-Friendly
- State Florida
- 87 Strongly Landlord-Friendly · R+3
- County
- — inherits STATE
- City
- — inherits STATE
ZIP-level market 34481
- Home prices YoY
- -25.2%
- Active inventory
- 1161
- Price-to-rent
- 8.4×
Monthly cashflow live
- Estimated rent
- $1,588 high interval (Pro) →
- Mortgage (P&I)
- −$839
- Tax from tax record
- −$164 /mo · $1,967/yr
- Insurance
- −$67
- HOA
- −$150
- Vacancy / Maint / Mgmt
- −$333
- Net cashflow
- $35
Break-even live
Sensitivity live
| Price | -10% $125 | -5% $80 | +0% $35 | +5% $-11 | +10% $-56 |
|---|---|---|---|---|---|
| Rent | -10% $-91 | -5% $-28 | +0% $35 | +5% $97 | +10% $160 |
| Rate | -1.0pp $115 | -0.5pp $75 | base $35 | +0.5pp $-7 | +1.0pp $-49 |
UW: 25.0% down · 7.5% · 30yr · 1.5% tax · 5.0% vac · 8.0% maint · 8.0% mgmt
Financing live
Cash to close
- Down payment
- $40,000
- Closing costs
- $4,800
- Reserves months
- —
- Total cash needed
- —
Loan-product check · same deal, 3 products live
Conventional
25% down · 7.5% · 30yr
- Down + closing
- —
- Monthly P&I
- —
- Monthly cashflow
- —
- DSCR
- —
- Eligible?
- —
Personal DTI + credit; lowest rate.
DSCR
20% down · 8.5% · 30yr
- Down + closing
- —
- Monthly P&I
- —
- Monthly cashflow
- —
- DSCR
- —
- Eligible?
- —
No personal income docs; deal must DSCR.
Hard money
10% down · 12.0% · 12mo
- Down + closing
- —
- Monthly P&I
- —
- Monthly cashflow
- —
- DSCR
- —
- Eligible?
- —
Short-term bridge; refi at stabilization.
Rent comps 6 comps
| Address | Beds | Baths | Sqft | Rent | $/sqft | DOM | Units | Dist |
|---|---|---|---|---|---|---|---|---|
| 8130 SW 108th Street Rd Ocala, FL | 2.0 | 2.0 | 1084 | $1,975 | $1.82 | 23d | 1 | 0.31mi |
| 11112 SW 78th Ave Ocala, FL | 2.0 | 1.0 | 672 | $1,150 | $1.71 | 23d | 1 | 0.57mi |
| 8942 SW 109th Ln Ocala, FL | 2.0 | 2.0 | 960 | $1,450 | $1.51 | 23d | 1 | 0.60mi |
| 8947 SW 108th Pl Ocala, FL | 2.0 | 2.0 | 1096 | $1,500 | $1.37 | 23d | 1 | 0.66mi |
| 10441 SW 85th Ct Ocala, FL | 2.0 | 2.0 | 1090 | $1,495 | $1.37 | 23d | 1 | 0.83mi |
| 9075 SW 102nd Pl Ocala, FL | 2.0 | 2.0 | 1008 | $1,275 | $1.26 | 23d | 1 | 1.29mi |
HOA detail
- Monthly dues
- $150 · $1,800/yr
- Likely covers
- water
Listing history 15 events
-
2026-06-21statusdays on market $160,000 Pending 19 DOM
-
2026-06-18days on market $160,000 Active 18 DOM
-
2026-06-17days on market $160,000 Active 17 DOM
-
2026-06-16days on market $160,000 Active 16 DOM
-
2026-06-15days on market $160,000 Active 15 DOM
-
2026-06-14days on market $160,000 Active 13 DOM
-
2026-06-13days on market $160,000 Active 12 DOM
-
2026-06-10days on market $160,000 Active 10 DOM
-
2026-06-09days on market $160,000 Active 9 DOM
-
2026-06-08days on market $160,000 Active 8 DOM
-
2026-06-07days on market $160,000 Active 7 DOM
-
2026-06-03days on market $160,000 Active 3 DOM
-
2026-06-02days on market $160,000 Active 2 DOM
-
2026-06-01remarks 699-char remark
-
2026-06-01$160,000 Active 1 DOM
ⓘ Source: listings_history table (triggers on properties + properties_extension) + one-shot
backfill from property_details.listing_events for pre-trigger history.
Tax reassessment forecast FL · Resets to sale price
- Current annual tax
- $1,967 · $164/mo
- Projected year-2 tax
- $1,967 · $164/mo
- Expected delta
- $0/yr ($0/mo · 0.0%)
ⓘ Screening estimate from a state-policy table — verify with the county assessor before closing.
Climate risk First Street
- Flood 1/10 Low FEMA zone X (unshaded) · 0% chance over 30 yrs
- Wildfire 4/10 Moderate
- Heat 8/10 Severe 7 d/yr ≥107°F today · 23 d/yr by 30 yrs out
- Wind 9/10 Extreme 99% chance of damaging wind over 30 yrs
- Air quality 3/10 Moderate 3 unhealthy d/yr today · 3 by 30 yrs out
Nearby sold comps map
Loading sold comps map…
Walkable amenities ~0.75 mi
Loading nearby amenities…
Taxation est. · year 1
- Rental income
- $19,053
- − Mortgage interest
- −$8,962
- − Property taxes
- −$1,967
- − Insurance
- −$800
- − Repairs & maintenance
- −$1,524
- − Management
- −$1,524
- − HOA
- −$1,800
- − Depreciation
- −$4,655
- Taxable loss
- −$2,179
- Est. tax savings @ 24.0%
- +$523
- After-tax cash flow
- $939/yr
For passive investors: Depreciation is non-cash, so a rental often shows a tax loss while cash-flowing — sheltering income. Rental losses are passive: they offset passive income freely, and up to $25,000/yr can offset ordinary (W-2) income if you actively participate and your MAGI is under $100k (phasing out to $0 by $150k); unused losses carry forward. On sale, claimed depreciation is recaptured at up to 25%, and gains may owe capital-gains tax (a 1031 exchange can defer both). Figures are a year-1 estimate at your 24.0% rate — not tax advice; consult a CPA.
Schools (NCES district)
- District
- Marion
- NCES district ID
- 1201260
- Math proficiency
- 42% ▼ -7.00%
- Reading proficiency
- 43% ▼ -4.00%
- Median HH income
- $40,015
- Composite
- 35.61/100
- National rank
- #4890
- State rank
- #61 of 73 in FL
Livability — Liberty Triangle
No livability data for this city. (Only ~50 U.S. cities are tracked.)
Census & demographics
- Census place
- Liberty Triangle, FL
- County
- Marion County · 315,796 people
- City population
- 26,397
- Metro
- Ocala, FL
- Population (ZIP)
- 26,782
- Household income
- $57,324
- Rent vs Own
- Severe rent burden
- 313.0
Population outlook (Marion County) Hauer SSP2
- Today (2025)
- 365,905 people
- By 2030
- 376,768 · +3.0%
- By 2040
- 396,555 · +8.4%
- By 2050
- 412,723 · +12.8%
- By 2075
- 446,090 · +21.9%
- By 2100
- 436,193 · +19.2%
Race, ethnicity, and origin ACS 2023
- Neighborhood character
- Predominantly White (80%)
- Race & ethnicity
- White 80% Hispanic / Latino 11% Black 7% Two or more races 5%
- Hispanic origin (detail)
- Mexican 4% Puerto Rican 4% Cuban 1%
- Common ancestry
- Romanian 7% Lithuanian 3% Slovak 2%
- Foreign-born
- 8% · Canada, Jamaica
- Languages at home
- 88% English-only · Spanish 9% French/Haitian/Cajun 1% German/W. Germanic 1%
Political lean MEDSL · Marion
- 2024 margin
- Solid R (+31.6) · D 33.8% · R 65.5%
- 2008→2024 swing
- -20.0pp toward R · 2008: -11.6pp · 2024: -31.6pp
- All cycles
- 2024: R+31.6 2020: R+25.9 2016: R+26.2 2012: R+16.2 2008: R+11.6
Not yet ingested
- Civics
- —
Market trends
- HPI YoY
- ▼ -67.48%
- Current HPI
- 199.986
- Rent YoY
- —
- Metro
- Ocala, FL
- State GDP YoY
- ▲ 3.28%
- F500 in state
- 36
Industry mix (Fortune 500 HQ in FL)
| Industry | F500 HQs | Revenue |
|---|---|---|
| Industrial Technology | 2 | $29B |
|
||
| Insurance | 2 | $17B |
|
||
| Retail | 1 | $60B |
|
||
| Technology Distribution | 1 | $58B |
|
||
| Homebuilding | 1 | $35B |
|
||
| Technology Manufacturing | 1 | $35B |
|
||
Price history
+285.5% since first listed13 events — show timeline
- 2026-05-31 Listed $160,000 Stellar MLS as Distributed by MLS Grid
- 2021-04-01 Sold (Public Records) $128,000 Public Records
- 2021-03-30 Pending — Stellar MLS as Distributed by MLS Grid
- 2021-03-30 Sold (MLS) $128,000 Stellar MLS as Distributed by MLS Grid
- 2021-03-08 Pending — Stellar MLS as Distributed by MLS Grid
- 2021-03-03 Listed $129,500 Stellar MLS as Distributed by MLS Grid
- 2020-08-18 Sold (Public Records) $97,000 Public Records
- 2020-08-14 Sold (MLS) $97,000 Stellar MLS as Distributed by MLS Grid
- 2020-08-02 Listed $105,000 Stellar MLS as Distributed by MLS Grid
- 2014-10-27 Sold (Public Records) $47,000 Public Records
- 2014-10-24 Sold (MLS) $47,000 Stellar MLS as Distributed by MLS Grid
- 2014-09-20 Listed $48,750 Stellar MLS as Distributed by MLS Grid
- 1987-10-01 Sold (Public Records) $41,503 Public Records
Property tax history
+6.7%/yrLatest (2025): $1,967 · +0.5% YoY. Source: county tax records.
Cash-flow waterfall
monthlySold comps — $/sqft
last 12 mo · ≤1 miLoading sold comps…