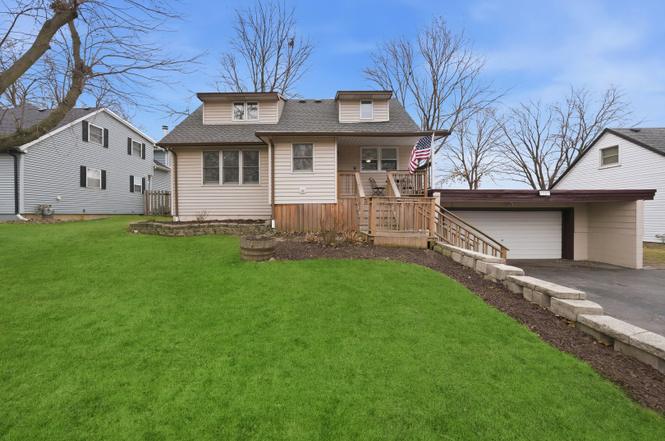
9307 Ethyl Ln · Tinley Park, IL
Flood risk 1/10 · Minimal
- FEMA flood zone
- X (unshaded)
- Chance of flooding over 30 yrs
- 0.0%
- Est. flood insurance / yr
- $473 – $860
Fire risk 1/10 · Minimal
- Est. fire insurance / yr
- $804 – $1,492
Heat risk 3/10 · Minor
- Hot days now (above 103°F)
- 7 days/yr
- Hot days in 30 yrs
- 15 days/yr
Wind risk 2/10 · Minimal
- Chance of severe wind over 30 yrs
- —
Air-quality risk 4/10 · Minor
- Unhealthy air days now
- 4 days/yr
- Unhealthy air days in 30 yrs
- 5 days/yr
Risk factors via First Street. Map © Google.
Why this score? — see what drove the D grade
The composite is a weighted blend of 9 inputs, each scored 0–100. Each bar is that input's sub-score; the figure is the points it added to the 100-point composite (weight × sub-score).
- Cash flow +14.9/30.0
- ARV discount +7.5/15.0
- DSCR +4.6/10.0
- 1% rule +4.5/10.0
- Schools +4.3/10.0
- Livability +3.7/5.0
- Rent growth +2.5/5.0
- Condition / age +2.5/5.0
- Appreciation +0.0/10.0
$349,000
🖨 Deal sheet 📄 Offer letter ✓ Due diligence
Listing remarks MLS
Home Priced to sell !! Larger than it Looks !! Very nicely updated home w/ neutral colors and Pergo floors. Very Large room sizes w/ full finished basement. Unique entry way with cute foyer. Huge wood deck, mature trees, just an absolute beautiful property for a great price. 12x12 Barn in backyard!! Hurry this is the one. Across from Park !!
Key facts
- Second kitchenette
- Bright white kitchen
- Oversized deck
Tags
Property features AI
Finance
- Other: Lot dimensions approximately 73 x 158 (lot between 0.25 and 0.49 acre); Living area reported as estimated; Property not currently leased; Possession at closing
- HOA & community: No master association fee required
Exterior
- Parking: Attached garage (garage owned) with two garage spaces; Asphalt driveway; Garage door opener
- Utilities: Water: Lake Michigan; Public sewer; Electric service with circuit breakers
- Home design: Detached single-family home; 1.5-story design; Fee simple ownership
- Construction: Aluminum siding; Built before 1978
- Exterior features: Deck
Interior
- Kitchen: Main-level kitchen with eating area/table space; Basement secondary kitchen; Range; Microwave; Dishwasher; Refrigerator
- Bedrooms: Three bedrooms total — primary bedroom on the main level; additional bedrooms on the second floor
- Flooring: Laminate flooring in multiple areas; Wood laminate in kitchen, living room and master bedroom; Parquet in family room; Carpet in upper-level bedrooms; Vinyl in basement kitchen
- Bathrooms: Two full bathrooms and one half bath; Separate shower
- Heating & cooling: Natural gas forced-air heating; Central air conditioning
- Interior features: First-floor bedroom; Finished full basement; Screens on windows; Seven total rooms; Basement kitchen (second kitchen in basement); Basement fireplace with gas log and gas starter
- Laundry & utility: In-unit laundry with gas dryer hookup; Washer; Dryer
Neighborhood map
What this means for you Summary
Snapshot
- This is a 3-bed/1.5-bath other listed at $349k.
Deal economics
- At list price, monthly cash flow is $102 ($1k/yr) — positive.
- The deal already cash-flows at list — no discount required.
- To meet the 1% rule (rent ≥ 1% of price), the offer needs to be $331k (5.2% below list).
- Recommended offer: $318k (9.0% below list) — sets the bar for market timing.
- Cap rate 6.6% vs local median 4.3% in Tinley Park — top-decile yield for the area; either an underpriced asset or a hidden risk that comps aren't pricing in. Stress-test before assuming the spread holds.
Location & tenants
- Location reads 74/100 on livability (#246 in IL, #4,453 nationally) — a middle-class / working-renter tenant base. Strengths: commute A+, employment A+, housing A+; Watch: amenities F, health & safety F.
- Lincoln Way Chsd 210 (suburban): math 44% / reading 49% proficiency, ranked #60 of 620 in IL (top 10%) — families likely to look elsewhere, expect single-tenant / working-renter base with shorter leases.
- Market conditions: 52 active listings in the ZIP; 3 comparable units currently listed for rent nearby; rentals leasing fast (median 6d on market — plan ~1-2 weeks tenant-placement turnaround); 2,028 units permitted in Will County in 2024 (530 in 5+ unit buildings).
Forward outlook
- Local home prices are declining (-3.0%/yr); year-one equity from $2k of loan paydown is wiped out by about $10k of value loss. Plan a longer hold.
- Will County population projected to shrink 4% by 2050 — rents likely to lag national; underwrite the cash flow, not the appreciation.
Negotiation context
- It's been on market 114 days — a 9% lower offer ($318k) is reasonable based on typical stale-listing flexibility.
- 2 sale attempts since 19y ago with the ask held roughly flat each time — persistent listings suggest the price (not the market) is what's stuck; bring a comps-based counter.
- Current owner paid $205k; list at $349k implies a 70% gain — meaningful room to come down on a strong offer.
Questions for the listing agent
- It's been on market 114 days. Have you received any prior offers? Is the seller open to a 9% concession, seller financing, or rate buy-down credit?
- Built in 1960 — when were the roof, HVAC, electrical panel, plumbing, and water heater last replaced?
- Why hasn't it sold? Are there any deal-killer items the seller is aware of (foundation, flood, title, zoning, code violations)?
- Is there a deadline driving the sale (1031 exchange, divorce, estate, relocation)? That informs how much negotiation room exists.
- The area grade is low — what's the realistic commute time and amenity access for the typical tenant pool here? Any planned neighborhood developments (good or bad) we should know about?
- What's the average days-on-market for RENTAL listings here right now (not sales)? A rising rental-DOM trend means longer vacancies and softer asking-rent achievability than the comps imply.
- What's the recent tenant-quality profile in this submarket — average credit score on applications, eviction rate, late-payment / NSF rate, and stable-employment percentage? A property-management company in the area should have these aggregated.
- How much new for-sale + rental construction is in the pipeline within 1–3 miles? Heavy new supply typically softens prices + rents 12–24 months out; constrained supply supports both.
Investment metrics
- 1% rule
- 0.95% ✗
- Cap rate
- 6.64%
- Cash-on-cash
- 1.25%
- DSCR
- 1.06
- GRM
- 8.8
CMA / ARV
No comps found within radius.
Projected returns pro-forma
-3.0% appreciation · 3.0% rent growth · sell at horizon
- IRR
- -14.3%
- Equity multiple
- 0.49×
- Total profit
- $-49,944
- Equity at exit
- $52,037
- IRR
- -5.4%
- Equity multiple
- 0.65×
- Total profit
- $-34,671
- Equity at exit
- $30,175
Cash invested: $97,720 (down + closing). Projections, not guarantees.
Landlord ↔ Tenant lean methodology
- Overall (STATE)
- 43 Moderately Tenant-Leaning
- State Illinois
- 43 Moderately Tenant-Leaning · D+7
- County
- — inherits STATE
- City
- — inherits STATE
ZIP-level market 60487
- Active inventory
- 52
- Price-to-rent
- 8.8×
Monthly cashflow live
- Estimated rent
- $3,308 medium interval (Pro) →
- Mortgage (P&I)
- −$1,830
- Tax from tax record
- −$536 /mo · $6,432/yr
- Insurance
- −$145
- HOA
- −$0
- Vacancy / Maint / Mgmt
- −$695
- Net cashflow
- $102
Break-even live
UW: 25.0% down · 7.5% · 30yr · 1.5% tax · 5.0% vac · 8.0% maint · 8.0% mgmt
Financing live
Cash to close
- Down payment
- $87,250
- Closing costs
- $10,470
- Reserves months
- —
- Total cash needed
- —
Loan-product check · same deal, 3 products live
Conventional
25% down · 7.5% · 30yr
- Down + closing
- —
- Monthly P&I
- —
- Monthly cashflow
- —
- DSCR
- —
- Eligible?
- —
Personal DTI + credit; lowest rate.
DSCR
20% down · 8.5% · 30yr
- Down + closing
- —
- Monthly P&I
- —
- Monthly cashflow
- —
- DSCR
- —
- Eligible?
- —
No personal income docs; deal must DSCR.
Hard money
10% down · 12.0% · 12mo
- Down + closing
- —
- Monthly P&I
- —
- Monthly cashflow
- —
- DSCR
- —
- Eligible?
- —
Short-term bridge; refi at stabilization.
Rent comps 3 comps
| Address | Beds | Baths | Sqft | Rent | $/sqft | DOM | Units | Dist |
|---|---|---|---|---|---|---|---|---|
| 9264 Windsor Pkwy Tinley Park, IL | 3.0 | 2.0 | 1800 | $3,200 | $1.78 | 1d | 1 | 1.08mi |
| 9234 Windsor Pkwy Tinley Park, IL | 3.0 | 2.0 | 1800 | $3,200 | $1.78 | 15d | 1 | 1.19mi |
| 9407 Elm Ave Mokena, IL | 3.0 | 1.5 | 1400 | $3,500 | $2.50 | 5d | 1 | 1.29mi |
Listing history 20 events
-
2026-06-18days on market $349,000 Active 114 DOM
-
2026-06-17days on market $349,000 Active 113 DOM
-
2026-06-16days on market $349,000 Active 112 DOM
-
2026-06-15days on market $349,000 Active 111 DOM
-
2026-06-13days on market $349,000 Active 109 DOM
-
2026-06-13days on market $349,000 Active 108 DOM
-
2026-06-09days on market $349,000 Active 105 DOM
-
2026-06-08days on market $349,000 Active 104 DOM
-
2026-06-07days on market $349,000 Active 103 DOM
-
2026-06-04days on market $349,000 Active 100 DOM
-
2026-06-03days on market $349,000 Active 99 DOM
-
2026-06-02days on market $349,000 Active 98 DOM
-
2026-06-01days on market $349,000 Active 97 DOM
-
2026-05-31days on market $349,000 Active 96 DOM
-
2026-02-24$349,000 Active
-
2007-06-04soldstatus $205,000
-
2007-05-24soldstatus $205,000 344-char remark
Show marketing remark (344 chars)
Home Priced to sell !! Larger than it Looks !! Very nicely updated home w/ neutral colors and Pergo floors. Very Large room sizes w/ full finished basement. Unique entry way with cute foyer. Huge wood deck, mature trees, just an absolute beautiful property for a great price. 12x12 Barn in backyard!! Hurry this is the one. Across from Park !!
-
2007-03-23historical 344-char remark
Show marketing remark (344 chars)
Home Priced to sell !! Larger than it Looks !! Very nicely updated home w/ neutral colors and Pergo floors. Very Large room sizes w/ full finished basement. Unique entry way with cute foyer. Huge wood deck, mature trees, just an absolute beautiful property for a great price. 12x12 Barn in backyard!! Hurry this is the one. Across from Park !!
-
2007-03-13$219,900 344-char remark
Show marketing remark (344 chars)
Home Priced to sell !! Larger than it Looks !! Very nicely updated home w/ neutral colors and Pergo floors. Very Large room sizes w/ full finished basement. Unique entry way with cute foyer. Huge wood deck, mature trees, just an absolute beautiful property for a great price. 12x12 Barn in backyard!! Hurry this is the one. Across from Park !!
-
1990-03-30soldstatus $85,000
ⓘ Source: listings_history table (triggers on properties + properties_extension) + one-shot
backfill from property_details.listing_events for pre-trigger history.
Tax reassessment forecast IL · Partial reset (capped growth)
- Current annual tax
- $6,432 · $536/mo
- Projected year-2 tax
- $7,177 · $598/mo
- Expected delta
- +$745/yr (+$62/mo · 11.6%)
ⓘ Screening estimate from a state-policy table — verify with the county assessor before closing.
Climate risk First Street
- Flood 1/10 Low FEMA zone X (unshaded) · 0% chance over 30 yrs
- Wildfire 1/10 Low
- Heat 3/10 Moderate 7 d/yr ≥103°F today · 15 d/yr by 30 yrs out
- Wind 2/10 Low
- Air quality 4/10 Moderate 4 unhealthy d/yr today · 5 by 30 yrs out
Nearby sold comps map
Loading sold comps map…
Walkable amenities ~0.75 mi
Loading nearby amenities…
Taxation est. · year 1
- Rental income
- $39,701
- − Mortgage interest
- −$19,549
- − Property taxes
- −$6,432
- − Insurance
- −$1,745
- − Repairs & maintenance
- −$3,176
- − Management
- −$3,176
- − Depreciation
- −$10,153
- Taxable loss
- −$4,530
- Est. tax savings @ 24.0%
- +$1,087
- After-tax cash flow
- $2,312/yr
For passive investors: Depreciation is non-cash, so a rental often shows a tax loss while cash-flowing — sheltering income. Rental losses are passive: they offset passive income freely, and up to $25,000/yr can offset ordinary (W-2) income if you actively participate and your MAGI is under $100k (phasing out to $0 by $150k); unused losses carry forward. On sale, claimed depreciation is recaptured at up to 25%, and gains may owe capital-gains tax (a 1031 exchange can defer both). Figures are a year-1 estimate at your 24.0% rate — not tax advice; consult a CPA.
Schools (NCES district)
- District
- Lincoln Way Chsd 210
- NCES district ID
- 1723070
- Math proficiency
- 44% ▼ -13.00%
- Reading proficiency
- 49% ▼ -9.00%
- Median HH income
- $86,879
- Composite
- 43.4/100
- National rank
- #3019
- State rank
- #60 of 620 in IL
Livability — Tinley Park
- Score
- 74/100
- State rank
- #246
- US rank
- #4453
Category grades
Schools grade is shown separately in the Schools card above.
Census & demographics
- Census place
- Tinley Park, IL
- City population
- 35,976
- Population (ZIP)
- 25,881
Population outlook (Will County) Hauer SSP2
- Today (2025)
- 705,368 people
- By 2030
- 708,154 · +0.4%
- By 2040
- 702,692 · -0.4%
- By 2050
- 680,249 · -3.6%
- By 2075
- 611,990 · -13.2%
- By 2100
- 516,215 · -26.8%
Race, ethnicity, and origin ACS 2023
- Neighborhood character
- Predominantly White (79%)
- Race & ethnicity
- White 79% Hispanic / Latino 9% Black 7% Two or more races 5% Asian 4%
- Hispanic origin (detail)
- Mexican 7% Puerto Rican 1%
- Common ancestry
- Romanian 15% Iranian 2% Armenian 1%
- Foreign-born
- 10% · Canada
- Languages at home
- 82% English-only · Arabic 7% Spanish 3% Other Indo-European 3%
Political lean MEDSL · Will
- 2024 margin
- Toss-up / Even · D 50.1% · R 48.5% · Other 1.4%
- 2008→2024 swing
- -11.6pp toward R · 2008: 13.2pp · 2024: 1.6pp
- All cycles
- 2024: D+1.6 2020: D+8.3 2016: D+5.7 2012: D+3.7 2008: D+13.2
Not yet ingested
- Civics
- —
Market trends
- HPI YoY
- ▼ -129.80%
- Current HPI
- 181.7726
- Rent YoY
- —
- Metro
- —
- State GDP YoY
- ▲ 1.59%
- F500 in state
- 60
Industry mix (Fortune 500 HQ in IL)
| Industry | F500 HQs | Revenue |
|---|---|---|
| Insurance | 4 | $201B |
|
||
| Consumer Goods | 4 | $87B |
|
||
| Industrial Machinery | 3 | $64B |
|
||
| Healthcare | 2 | $55B |
|
||
| Retail / Pharmacy | 1 | $148B |
|
||
| Agriculture / Food | 1 | $86B |
|
||
Price history
+310.6% since first listed6 events — show timeline
- 2026-02-24 Listed $349,000 MRED as Distributed by MLS Grid
- 2007-06-04 Sold (Public Records) $205,000 Public Records
- 2007-05-24 Sold (MLS) $205,000 MRED as Distributed by MLS Grid
- 2007-03-23 Listing Removed — MRED as Distributed by MLS Grid
- 2007-03-13 Listed $219,900 MRED as Distributed by MLS Grid
- 1990-03-30 Sold (Public Records) $85,000 Public Records
Property tax history
+3.3%/yrLatest (2024): $6,432 · -4.1% YoY. Source: county tax records.
Cash-flow waterfall
monthlySold comps — $/sqft
last 12 mo · ≤1 miLoading sold comps…