314 Woley Dr · San Antonio, TX
Flood risk 3/10 · Minor
- FEMA flood zone
- X (unshaded)
- Chance of flooding over 30 yrs
- 0.2%
- Est. flood insurance / yr
- $507 – $1,088
Fire risk 1/10 · Minimal
- Est. fire insurance / yr
- $1,222 – $2,270
Heat risk 8/10 · Major
- Hot days now (above 108°F)
- 7 days/yr
- Hot days in 30 yrs
- 22 days/yr
Wind risk 6/10 · Moderate
- Chance of severe wind over 30 yrs
- 77.0%
Air-quality risk 2/10 · Minimal
- Unhealthy air days now
- 1 days/yr
- Unhealthy air days in 30 yrs
- 1 days/yr
Risk factors via First Street. Map © Google.
Why this score? — see what drove the D+ grade
The composite is a weighted blend of 9 inputs, each scored 0–100. Each bar is that input's sub-score; the figure is the points it added to the 100-point composite (weight × sub-score).
- Cash flow +13.6/30.0
- ARV discount +13.4/15.0
- 1% rule +4.6/10.0
- DSCR +4.1/10.0
- Livability +4.0/5.0
- Rent growth +3.7/5.0
- Condition / age +2.5/5.0
- Schools +1.3/10.0
- Appreciation +0.0/10.0
$180,000
🖨 Deal sheet 📄 Offer letter ✓ Due diligence
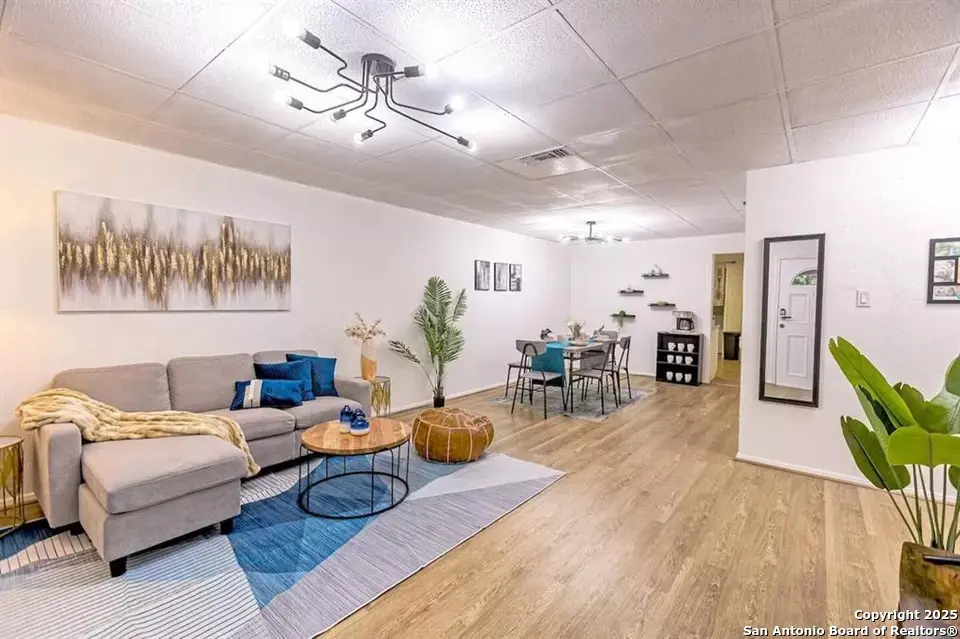
Listing remarks
Furniture and interior decor are negotiable with the sale. It is Full Furnished, very clean, you can move in to live needing to carry a package only. Including Laundry Room with Washer and Dryer. Spacious Backyard providing Ample Outdoor Seating area. This is a beautiful home with 4 bedrooms, 7 beds and can accommodate 12 people. closer to Walmart and Heb, etc. St Mary University is less than 1 mile away. Transportation is very convenient
Key facts
- Spacious backyard
- Laundry room
- 7,187 sq ft lot
Tags
Property features AI
Finance
- HOA & community: Located in Loma Park Heights subdivision
Exterior
- Parking: Detached garage with space for four or more cars
- Utilities: Public water system
- Home design: Pre-owned property; Approximately 73 years old
- Construction: Slab foundation; Composition roof
- Exterior features: Wood siding exterior
Interior
- Kitchen: Cook top; Microwave; Stove/Range; Refrigerator; Dishwasher
- Bedrooms: Master bedroom on lower level (approx. 14 x 12); Bedroom 2 (approx. 10 x 10); Bedroom 3 (approx. 10 x 10); Bedroom 4 (approx. 10 x 10)
- Flooring: Ceramic tile floors
- Bathrooms: Two full bathrooms; Master bath with tub/shower combination (approx. 10 x 10)
- Heating & cooling: Central heating (electric); Central air conditioning
- Interior features: Ceiling fans throughout; Open floor plan with living/dining room combination; Two living areas; All window coverings remain; City garbage service
- Laundry & utility: Washer and dryer included; Washer and dryer connections; Electric water heater
Neighborhood map
What this means for you Summary
Snapshot
- This is a 3-bed/1.0-bath single-family listed at $180k.
Deal economics
- At list price, monthly cash flow is $9 ($105/yr) — positive.
- The deal already cash-flows at list — no discount required.
- To meet the 1% rule (rent ≥ 1% of price), the offer needs to be $172k (4.4% below list).
- Recommended offer: $172k (4.4% below list) — sets the bar for 1% rule.
- Cap rate 6.4% vs local median 3.8% in San Antonio — top-decile yield for the area; either an underpriced asset or a hidden risk that comps aren't pricing in. Stress-test before assuming the spread holds.
Location & tenants
- Location reads 80/100 on livability (#31 in TX, #1,616 nationally) — a professional / high-income tenant draw. Strengths: amenities A+, commute A+, cost of living A+; Watch: crime F.
- Edgewood ISD (urban): math 12% / reading 21% proficiency, ranked #812 of 826 in TX (top 98%) — low school quality limits family demand, transient renter base, plan for 1-2y turnover.
- Zoned schools: Loma Park El (math 11% / reading 22%, grade F, #3,946 of 4,322 statewide, top 92%, 586 students, 98% FRL); Memorial H S (math 22% / reading 29%, grade F, #1,246 of 1,632 statewide, top 77%, 872 students, 92% FRL) — zoned schools average 95% FRL vs 24% district-wide (70 pts higher); higher-poverty schools than district average — tighter screening recommended.
- Market conditions: Rents rising fast (+4.9%/yr); 91 active listings in the ZIP; 9 comparable units currently listed for rent nearby; rentals at typical pace (median 24d on market — plan ~3-4 weeks tenant-placement turnaround); 44% of comp listings sitting > 30 days — soft ceiling on asking rent; 8,308 units permitted in Bexar County in 2024 (2,506 in 5+ unit buildings).
- This rent runs 39% of the median local income ($53k/yr) — at the standard rent-burdened threshold; future hikes will face affordability resistance.
Forward outlook
- Local home prices are declining (-3.0%/yr); year-one equity from $1k of loan paydown is wiped out by about $5k of value loss. Plan a longer hold.
- Bexar County population projected at +50% by 2050 — long-run rental-demand tailwind backs the buy-and-hold thesis.
Negotiation context
- It's been on market 48 days — a 3% lower offer ($175k) is reasonable based on typical stale-listing flexibility.
- 9 sale attempts since 3y ago with the ask held roughly flat each time — persistent listings suggest the price (not the market) is what's stuck; bring a comps-based counter.
Risks & watch-outs
- Watch-outs: built in 1953 — expect roof / HVAC / electrical / plumbing capex.
- Climate carrying-cost: major wind risk, 77% chance of damaging wind over 30y; extreme-heat days projected 7→22/yr by 2055 (HVAC capex compounding) — expect insurance premiums to compound above CPI over the hold.
Questions for the listing agent
- It's been on market 48 days. Have you received any prior offers? Is the seller open to a 4% concession, seller financing, or rate buy-down credit?
- Built in 1953 — when were the roof, HVAC, electrical panel, plumbing, and water heater last replaced?
- Is there a deadline driving the sale (1031 exchange, divorce, estate, relocation)? That informs how much negotiation room exists.
- Crime grade is F in this area — have there been break-ins, vandalism, or insurance claims at this property in the last 3 years? What carrier currently insures it and at what premium?
- The area grade is low — what's the realistic commute time and amenity access for the typical tenant pool here? Any planned neighborhood developments (good or bad) we should know about?
- What's the average days-on-market for RENTAL listings here right now (not sales)? A rising rental-DOM trend means longer vacancies and softer asking-rent achievability than the comps imply.
- What's the recent tenant-quality profile in this submarket — average credit score on applications, eviction rate, late-payment / NSF rate, and stable-employment percentage? A property-management company in the area should have these aggregated.
- How much new for-sale + rental construction is in the pipeline within 1–3 miles? Heavy new supply typically softens prices + rents 12–24 months out; constrained supply supports both.
Investment metrics
- 1% rule
- 0.96% ✗
- Cap rate
- 6.35%
- Cash-on-cash
- 0.21%
- DSCR
- 1.01
- GRM
- 8.7
CMA / ARV
- ARV (on-the-fly)
- $207,264
- Comps found
- 10
Show comp detail 10 sales within ~0.75 mi
| Address | Dist | Beds/Ba | Sqft | Sold | Price | $/sf | Match |
|---|---|---|---|---|---|---|---|
| 242 Brandywine Ave | 0.19mi | 3/2.0 | 1,482 (-3%) | 14mo | $195,000 | $132 | 71 |
| 207 Continental | 0.33mi | 3/2.0 | 1,564 (+3%) | 17mo | $316,000 | $202 | 62 |
| 163 Continental | 0.34mi | 2/2.0 (-1) | 1,475 (-3%) | 15mo | $99,999 | $68 | 58 |
| 327 Globe | 0.49mi | 3/1.5 | 1,562 (+2%) | 22mo | $135,000 | $86 | 53 |
| 274 Brandywine | 0.23mi | 4/1.0 (+1) | 1,304 (-14%) | 13mo | $204,990 | $157 | 50 |
| 138 Riverdale Dr | 0.51mi | 3/1.0 | 1,716 (+13%) | 13mo | $205,000 | $119 | 44 |
| 4751 Lark | 0.52mi | 3/2.0 | 1,296 (-15%) | 4mo | $159,900 | $123 | 44 |
| 602 Overhill Dr | 0.61mi | 4/1.0 (+1) | 1,688 (+11%) | 16mo | $230,001 | $136 | 35 |
| 4618 Lark | 0.36mi | 4/2.0 (+1) | 1,720 (+13%) | 22mo | $269,000 | $156 | 35 |
| 331 Riverdale Dr | 0.61mi | 3/2.0 | 1,298 (-15%) | 16mo | $254,990 | $196 | 29 |
Match score weights: distance 35% · size 25% · config 20% · recency 20%. Top-matched comps best support the ARV.
Projected returns pro-forma
-3.0% appreciation · 4.92% rent growth · sell at horizon
- IRR
- -13.6%
- Equity multiple
- 0.50×
- Total profit
- $-25,128
- Equity at exit
- $26,839
- IRR
- -1.7%
- Equity multiple
- 0.87×
- Total profit
- $-6,329
- Equity at exit
- $15,563
Cash invested: $50,400 (down + closing). Projections, not guarantees.
Landlord ↔ Tenant lean methodology
- Overall (STATE)
- 87 Strongly Landlord-Friendly
- State Texas
- 87 Strongly Landlord-Friendly · R+5
- County
- — inherits STATE
- City
- — inherits STATE
ZIP-level market 78228
- Home prices YoY
- -22.1%
- Rents YoY
- 4.9%
- Active inventory
- 91
- Price-to-rent
- 8.7×
Monthly cashflow live
- Estimated rent
- $1,721 high interval (Pro) →
- Mortgage (P&I)
- −$944
- Tax from tax record
- −$332 /mo · $3,982/yr
- Insurance
- −$75
- HOA
- −$0
- Vacancy / Maint / Mgmt
- −$361
- Net cashflow
- $9
Break-even live
UW: 25.0% down · 7.5% · 30yr · 1.5% tax · 5.0% vac · 8.0% maint · 8.0% mgmt
Financing live
Cash to close
- Down payment
- $45,000
- Closing costs
- $5,400
- Reserves months
- —
- Total cash needed
- —
Loan-product check · same deal, 3 products live
Conventional
25% down · 7.5% · 30yr
- Down + closing
- —
- Monthly P&I
- —
- Monthly cashflow
- —
- DSCR
- —
- Eligible?
- —
Personal DTI + credit; lowest rate.
DSCR
20% down · 8.5% · 30yr
- Down + closing
- —
- Monthly P&I
- —
- Monthly cashflow
- —
- DSCR
- —
- Eligible?
- —
No personal income docs; deal must DSCR.
Hard money
10% down · 12.0% · 12mo
- Down + closing
- —
- Monthly P&I
- —
- Monthly cashflow
- —
- DSCR
- —
- Eligible?
- —
Short-term bridge; refi at stabilization.
Rent comps 9 comps
| Address | Beds | Baths | Sqft | Rent | $/sqft | DOM | Units | Dist |
|---|---|---|---|---|---|---|---|---|
| 4535 Lark San Antonio, TX | 4.0 | 2.0 | 1514 | $1,750 | $1.16 | 23d | 1 | 0.28mi |
| 4767 Lark San Antonio, TX | 3.0 | 1.0 | 1248 | $1,475 | $1.18 | 10d | 1 | 0.56mi |
| 1046 Hillcrest Dr San Antonio, TX | 4.0 | 2.0 | 1546 | $1,650 | $1.07 | 43d | 1 | 0.76mi |
| 351 Overhill Dr Unit MH San Antonio, TX | 3.0 | 1.0 | 1647 | $1,550 | $0.94 | 23d | 1 | 0.87mi |
| 330 W Cheryl Dr San Antonio, TX | 1.0–3.0 | 1.0–2.0 | 975 | $1,300 | $1.33 | 43d | 1 | 0.99mi |
| 707 Tulane Dr San Antonio, TX | 2.0 | 1.5 | 1500 | $1,550 | $1.03 | 43d | 1 | 1.09mi |
| 2313 Texas Ave San Antonio, TX | 3.0 | 1.0 | 1309 | $1,400 | $1.07 | 44d | 1 | 1.27mi |
| 1735 Donaldson Ave San Antonio, TX | 3.0 | 2.0 | 1610 | $1,650 | $1.02 | 17d | 1 | 1.49mi |
| 1735 Donaldson Ave San Antonio, TX | 3.0 | 2.0 | 1610 | $1,650 | $1.02 | 23d | 1 | 1.49mi |
Listing history 17 events
-
2026-06-18days on market $180,000 Active 48 DOM
-
2026-06-17days on market $180,000 Active 47 DOM
-
2026-06-16days on market $180,000 Active 46 DOM
-
2026-06-15days on market $180,000 Active 45 DOM
-
2026-06-14status $180,000 Active 43 DOM
-
2026-06-13days on market $180,000 Price Change 43 DOM
-
2026-06-12days on market $180,000 Price Change 42 DOM
-
2026-06-09days on market $180,000 Price Change 39 DOM
-
2026-06-08days on market $180,000 Price Change 38 DOM
-
2026-06-08days on market $180,000 Price Change 37 DOM
-
2026-06-07days on market $180,000 Price Change 36 DOM
-
2026-06-04pricestatus $180,000 Price Change 33 DOM
-
2026-06-03days on market $188,000 Active 33 DOM
-
2026-06-02days on market $188,000 Active 32 DOM
-
2026-06-01days on market $188,000 Active 31 DOM
-
2026-05-31remarks 442-char remark
-
2026-05-31$188,000 Active 30 DOM
ⓘ Source: listings_history table (triggers on properties + properties_extension) + one-shot
backfill from property_details.listing_events for pre-trigger history.
Tax reassessment forecast TX · Resets to sale price
- Current annual tax
- $3,982 · $332/mo
- Projected year-2 tax
- $3,982 · $332/mo
- Expected delta
- $0/yr ($0/mo · -0.0%)
ⓘ Screening estimate from a state-policy table — verify with the county assessor before closing.
Climate risk First Street
- Flood 3/10 Moderate FEMA zone X (unshaded) · 20% chance over 30 yrs
- Wildfire 1/10 Low
- Heat 8/10 Severe 7 d/yr ≥108°F today · 22 d/yr by 30 yrs out
- Wind 6/10 Major 77% chance of damaging wind over 30 yrs
- Air quality 2/10 Low 1 unhealthy d/yr today · 1 by 30 yrs out
Nearby sold comps map
Loading sold comps map…
Walkable amenities ~0.75 mi
Loading nearby amenities…
Taxation est. · year 1
- Rental income
- $20,651
- − Mortgage interest
- −$10,083
- − Property taxes
- −$3,982
- − Insurance
- −$900
- − Repairs & maintenance
- −$1,652
- − Management
- −$1,652
- − Depreciation
- −$5,236
- Taxable loss
- −$2,854
- Est. tax savings @ 24.0%
- +$685
- After-tax cash flow
- $790/yr
For passive investors: Depreciation is non-cash, so a rental often shows a tax loss while cash-flowing — sheltering income. Rental losses are passive: they offset passive income freely, and up to $25,000/yr can offset ordinary (W-2) income if you actively participate and your MAGI is under $100k (phasing out to $0 by $150k); unused losses carry forward. On sale, claimed depreciation is recaptured at up to 25%, and gains may owe capital-gains tax (a 1031 exchange can defer both). Figures are a year-1 estimate at your 24.0% rate — not tax advice; consult a CPA.
Schools (NCES district)
- District
- Edgewood ISD
- NCES district ID
- 4818150
- Math proficiency
- 12% ▼ -18.00%
- Reading proficiency
- 21% ▼ -5.00%
- Median HH income
- $27,419
- Composite
- 12.82/100
- National rank
- #9597
- State rank
- #812 of 826 in TX
Livability — San Antonio
- Score
- 80/100
- State rank
- #31
- US rank
- #1616
Category grades
Schools grade is shown separately in the Schools card above.
Census & demographics
- Census place
- San Antonio, TX
- County
- Bexar County · 1,990,555 people
- City population
- 1,806,925
- Metro
- San Antonio-New Braunfels, TX
- Population (ZIP)
- 56,165
- Household income
- $52,976
- Rent vs Own
- Severe rent burden
- 2709.0
Population outlook (Bexar County) Hauer SSP2
- Today (2025)
- 2,336,851 people
- By 2030
- 2,560,728 · +9.6%
- By 2040
- 3,020,569 · +29.3%
- By 2050
- 3,493,522 · +49.5%
- By 2075
- 4,668,459 · +99.8%
- By 2100
- 5,533,242 · +136.8%
Race, ethnicity, and origin ACS 2023
- Neighborhood character
- Predominantly Hispanic (88%)
- Race & ethnicity
- Hispanic / Latino 88% Two or more races 43% White 8% Black 2%
- Hispanic origin (detail)
- Mexican 80%
- Common ancestry
- Italian 1% Lithuanian 1%
- Foreign-born
- 15% · Canada
- Languages at home
- 46% English-only · Spanish 53% Other Indo-European 1%
Political lean MEDSL · Bexar
- 2024 margin
- Lean D (+9.8) · D 54.3% · R 44.6% · Other 1.1%
- 2008→2024 swing
- +4.2pp toward D · 2008: 5.6pp · 2024: 9.8pp
- All cycles
- 2024: D+9.8 2020: D+18.2 2016: D+13.5 2012: D+4.6 2008: D+5.6
Not yet ingested
- Civics
- —
Market trends
- HPI YoY
- ▼ -74.04%
- Current HPI
- 261.1558
- Rent YoY
- ▲ 4.92%
- Metro
- San Antonio-New Braunfels, TX
- State GDP YoY
- ▲ 3.95%
- F500 in state
- 110
Industry mix (Fortune 500 HQ in TX)
| Industry | F500 HQs | Revenue |
|---|---|---|
| Energy | 16 | $1,198B |
|
||
| Technology | 5 | $198B |
|
||
| Engineering / Construction | 4 | $72B |
|
||
| Energy Services | 3 | $60B |
|
||
| Utilities | 3 | $41B |
|
||
| Healthcare | 2 | $330B |
|
||
Price history
-4.1% since first listed33 events — show timeline
- 2026-05-02 Price Changed $187,000 LERA
- 2026-05-02 Relisted — LERA
- 2026-05-01 Listing Removed — LERA
- 2026-05-01 Listed $188,000 LERA
- 2026-04-03 Listing Removed — LERA
- 2026-04-01 Relisted — LERA
- 2026-03-22 Contingent — LERA
- 2025-11-05 Price Changed $189,000 LERA
- 2025-08-22 Price Changed $194,000 LERA
- 2025-07-23 Price Changed $196,000 LERA
- 2025-07-10 Price Changed $209,000 LERA
- 2025-07-05 Price Changed $196,000 LERA
- 2025-07-02 Listing Removed — LERA
- 2025-07-01 Listed $180,000 LERA
- 2025-05-20 Rental Removed $1,600 SABOR
- 2025-04-20 Price Changed $1,600 SABOR
- 2025-04-19 Price Changed $1,750 SABOR
- 2025-04-16 Price Changed $1,600 SABOR
- 2025-04-14 Price Changed $1,750 SABOR
- 2025-04-12 Price Changed $1,900 SABOR
- 2025-04-11 Price Changed $2,100 SABOR
- 2025-04-10 Listed for Rent $2,300 SABOR
- 2025-04-10 Listed $180,000 LERA
- 2025-04-09 Listing Removed — HARMLS
- 2025-04-09 Listed $180,000 HARMLS
- 2024-11-01 Rental Removed $2,300 SABOR
- 2024-03-09 Listed for Rent $2,400 SABOR
- 2023-06-20 Sold (Public Records) — Public Records
- 2023-06-16 Sold (MLS) — LERA
- 2023-06-05 Pending — LERA
- 2023-05-30 Contingent — LERA
- 2023-05-23 Price Changed $180,000 LERA
- 2023-05-03 Listed $195,000 LERA
Property tax history
+6.0%/yrLatest (2025): $3,982 · -2.0% YoY. Source: county tax records.
Cash-flow waterfall
monthlySold comps — $/sqft
last 12 mo · ≤1 miLoading sold comps…