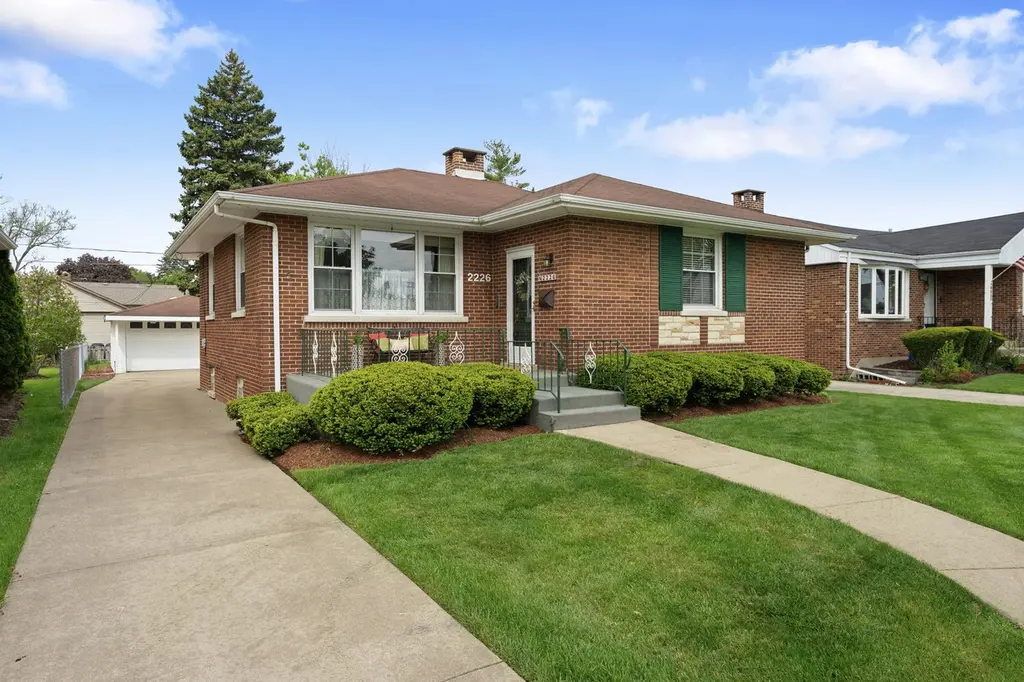
2226 Hawthorne Ave · Westchester, IL
Flood risk 1/10 · Minimal
- FEMA flood zone
- X (unshaded)
- Chance of flooding over 30 yrs
- 0.0%
- Est. flood insurance / yr
- $473 – $860
Fire risk 1/10 · Minimal
- Est. fire insurance / yr
- $804 – $1,492
Heat risk 3/10 · Minor
- Hot days now (above 101°F)
- 7 days/yr
- Hot days in 30 yrs
- 14 days/yr
Wind risk 2/10 · Minimal
- Chance of severe wind over 30 yrs
- 0.0%
Air-quality risk 4/10 · Minor
- Unhealthy air days now
- 4 days/yr
- Unhealthy air days in 30 yrs
- 6 days/yr
Risk factors via First Street. Map © Google.
Why this score? — see what drove the C- grade
The composite is a weighted blend of 9 inputs, each scored 0–100. Each bar is that input's sub-score; the figure is the points it added to the 100-point composite (weight × sub-score).
- Cash flow +16.5/30.0
- ARV discount +15.0/15.0
- DSCR +5.1/10.0
- Livability +4.2/5.0
- 1% rule +3.9/10.0
- Rent growth +2.5/5.0
- Condition / age +2.5/5.0
- Schools +1.4/10.0
- Appreciation +0.0/10.0
$299,000
🖨 Deal sheet (PDF) 📄 Offer letter ✓ Due diligence
Listing remarks
Charming 2-bedroom, 1-bath Baltis brick ranch offering timeless appeal and modern updates! This inviting home welcomes you with a spacious front porch-perfect for relaxing-and an expansive concrete patio that creates ideal outdoor living and entertaining space. Inside, you'll find an abundance of natural light throughout, highlighting the home's warm and inviting atmosphere. Hardwood floors lie beneath the carpet, offering exciting potential for added value and style. Recent updates provide peace of mind, including a new furnace and AC (2022), new oven (2022), hot water heater (2023), and a brand-new refrigerator (2026). Replacement windows add efficiency and comfort. This well-maintained h
Key facts
- New furnace
- Front porch
- Concrete patio
Tags
Property features AI
Finance
- Other: Parcel number 15292040440000; Senior tax exemption indicated
- HOA & community: No master association fee required
Exterior
- Parking: Detached garage (2 garage spaces, 2 total parking spaces)
- Utilities: Public water; Public sewer
- Home design: Detached single-family home; One-story layout; Fee simple ownership; Built before 1978 (property age approx. 71–80 years)
- Construction: Brick construction
- Exterior features: Lot dimensions approximately 50 x 126; Less than 1/4 acre lot; Commuter bus and interstate access nearby; Directions: Mannheim West to Hawthorne Ave, then south to home
Interior
- Kitchen: Kitchen with eating area / table space (12 x 10) with laminate flooring
- Bedrooms: Master bedroom on main level (14 x 14) with carpet; Second bedroom on main level (12 x 10) with carpet; Additional bedrooms listed (counts to 2 total)
- Flooring: Carpet in living areas and bedrooms; Laminate in kitchen
- Bathrooms: 1 full bathroom
- Heating & cooling: Natural gas heating; Central air conditioning
- Interior features: Finished full basement; Total of 6 rooms
- Laundry & utility: Laundry room in basement (38 x 19)
Neighborhood map
What this means for you Summary
Snapshot
- This is a 3-bed/1.0-bath single-family listed at $299k.
Deal economics
- At list price, monthly cash flow is $174 ($2k/yr) — positive.
- The deal already cash-flows at list — no discount required.
- To meet the 1% rule (rent ≥ 1% of price), the offer needs to be $266k (11.0% below list).
- Recommended offer: $266k (11.0% below list) — sets the bar for 1% rule.
- Cap rate 7.0% vs local median 4.4% in Westchester — top-decile yield for the area; either an underpriced asset or a hidden risk that comps aren't pricing in. Stress-test before assuming the spread holds.
Location & tenants
- Location reads 83/100 on livability (#57 in IL, #1,029 nationally) — a professional / high-income tenant draw. Strengths: crime A+, commute A+, employment A+; Watch: health & safety D+, amenities F.
- Proviso Twp Hsd 209 (suburban): math 12% / reading 17% proficiency, ranked #507 of 620 in IL (top 82%) — low school quality limits family demand, transient renter base, plan for 1-2y turnover.
- Zoned schools: Westchester Primary School (380 students, 0% FRL); Westchester Middle School (math 22% / reading 34%, grade F, #284 of 665 statewide, top 44%, 323 students, 0% FRL); Proviso West High School (math 6% / reading 11%, grade F, #584 of 693 statewide, top 85%, 1,868 students, 0% FRL).
- Market conditions: 44 active listings in the ZIP; 8 comparable units currently listed for rent nearby; rentals at typical pace (median 27d on market — plan ~3-4 weeks tenant-placement turnaround); 6,272 units permitted in Cook County in 2024 (4,658 in 5+ unit buildings).
Forward outlook
- Local home prices are declining (-3.0%/yr); year-one equity from $2k of loan paydown is wiped out by about $9k of value loss. Plan a longer hold.
Negotiation context
- Only 7 days on market — expect competitive offers; lowballing is unlikely to land.
- Current owner paid $145k; list at $299k implies a 106% gain — meaningful room to come down on a strong offer.
Risks & watch-outs
- Watch-outs: built in 1954 — expect roof / HVAC / electrical / plumbing capex.
Questions for the listing agent
- Built in 1954 — when were the roof, HVAC, electrical panel, plumbing, and water heater last replaced?
- Is there a deadline driving the sale (1031 exchange, divorce, estate, relocation)? That informs how much negotiation room exists.
- What's the average days-on-market for RENTAL listings here right now (not sales)? A rising rental-DOM trend means longer vacancies and softer asking-rent achievability than the comps imply.
- What's the recent tenant-quality profile in this submarket — average credit score on applications, eviction rate, late-payment / NSF rate, and stable-employment percentage? A property-management company in the area should have these aggregated.
- How much new for-sale + rental construction is in the pipeline within 1–3 miles? Heavy new supply typically softens prices + rents 12–24 months out; constrained supply supports both.
Investment metrics
- 1% rule
- 0.89% ✗
- Cap rate
- 6.99%
- Cash-on-cash
- 2.50%
- DSCR
- 1.11
- GRM
- 9.4
CMA / ARV
- ARV (on-the-fly)
- $360,320
- Comps found
- 12
Show comp detail 12 sales within ~0.75 mi
| Address | Dist | Beds/Ba | Sqft | Sold | Price | $/sf | Match |
|---|---|---|---|---|---|---|---|
| 1926 Buckingham Ave | 0.28mi | 3/2.0 | 1,168 (+4%) | 2mo | $355,000 | $304 | 75 |
| 2315 Downing Ave | 0.25mi | 2/1.0 (-1) | 1,248 (+11%) | 0mo | $340,000 | $272 | 65 |
| 1908 Sunnyside Ave | 0.27mi | 2/2.0 (-1) | 1,200 (+7%) | 3mo | $413,200 | $344 | 65 |
| 1821 Buckingham Ave | 0.39mi | 3/2.0 | 1,223 (+9%) | 2mo | $391,000 | $320 | 62 |
| 10511 Preston St | 0.36mi | 3/2.0 | 1,262 (+12%) | 6mo | $400,000 | $317 | 54 |
| 10913 Martindale Dr | 0.65mi | 3/2.0 | 1,195 (+6%) | 2mo | $550,000 | $460 | 53 |
| 11053 Mandel Ave | 0.74mi | 3/2.0 | 1,173 (+4%) | 2mo | $360,000 | $307 | 52 |
| 1932 Newcastle Ave | 0.56mi | 2/2.0 (-1) | 1,196 (+6%) | 2mo | $355,000 | $297 | 52 |
| 11104 Boeger Ct | 0.72mi | 3/2.0 | 1,086 (-4%) | 5mo | $395,000 | $364 | 52 |
| 2345 Boeger Ave | 0.56mi | 3/2.0 | 1,246 (+11%) | 2mo | $409,000 | $328 | 51 |
| 10909 Martindale Dr | 0.64mi | 3/2.0 | 1,270 (+13%) | 2mo | $420,000 | $331 | 43 |
| 11138 Shaw St | 0.73mi | 2/1.0 (-1) | 988 (-12%) | 2mo | $225,000 | $228 | 39 |
Match score weights: distance 35% · size 25% · config 20% · recency 20%. Top-matched comps best support the ARV.
Projected returns pro-forma
-3.0% appreciation · 3.0% rent growth · sell at horizon
- IRR
- -12.4%
- Equity multiple
- 0.55×
- Total profit
- $-37,405
- Equity at exit
- $44,582
- IRR
- -3.3%
- Equity multiple
- 0.78×
- Total profit
- $-18,473
- Equity at exit
- $25,852
Cash invested: $83,720 (down + closing). Projections, not guarantees.
Landlord ↔ Tenant lean methodology
- Overall (STATE)
- 43 Moderately Tenant-Leaning
- State Illinois
- 43 Moderately Tenant-Leaning · D+7
- County
- — inherits STATE
- City
- — inherits STATE
ZIP-level market 60154
- Active inventory
- 44
- Price-to-rent
- 9.4×
Monthly cashflow live
- Estimated rent
- $2,662 high interval (Pro) →
- Mortgage (P&I)
- −$1,568
- Tax from tax record
- −$236 /mo · $2,832/yr
- Insurance
- −$125
- HOA
- −$0
- Vacancy / Maint / Mgmt
- −$559
- Net cashflow
- $174
Break-even live
Sensitivity live
| Price | -10% $343 | -5% $259 | +0% $174 | +5% $89 | +10% $5 |
|---|---|---|---|---|---|
| Rent | -10% $-36 | -5% $69 | +0% $174 | +5% $279 | +10% $384 |
| Rate | -1.0pp $325 | -0.5pp $250 | base $174 | +0.5pp $97 | +1.0pp $18 |
UW: 25.0% down · 7.5% · 30yr · 1.5% tax · 5.0% vac · 8.0% maint · 8.0% mgmt
Financing live
Cash to close
- Down payment
- $74,750
- Closing costs
- $8,970
- Reserves months
- —
- Total cash needed
- —
Loan-product check · same deal, 3 products live
Conventional
25% down · 7.5% · 30yr
- Down + closing
- —
- Monthly P&I
- —
- Monthly cashflow
- —
- DSCR
- —
- Eligible?
- —
Personal DTI + credit; lowest rate.
DSCR
20% down · 8.5% · 30yr
- Down + closing
- —
- Monthly P&I
- —
- Monthly cashflow
- —
- DSCR
- —
- Eligible?
- —
No personal income docs; deal must DSCR.
Hard money
10% down · 12.0% · 12mo
- Down + closing
- —
- Monthly P&I
- —
- Monthly cashflow
- —
- DSCR
- —
- Eligible?
- —
Short-term bridge; refi at stabilization.
Rent comps 8 comps
| Address | Beds | Baths | Sqft | Rent | $/sqft | DOM | Units | Dist |
|---|---|---|---|---|---|---|---|---|
| 10813 Berkshire St Westchester, IL | 3.0 | 2.0 | 1244 | $3,600 | $2.89 | 0d | 1 | 0.46mi |
| 10351 Canterbury St Unit 2E Westchester, IL | 2.0 | 1.0 | 850 | $1,650 | $1.94 | 26d | 1 | 0.55mi |
| 13 Scotdale Rd Unit 4 La Grange Park, IL | 3.0 | 1.5 | 1000 | $2,300 | $2.30 | 26d | 1 | 0.57mi |
| 1215 Balmoral Ave Unit 2 Westchester, IL | 3.0 | 1.5 | 1500 | $2,950 | $1.97 | 17d | 1 | 1.06mi |
| 1215 Balmoral Ave Unit 1 Westchester, IL | 3.0 | 1.5 | 1500 | $2,750 | $1.83 | 26d | 1 | 1.06mi |
| 1415 Homestead Rd #8 La Grange Park, IL | 2.0 | 1.0 | 875 | $1,950 | $2.23 | 7d | 1 | 1.09mi |
| 1436 Beach Ave La Grange Park, IL | 2.0 | 1.0 | 800 | $2,250 | $2.81 | 26d | 1 | 1.16mi |
| 1518 Cleveland Ave La Grange Park, IL | 3.0 | 1.5 | 1331 | $3,600 | $2.70 | 8d | 1 | 1.35mi |
Listing history 4 events
-
2026-05-21status Pending
-
2026-05-14$299,000 Active
-
1995-02-23soldstatus $145,000
-
1989-04-01soldstatus $115,000
ⓘ Source: listings_history table (triggers on properties + properties_extension) + one-shot
backfill from property_details.listing_events for pre-trigger history.
Tax reassessment forecast IL · Partial reset (capped growth)
- Current annual tax
- $2,832 · $236/mo
- Projected year-2 tax
- $4,810 · $401/mo
- Expected delta
- +$1,978/yr (+$165/mo · 69.8%)
ⓘ Screening estimate from a state-policy table — verify with the county assessor before closing.
Climate risk First Street
- Flood 1/10 Low FEMA zone X (unshaded) · 0% chance over 30 yrs
- Wildfire 1/10 Low
- Heat 3/10 Moderate 7 d/yr ≥101°F today · 14 d/yr by 30 yrs out
- Wind 2/10 Low 0% chance of damaging wind over 30 yrs
- Air quality 4/10 Moderate 4 unhealthy d/yr today · 6 by 30 yrs out
Nearby sold comps map
Loading sold comps map…
Walkable amenities ~0.75 mi
Loading nearby amenities…
Taxation est. · year 1
- Rental income
- $31,939
- − Mortgage interest
- −$16,749
- − Property taxes
- −$2,832
- − Insurance
- −$1,495
- − Repairs & maintenance
- −$2,555
- − Management
- −$2,555
- − Depreciation
- −$8,698
- Taxable loss
- −$2,945
- Est. tax savings @ 24.0%
- +$707
- After-tax cash flow
- $2,796/yr
For passive investors: Depreciation is non-cash, so a rental often shows a tax loss while cash-flowing — sheltering income. Rental losses are passive: they offset passive income freely, and up to $25,000/yr can offset ordinary (W-2) income if you actively participate and your MAGI is under $100k (phasing out to $0 by $150k); unused losses carry forward. On sale, claimed depreciation is recaptured at up to 25%, and gains may owe capital-gains tax (a 1031 exchange can defer both). Figures are a year-1 estimate at your 24.0% rate — not tax advice; consult a CPA.
Schools (NCES district)
- District
- Proviso Twp Hsd 209
- NCES district ID
- 1732910
- Math proficiency
- 12% ▼ -4.00%
- Reading proficiency
- 17% ▼ -3.00%
- Median HH income
- $51,744
- Composite
- 13.5/100
- National rank
- #9518
- State rank
- #507 of 620 in IL
Livability — Westchester
- Score
- 83/100
- State rank
- #57
- US rank
- #1029
Category grades
Schools grade is shown separately in the Schools card above.
Census & demographics
- Census place
- Westchester, IL
- City population
- 16,524
- Population (ZIP)
- 16,524
Population outlook (Cook County) Hauer SSP2
- Today (2025)
- 5,347,519 people
- By 2030
- 5,357,703 · +0.2%
- By 2040
- 5,324,924 · -0.4%
- By 2050
- 5,230,762 · -2.2%
- By 2075
- 4,785,735 · -10.5%
- By 2100
- 4,188,836 · -21.7%
Race, ethnicity, and origin ACS 2023
- Neighborhood character
- Diverse neighborhood (Simpson 0.63)
- Race & ethnicity
- White 54% Hispanic / Latino 21% Black 20% Two or more races 10% Asian 3%
- Hispanic origin (detail)
- Mexican 16% Puerto Rican 2%
- Common ancestry
- Romanian 11% Iranian 2% Slovak 2%
- Foreign-born
- 14% · Canada
- Languages at home
- 75% English-only · Spanish 13% Other Indo-European 4% Russian/Polish/Slavic 3%
Political lean MEDSL · Cook
- 2024 margin
- Solid D (+42.0) · D 70.4% · R 28.4% · Other 1.2%
- 2008→2024 swing
- -11.4pp toward R · 2008: 53.4pp · 2024: 42.0pp
- All cycles
- 2024: D+42.0 2020: D+50.3 2016: D+53.0 2012: D+49.4 2008: D+53.4
Not yet ingested
- Civics
- —
Market trends
- HPI YoY
- ▼ -116.91%
- Current HPI
- 193.4043
- Rent YoY
- —
- Metro
- —
- State GDP YoY
- ▲ 1.59%
- F500 in state
- 60
Industry mix (Fortune 500 HQ in IL)
| Industry | F500 HQs | Revenue |
|---|---|---|
| Insurance | 4 | $201B |
|
||
| Consumer Goods | 4 | $87B |
|
||
| Industrial Machinery | 3 | $64B |
|
||
| Healthcare | 2 | $55B |
|
||
| Retail / Pharmacy | 1 | $148B |
|
||
| Agriculture / Food | 1 | $86B |
|
||
Price history
+160.0% since first listed4 events — show timeline
- 2026-05-21 Pending — MRED as Distributed by MLS Grid
- 2026-05-14 Listed $299,000 MRED as Distributed by MLS Grid
- 1995-02-23 Sold (Public Records) $145,000 Public Records
- 1989-04-01 Sold (Public Records) $115,000 Public Records
Property tax history
-1.3%/yrLatest (2023): $2,832 · -16.6% YoY. Source: county tax records.
Cash-flow waterfall
monthlySold comps — $/sqft
last 12 mo · ≤1 miLoading sold comps…