136 Deer Hill Ave #205 · Danbury, CT
Flood risk 1/10 · Minimal
- FEMA flood zone
- X (unshaded)
- Chance of flooding over 30 yrs
- 0.0%
- Est. flood insurance / yr
- $507 – $1,088
Fire risk 1/10 · Minimal
- Est. fire insurance / yr
- $829 – $1,539
Heat risk 5/10 · Moderate
- Hot days now (above 99°F)
- 7 days/yr
- Hot days in 30 yrs
- 15 days/yr
Wind risk 5/10 · Moderate
- Chance of severe wind over 30 yrs
- 26.0%
Air-quality risk 3/10 · Minor
- Unhealthy air days now
- 3 days/yr
- Unhealthy air days in 30 yrs
- 4 days/yr
Risk factors via First Street. Map © Google.
Why this score? — see what drove the D grade
The composite is a weighted blend of 9 inputs, each scored 0–100. Each bar is that input's sub-score; the figure is the points it added to the 100-point composite (weight × sub-score).
- Cash flow +14.0/30.0
- ARV discount +7.5/15.0
- 1% rule +5.1/10.0
- DSCR +4.2/10.0
- Livability +3.8/5.0
- Rent growth +3.3/5.0
- Condition / age +2.5/5.0
- Schools +2.4/10.0
- Appreciation +0.0/10.0
$210,000
🖨 Deal sheet (PDF) 📄 Offer letter ✓ Due diligence
Listing remarks
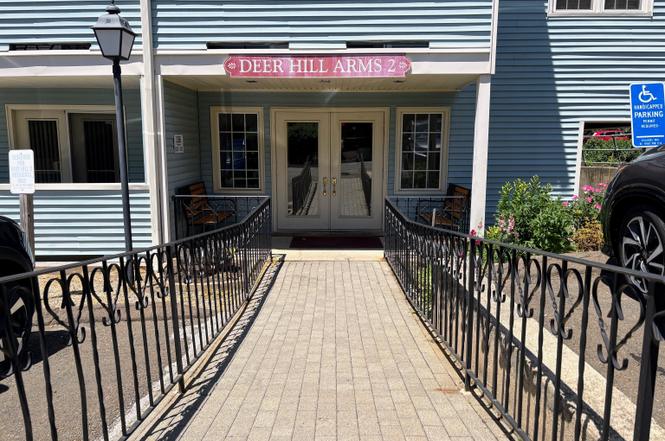
Welcome to Deer Hill Arms II, a secure, elevator-equipped 55+ community located in Danbury, just minutes from CityCenter's vibrant dining, shopping, and entertainment. Residents enjoy a welcoming lobby and gathering area to socialize with neighbors. Thoughtfully refreshed, sparkling clean, and filled with natural light, this pristine 1-bedroom, 1-bath condo offers 825 sq ft of low-maintenance living with central air conditioning for the warm summer months. Fresh paint and brand-new carpeting throughout create a truly move-in ready space. Upon entering, you are greeted by a large walk-in coat closet. The spacious kitchen features abundant cabinets and generous counters, beautifully enhanced
Key facts
- Abundant cabinets
- Natural light
- Gathering area
Tags
Property features AI
Finance
- HOA & community: Monthly HOA fee of $300; HOA covers grounds maintenance, trash pickup, snow removal, water and sewer; Unit Owners Association manages property; Pets not allowed
Exterior
- Utilities: Public water connected; Public sewer connected
- Home design: Condominium in Deer Hill Arms; Condo/Co-op property type; Unit located on floor 2
- Construction: Frame construction
- Exterior features: Covered deck; French doors; Vinyl siding; Adult 55+ community; Near library, medical facilities, park, public transportation and shopping/mall
Interior
- Kitchen: Electric range; Microwave; Refrigerator; Dishwasher
- Bedrooms: 1 bedroom (unit on 2nd floor)
- Bathrooms: 1 full bathroom
- Heating & cooling: Central air; Electric hot-air heating; Electric domestic hot water
- Interior features: Elevator; Intercom; Open floor plan; No basement
- Laundry & utility: Washer and dryer in unit
Neighborhood map
What this means for you Summary
Snapshot
- This is a 1-bed/1.0-bath condo listed at $210k.
Deal economics
- At list price, monthly cash flow is $26 ($307/yr) — positive.
- The deal already cash-flows at list — no discount required.
- Meets the 1% rule at list price ($2k rent vs $210k).
- Cap rate 6.4% vs local median 3.6% in Danbury — top-decile yield for the area; either an underpriced asset or a hidden risk that comps aren't pricing in. Stress-test before assuming the spread holds.
Location & tenants
- Location reads 76/100 on livability (#51 in CT, #3,379 nationally) — a middle-class / working-renter tenant base. Strengths: commute A+, housing A+, health & safety A+; Watch: amenities F, cost of living F.
- Danbury School District (urban): math 19% / reading 32% proficiency, ranked #131 of 153 in CT (top 86%) — low school quality limits family demand, transient renter base, plan for 1-2y turnover.
- Zoned schools: Danbury High School (math 19% / reading 41%, grade F, #137 of 194 statewide, top 70%, 3,590 students, 48% FRL).
- Market conditions: Rents rising (+3.1%/yr); 200 active listings in the ZIP; 29 comparable units currently listed for rent nearby; rentals at typical pace (median 26d on market — plan ~3-4 weeks tenant-placement turnaround); 45% of comp listings sitting > 30 days — soft ceiling on asking rent; solid renter incomes; 1,151 units permitted in Western Connecticut Planning Region in 2024 (714 in 5+ unit buildings).
- This rent runs 33% of the median local income ($77k/yr) — at the standard rent-burdened threshold; future hikes will face affordability resistance.
Forward outlook
- Local home prices are declining (-3.0%/yr); year-one equity from $1k of loan paydown is wiped out by about $6k of value loss. Plan a longer hold.
Negotiation context
- Only 11 days on market — expect competitive offers; lowballing is unlikely to land.
- Current owner paid $94k; list at $210k implies a 125% gain — meaningful room to come down on a strong offer.
Risks & watch-outs
- Climate carrying-cost: moderate wind risk, 26% chance of damaging wind over 30y; extreme-heat days projected 7→15/yr by 2055 (HVAC capex compounding) — expect insurance premiums to compound above CPI over the hold.
Questions for the listing agent
- What does the HOA fee cover, when was the last increase, and are there any pending special assessments or reserve-fund shortfalls?
- Any open or pending special assessments — roof, HVAC, plumbing, elevator, façade? What's the per-unit balance and payoff schedule, and is the seller paying it off at close or rolling it to the buyer?
- Is there a deadline driving the sale (1031 exchange, divorce, estate, relocation)? That informs how much negotiation room exists.
- Schools are D-rated, which usually means shorter tenancies and higher turnover. Who's the typical renter profile here, and what's been the actual vacancy rate?
- The area grade is low — what's the realistic commute time and amenity access for the typical tenant pool here? Any planned neighborhood developments (good or bad) we should know about?
- What's the average days-on-market for RENTAL listings here right now (not sales)? A rising rental-DOM trend means longer vacancies and softer asking-rent achievability than the comps imply.
- What's the recent tenant-quality profile in this submarket — average credit score on applications, eviction rate, late-payment / NSF rate, and stable-employment percentage? A property-management company in the area should have these aggregated.
- How much new apartment / multifamily construction is in the pipeline within 1–3 miles? Heavy new supply (>2% of stock underway) typically softens rents 12–24 months out; light construction supports rent growth.
Investment metrics
- 1% rule
- 1.01% ✓
- Cap rate
- 6.44%
- Cash-on-cash
- 0.52%
- DSCR
- 1.02
- GRM
- 8.2
CMA / ARV
No comps found within radius.
Projected returns pro-forma
-3.0% appreciation · 3.08% rent growth · sell at horizon
- IRR
- -15.3%
- Equity multiple
- 0.45×
- Total profit
- $-32,068
- Equity at exit
- $31,312
- IRR
- -6.4%
- Equity multiple
- 0.58×
- Total profit
- $-24,472
- Equity at exit
- $18,157
Cash invested: $58,800 (down + closing). Projections, not guarantees.
Landlord ↔ Tenant lean methodology
- Overall (STATE)
- 27 Tenant-Leaning
- State Connecticut
- 27 Tenant-Leaning · D+7
- County
- — inherits STATE
- City
- — inherits STATE
ZIP-level market 06810
- Rents YoY
- 3.1%
- Active inventory
- 200
- Price-to-rent
- 8.2×
Monthly cashflow live
- Estimated rent
- $2,131 high interval (Pro) →
- Mortgage (P&I)
- −$1,101
- Tax from tax record
- −$169 /mo · $2,033/yr
- Insurance
- −$88
- HOA
- −$300
- Vacancy / Maint / Mgmt
- −$448
- Net cashflow
- $26
Break-even live
Sensitivity live
| Price | -10% $144 | -5% $85 | +0% $26 | +5% $-34 | +10% $-93 |
|---|---|---|---|---|---|
| Rent | -10% $-143 | -5% $-59 | +0% $26 | +5% $110 | +10% $194 |
| Rate | -1.0pp $131 | -0.5pp $79 | base $26 | +0.5pp $-29 | +1.0pp $-84 |
UW: 25.0% down · 7.5% · 30yr · 1.5% tax · 5.0% vac · 8.0% maint · 8.0% mgmt
Financing live
Cash to close
- Down payment
- $52,500
- Closing costs
- $6,300
- Reserves months
- —
- Total cash needed
- —
Loan-product check · same deal, 3 products live
Conventional
25% down · 7.5% · 30yr
- Down + closing
- —
- Monthly P&I
- —
- Monthly cashflow
- —
- DSCR
- —
- Eligible?
- —
Personal DTI + credit; lowest rate.
DSCR
20% down · 8.5% · 30yr
- Down + closing
- —
- Monthly P&I
- —
- Monthly cashflow
- —
- DSCR
- —
- Eligible?
- —
No personal income docs; deal must DSCR.
Hard money
10% down · 12.0% · 12mo
- Down + closing
- —
- Monthly P&I
- —
- Monthly cashflow
- —
- DSCR
- —
- Eligible?
- —
Short-term bridge; refi at stabilization.
Rent comps 29 comps
| Address | Beds | Baths | Sqft | Rent | $/sqft | DOM | Units | Dist |
|---|---|---|---|---|---|---|---|---|
| 136 Deer Hill Ave Unit A6 Danbury, CT | 1.0 | 1.0 | 800 | $2,200 | $2.75 | 45d | 1 | 0.02mi |
| 30 Foster St Danbury, CT | 1.0 | 1.0 | 700 | $1,980 | $2.83 | 25d | 1 | 0.13mi |
| 7 New St Unit 202 Danbury, CT | 2.0 | 1.0 | 750 | $2,300 | $3.07 | 45d | 1 | 0.23mi |
| 4 Division St Apt 4 Danbury, CT | 2.0 | 1.0 | 850 | $2,500 | $2.94 | 45d | 1 | 0.33mi |
| 4 Division St Danbury, CT | 2.0 | 1.0 | 1000 | $2,500 | $2.50 | 25d | 1 | 0.34mi |
| 50 Lincoln Ave Unit 1 R Danbury, CT | 2.0 | 1.0 | 825 | $2,300 | $2.79 | 5d | 1 | 0.34mi |
| 76 Town Hill Ave Unit D Danbury, CT | 2.0 | 1.0 | 870 | $2,450 | $2.82 | 45d | 1 | 0.43mi |
| 32 Park Ave Danbury, CT | 1.0 | 1.0 | 800 | $2,000 | $2.50 | 25d | 1 | 0.46mi |
| 89 Town Hill Ave Unit 3N Danbury, CT | 1.0 | 1.0 | 550 | $1,200 | $2.18 | 25d | 1 | 0.49mi |
| 333 Main St Danbury, CT | 1.0–2.0 | 1.0–2.0 | 869 | $2,095 | $2.41 | 5d | 2 | 0.54mi |
| 1 Fairview Dr #4 Danbury, CT | 2.0 | 1.0 | 910 | $2,050 | $2.25 | 21d | 1 | 0.56mi |
| 1 Kennedy Ave Danbury, CT | 2.0 | 1.0–2.0 | 874 | $2,265 | $2.59 | 4d | 31 | 0.58mi |
| 8 Rose St Unit 20-1 Danbury, CT | 1.0 | 1.0 | 828 | $2,000 | $2.42 | 45d | 1 | 0.62mi |
| 15 Bates Pl Unit 11A Danbury, CT | 1.0 | 1.5 | 850 | $2,020 | $2.38 | 16d | 1 | 0.66mi |
| 6 Westville Ave Unit 6A Danbury, CT | 2.0 | 1.0 | 1000 | $1,900 | $1.90 | 45d | 1 | 0.68mi |
| 17 Lake Ave #2 Danbury, CT | 2.0 | 1.0 | 1000 | $1,995 | $2.00 | 45d | 1 | 0.68mi |
| 47 Merrimac St Danbury, CT | 2.0 | 1.5 | 1000 | $2,400 | $2.40 | 45d | 1 | 0.81mi |
| 126 Triangle St Danbury, CT | 1.0–2.0 | 1.0–2.0 | 827 | $1,750 | $2.12 | 21d | 2 | 0.99mi |
| 126 Triangle St Unit A24 Danbury, CT | 1.0 | 1.0 | 636 | $1,800 | $2.83 | 4d | 1 | 0.99mi |
| 126 Triangle St Unit A5 Danbury, CT | 2.0 | 2.0 | 1018 | $2,100 | $2.06 | 16d | 1 | 0.99mi |
| 126 Triangle St Unit A41 Danbury, CT | 1.0 | 1.0 | 693 | $1,800 | $2.60 | 45d | 1 | 0.99mi |
| 35 9th Ave Unit 1R Danbury, CT | 2.0 | 1.0 | 650 | $2,100 | $3.23 | 16d | 1 | 1.00mi |
| 38 Homestead Ave Unit 2 Danbury, CT | 2.0 | 1.0 | 1000 | $2,200 | $2.20 | 23d | 1 | 1.15mi |
| 34 James St Unit A Danbury, CT | 2.0 | 1.5 | 900 | $2,300 | $2.56 | 45d | 1 | 1.20mi |
| 34 James St Unit A Danbury, CT | 2.0 | 1.5 | 900 | $2,300 | $2.56 | 12d | 1 | 1.20mi |
| 10 Clapboard Ridge Rd Danbury, CT | 1.0–3.0 | 1.0–2.0 | 1061 | $2,206 | $2.08 | 4d | 20 | 1.28mi |
| 16 Scuppo Rd Unit D4 Danbury, CT | 2.0 | 1.0 | 918 | $2,400 | $2.61 | 45d | 1 | 1.42mi |
| 1 Beaver Brook Rd #47 Danbury, CT | — | 1.0 | 700 | $1,750 | $2.50 | 45d | 1 | 1.42mi |
| 14 Newtown Rd Unit B5 Danbury, CT | 1.0 | 1.0 | 868 | $1,840 | $2.12 | 45d | 1 | 1.49mi |
HOA detail condo
- Monthly dues
- $300 · $3,600/yr
- Assessments
- None detected in remarks — confirm with the listing agent.
Listing history 7 events
-
2026-06-22days on market $210,000 Active 11 DOM
-
2026-06-18days on market $210,000 Active 8 DOM
-
2026-06-17days on market $210,000 Active 7 DOM
-
2026-06-16days on market $210,000 Active 6 DOM
-
2026-06-15days on market $210,000 Active 5 DOM
-
2026-06-13remarks 699-char remark
-
2026-06-13$210,000 Active 3 DOM
ⓘ Source: listings_history table (triggers on properties + properties_extension) + one-shot
backfill from property_details.listing_events for pre-trigger history.
Tax reassessment forecast CT · Partial reset (capped growth)
- Current annual tax
- $2,033 · $169/mo
- Projected year-2 tax
- $3,264 · $272/mo
- Expected delta
- +$1,230/yr (+$103/mo · 60.5%)
ⓘ Screening estimate from a state-policy table — verify with the county assessor before closing.
Climate risk First Street
- Flood 1/10 Low FEMA zone X (unshaded) · 0% chance over 30 yrs
- Wildfire 1/10 Low
- Heat 5/10 Major 7 d/yr ≥99°F today · 15 d/yr by 30 yrs out
- Wind 5/10 Major 26% chance of damaging wind over 30 yrs
- Air quality 3/10 Moderate 3 unhealthy d/yr today · 4 by 30 yrs out
Nearby sold comps map
Loading sold comps map…
Walkable amenities ~0.75 mi
Loading nearby amenities…
Taxation est. · year 1
- Rental income
- $25,576
- − Mortgage interest
- −$11,763
- − Property taxes
- −$2,033
- − Insurance
- −$1,050
- − Repairs & maintenance
- −$2,046
- − Management
- −$2,046
- − HOA
- −$3,600
- − Depreciation
- −$6,109
- Taxable loss
- −$3,071
- Est. tax savings @ 24.0%
- +$737
- After-tax cash flow
- $1,044/yr
For passive investors: Depreciation is non-cash, so a rental often shows a tax loss while cash-flowing — sheltering income. Rental losses are passive: they offset passive income freely, and up to $25,000/yr can offset ordinary (W-2) income if you actively participate and your MAGI is under $100k (phasing out to $0 by $150k); unused losses carry forward. On sale, claimed depreciation is recaptured at up to 25%, and gains may owe capital-gains tax (a 1031 exchange can defer both). Figures are a year-1 estimate at your 24.0% rate — not tax advice; consult a CPA.
Schools (NCES district)
- District
- Danbury School District
- NCES district ID
- 0901020
- Math proficiency
- 19% ▼ -17.00%
- Reading proficiency
- 32% ▼ -16.00%
- Median HH income
- $65,793
- Composite
- 23.93/100
- National rank
- #7784
- State rank
- #131 of 153 in CT
Livability — Danbury
- Score
- 76/100
- State rank
- #51
- US rank
- #3379
Category grades
Schools grade is shown separately in the Schools card above.
Census & demographics
- Census place
- Danbury, CT
- County
- Fairfield County · 765,532 people
- City population
- 87,061
- Metro
- Bridgeport-Stamford-Norwalk, CT
- Population (ZIP)
- 55,833
- Household income
- $76,933
- Rent vs Own
- Severe rent burden
- 3255.0
Population outlook (Western Connecticut County) Hauer SSP2
- By 2040
- 685,031
Race, ethnicity, and origin ACS 2023
- Neighborhood character
- Highly diverse neighborhood (Simpson 0.72)
- Race & ethnicity
- Hispanic / Latino 37% White 35% Two or more races 19% Black 12% Asian 5%
- Hispanic origin (detail)
- Mexican 4% Puerto Rican 3% Dominican 6%
- Common ancestry
- Estonian 8% Russian 4% Romanian 3%
- Foreign-born
- 41% · Canada, Jamaica, Dominican Republic
- Languages at home
- 48% English-only · Spanish 32% Other Indo-European 16% Other Asian/Pacific 1%
Political lean MEDSL · Western Connecticut
- 2024 margin
- D (+19.1) · D 58.8% · R 39.7% · Other 1.6%
- All cycles
- 2024: D+19.1
Not yet ingested
- Civics
- —
Market trends
- HPI YoY
- ▼ -309.71%
- Current HPI
- 286.5484
- Rent YoY
- ▲ 3.08%
- Metro
- Bridgeport-Stamford-Norwalk, CT
- State GDP YoY
- ▲ 1.06%
- F500 in state
- 38
Industry mix (Fortune 500 HQ in CT)
| Industry | F500 HQs | Revenue |
|---|---|---|
| Industrial Machinery | 4 | $38B |
|
||
| Insurance | 3 | $71B |
|
||
| Financial Services | 2 | $25B |
|
||
| Transportation / Logistics | 2 | $18B |
|
||
| Healthcare | 1 | $247B |
|
||
| Telecommunications | 1 | $55B |
|
||
Price history
+124.6% since first listed2 events — show timeline
- 2026-06-10 Listed $210,000 Smart MLS
- 2002-02-27 Sold (Public Records) $93,500 Public Records
Property tax history
+0.3%/yrLatest (2023): $2,033 · +7.3% YoY. Source: county tax records.
Cash-flow waterfall
monthlySold comps — $/sqft
last 12 mo · ≤1 miLoading sold comps…