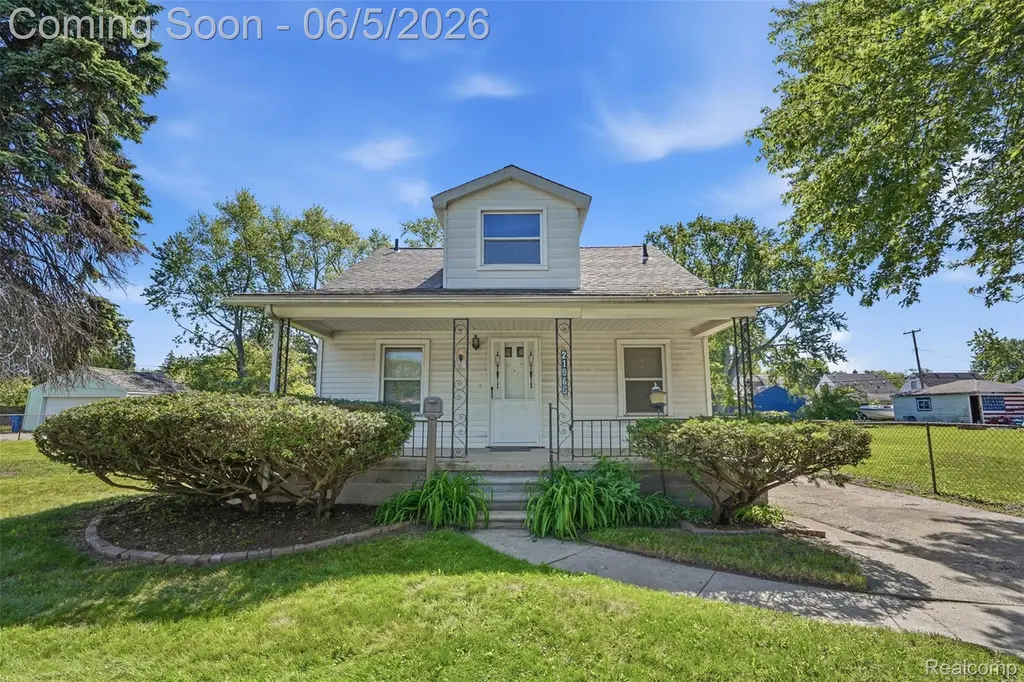
21966 Curie Ave · Warren, MI
Flood risk 5/10 · Moderate
- FEMA flood zone
- X (unshaded)
- Chance of flooding over 30 yrs
- 0.64%
- Est. flood insurance / yr
- $507 – $1,088
Fire risk 1/10 · Minimal
- Est. fire insurance / yr
- $784 – $1,456
Heat risk 3/10 · Minor
- Hot days now (above 97°F)
- 7 days/yr
- Hot days in 30 yrs
- 15 days/yr
Wind risk 1/10 · Minimal
- Chance of severe wind over 30 yrs
- —
Air-quality risk 3/10 · Minor
- Unhealthy air days now
- 3 days/yr
- Unhealthy air days in 30 yrs
- 5 days/yr
Risk factors via First Street. Map © Google.
Why this score? — see what drove the B- grade
The composite is a weighted blend of 9 inputs, each scored 0–100. Each bar is that input's sub-score; the figure is the points it added to the 100-point composite (weight × sub-score).
- Cash flow +30.0/30.0
- 1% rule +10.0/10.0
- DSCR +10.0/10.0
- ARV discount +7.5/15.0
- Livability +3.7/5.0
- Rent growth +3.1/5.0
- Condition / age +2.5/5.0
- Schools +1.3/10.0
- Appreciation +0.0/10.0
$60,000
🖨 Deal sheet (PDF) 📄 Offer letter ✓ Due diligence
Listing remarks MLS
* * * Open houses Sat 6/6/26 12pm-2pm and Sun 6/7/26 10am-12pm * * * INVESTMENT SPECIAL!!!!! Come checkout this amazing opportunity in Warren. This three-bedroom, one-bath bungalow, featuring a double lot and a large detached garage is priced to sell immediately.
Key facts
- 6,534 sq ft lot
- Garage
- Built 1940
Property features AI
Finance
- Other: Pets allowed
Exterior
- Parking: Detached garage (electric in garage), approximately 20 x 20; Approximately 1.5 parking spaces in garage
- Utilities: Public water; Natural gas heat and gas water heater; Central air conditioning; Forced air heating
- Home design: Residential property; 1 1/2-story structure; Built in 1940; City location (Warren)
- Construction: Metal siding exterior; Crawl foundation
- Exterior features: Fenced yard; Porch; Paved street access; Frontage about 45 feet
Interior
- Kitchen: Kitchen on entry level (approximately 9 x 7) with linoleum flooring
- Bedrooms: Primary bedroom on second floor (approximately 16 x 23) with carpet; Second bedroom on entry level (approximately 10 x 10) with carpet; Third bedroom on entry level (approximately 10 wide) with carpet
- Flooring: Carpet in living room and bedrooms; Linoleum in dining room and kitchen; Vinyl in bathroom
- Bathrooms: One full bathroom on entry level with vinyl flooring (approx. 9 x 6)
- Heating & cooling: Forced air heating (natural gas); Gas water heater; Central A/C
- Interior features: Seven total rooms; Porch
Neighborhood map
What this means for you Summary
Snapshot
- This is a 3-bed/1.0-bath single-family listed at $60k.
Deal economics
- At list price, monthly cash flow is $707 ($8k/yr) — positive.
- The deal already cash-flows at list — no discount required.
- Meets the 1% rule at list price ($1k rent vs $60k).
- Cap rate 20.4% vs local median 5.2% in Warren — top-decile yield for the area; either an underpriced asset or a hidden risk that comps aren't pricing in. Stress-test before assuming the spread holds.
Location & tenants
- Location reads 74/100 on livability (#171 in MI, #4,491 nationally) — a middle-class / working-renter tenant base. Strengths: commute A+, cost of living A+, housing A+; Watch: amenities D, employment D, crime D-.
- Fitzgerald Public Schools (urban): math 8% / reading 23% proficiency, ranked #503 of 540 in MI (top 93%) — low school quality limits family demand, transient renter base, plan for 1-2y turnover; 77% free/reduced lunch — lower-income household profile, screen leases tightly.
- Zoned schools: Mound Park Elementary School (math 6% / reading 16%, grade F, #1,226 of 1,397 statewide, top 88%, 260 students, 87% FRL); Pd Chatterton Middle School (math 9% / reading 27%, grade F, #433 of 493 statewide, top 88%, 410 students, 86% FRL); Fitzgerald Senior High School (math 8% / reading 26%, grade F, #636 of 713 statewide, top 89%, 806 students, 82% FRL).
- Market conditions: Rents rising (+2.4%/yr); 170 active listings in the ZIP; 27 comparable units currently listed for rent nearby; rentals at typical pace (median 26d on market — plan ~3-4 weeks tenant-placement turnaround); 1,321 units permitted in Macomb County in 2024 (86 in 5+ unit buildings).
- This rent runs 32% of the median local income ($54k/yr) — at the standard rent-burdened threshold; future hikes will face affordability resistance.
Forward outlook
- Local home prices are declining (-3.0%/yr); year-one equity from $415 of loan paydown is wiped out by about $2k of value loss. Plan a longer hold.
- Macomb County population projected at +9% by 2050 — modest demand growth; plan on rents tracking national, not racing it.
- At projected returns (-3.0% appreciation + 2.4% rent growth), your $17k cash investment doubles in ~3 years — after that, you're playing with house money.
Negotiation context
- Only 6 days on market — expect competitive offers; lowballing is unlikely to land.
- 2 sale attempts with the ask held roughly flat each time — persistent listings suggest the price (not the market) is what's stuck; bring a comps-based counter.
Risks & watch-outs
- Watch-outs: built in 1940 — expect roof / HVAC / electrical / plumbing capex.
- Climate carrying-cost: moderate flood risk — expect insurance premiums to compound above CPI over the hold.
Questions for the listing agent
- Built in 1940 — when were the roof, HVAC, electrical panel, plumbing, and water heater last replaced?
- Is there a deadline driving the sale (1031 exchange, divorce, estate, relocation)? That informs how much negotiation room exists.
- Schools are D-rated, which usually means shorter tenancies and higher turnover. Who's the typical renter profile here, and what's been the actual vacancy rate?
- Crime grade is D in this area — have there been break-ins, vandalism, or insurance claims at this property in the last 3 years? What carrier currently insures it and at what premium?
- What's the average days-on-market for RENTAL listings here right now (not sales)? A rising rental-DOM trend means longer vacancies and softer asking-rent achievability than the comps imply.
- What's the recent tenant-quality profile in this submarket — average credit score on applications, eviction rate, late-payment / NSF rate, and stable-employment percentage? A property-management company in the area should have these aggregated.
- How much new for-sale + rental construction is in the pipeline within 1–3 miles? Heavy new supply typically softens prices + rents 12–24 months out; constrained supply supports both.
Investment metrics
- 1% rule
- 2.38% ✓
- Cap rate
- 20.42%
- Cash-on-cash
- 50.47%
- DSCR
- 3.25
- GRM
- 3.5
CMA / ARV
- ARV (on-the-fly)
- $138,600
- Comps found
- 12
Show comp detail 12 sales within ~0.75 mi
| Address | Dist | Beds/Ba | Sqft | Sold | Price | $/sf | Match |
|---|---|---|---|---|---|---|---|
| 22369 Cunningham Ave | 0.43mi | 3/1.0 | 900 (0%) | 1mo | $150,000 | $167 | 79 |
| 21410 Panama St | 0.29mi | 2/1.0 (-1) | 900 (0%) | 5mo | $72,000 | $80 | 77 |
| 22595 Curie Ave | 0.26mi | 2/1.0 (-1) | 887 (-1%) | 4mo | $40,000 | $45 | 77 |
| 23241 Hill Ave | 0.54mi | 2/1.0 (-1) | 912 (+1%) | 1mo | $145,000 | $159 | 66 |
| 5584 Toepfer Rd | 0.19mi | 3/1.0 | 1,007 (+12%) | 8mo | $139,900 | $139 | 65 |
| 22011 Masch Ave | 0.28mi | 3/1.0 | 1,000 (+11%) | 5mo | $163,000 | $163 | 64 |
| 21034 Atlantic Ave | 0.42mi | 3/1.0 | 836 (-7%) | 5mo | $120,000 | $144 | 64 |
| 23220 Audrey Ave | 0.51mi | 2/1.0 (-1) | 952 (+6%) | 1mo | $169,900 | $178 | 61 |
| 20818 Atlantic Ave | 0.50mi | 2/1.0 (-1) | 836 (-7%) | 6mo | $72,000 | $86 | 55 |
| 22694 Le Fever Ave | 0.53mi | 3/1.0 | 1,000 (+11%) | 2mo | $154,000 | $154 | 55 |
| 23311 Panama Ave | 0.59mi | 3/1.0 | 1,015 (+13%) | 3mo | $175,000 | $172 | 48 |
| 22321 Logue Ave | 0.55mi | 3/1.0 | 1,018 (+13%) | 6mo | $145,000 | $142 | 47 |
Match score weights: distance 35% · size 25% · config 20% · recency 20%. Top-matched comps best support the ARV.
Projected returns pro-forma
-3.0% appreciation · 2.35% rent growth · sell at horizon
- IRR
- 47.5%
- Equity multiple
- 3.05×
- Total profit
- $34,376
- Equity at exit
- $8,946
- IRR
- 52.9%
- Equity multiple
- 6.01×
- Total profit
- $84,226
- Equity at exit
- $5,188
Cash invested: $16,800 (down + closing). Projections, not guarantees.
Landlord ↔ Tenant lean methodology
- Overall (STATE)
- 62 Landlord-Friendly
- State Michigan
- 62 Landlord-Friendly · EVEN
- County
- — inherits STATE
- City
- — inherits STATE
ZIP-level market 48091
- Rents YoY
- 2.4%
- Active inventory
- 170
- Price-to-rent
- 3.5×
Monthly cashflow live
- Estimated rent
- $1,429 high interval (Pro) →
- Mortgage (P&I)
- −$315
- Tax from tax record
- −$83 /mo · $993/yr
- Insurance
- −$25
- HOA
- −$0
- Vacancy / Maint / Mgmt
- −$300
- Net cashflow
- $707
Break-even live
Sensitivity live
| Price | -10% $741 | -5% $724 | +0% $707 | +5% $690 | +10% $673 |
|---|---|---|---|---|---|
| Rent | -10% $594 | -5% $650 | +0% $707 | +5% $763 | +10% $819 |
| Rate | -1.0pp $737 | -0.5pp $722 | base $707 | +0.5pp $691 | +1.0pp $675 |
UW: 25.0% down · 7.5% · 30yr · 1.5% tax · 5.0% vac · 8.0% maint · 8.0% mgmt
Financing live
Cash to close
- Down payment
- $15,000
- Closing costs
- $1,800
- Reserves months
- —
- Total cash needed
- —
Loan-product check · same deal, 3 products live
Conventional
25% down · 7.5% · 30yr
- Down + closing
- —
- Monthly P&I
- —
- Monthly cashflow
- —
- DSCR
- —
- Eligible?
- —
Personal DTI + credit; lowest rate.
DSCR
20% down · 8.5% · 30yr
- Down + closing
- —
- Monthly P&I
- —
- Monthly cashflow
- —
- DSCR
- —
- Eligible?
- —
No personal income docs; deal must DSCR.
Hard money
10% down · 12.0% · 12mo
- Down + closing
- —
- Monthly P&I
- —
- Monthly cashflow
- —
- DSCR
- —
- Eligible?
- —
Short-term bridge; refi at stabilization.
Rent comps 27 comps
| Address | Beds | Baths | Sqft | Rent | $/sqft | DOM | Units | Dist |
|---|---|---|---|---|---|---|---|---|
| 22622 Panama Ave Warren, MI | 3.0 | 1.5 | 920 | $1,395 | $1.52 | 12d | 1 | 0.28mi |
| 21410 Panama St Warren, MI | 3.0 | 1.0 | 900 | $1,600 | $1.78 | 26d | 1 | 0.31mi |
| 21465 Syracuse Ave Warren, MI | 3.0 | 1.0 | 990 | $1,375 | $1.39 | 45d | 1 | 0.31mi |
| 22580 Masch Ave Warren, MI | 3.0 | 1.0 | 988 | $1,450 | $1.47 | 26d | 1 | 0.39mi |
| 20794 Audrey Ave Warren, MI | 3.0 | 1.0 | 954 | $1,350 | $1.42 | 45d | 1 | 0.55mi |
| 20263 Caldwell St Detroit, MI | 3.0 | 1.0 | 909 | $1,350 | $1.49 | 18d | 1 | 0.82mi |
| 7043 Meadow Ave Warren, MI | 2.0 | 1.0 | 911 | $1,274 | $1.40 | 45d | 1 | 1.03mi |
| 7033 Westminster Ave Warren, MI | 2.0 | 1.0 | 561 | $1,050 | $1.87 | 45d | 1 | 1.05mi |
| 3840 Bart Ave Warren, MI | 3.0 | 1.0 | 1062 | $1,350 | $1.27 | 26d | 1 | 1.05mi |
| 6847 Continental Ave Warren, MI | 4.0 | 1.0 | 1000 | $1,595 | $1.59 | 1d | 1 | 1.05mi |
| 7060 Victory Ave Warren, MI | 3.0 | 1.0 | 945 | $1,450 | $1.53 | 13d | 1 | 1.06mi |
| 7275 Chalmers Ave Warren, MI | 2.0 | 1.0 | 703 | $1,200 | $1.71 | 26d | 1 | 1.12mi |
| 7511 Toepfer Rd Warren, MI | 3.0 | 1.0 | 1032 | $1,199 | $1.16 | 23d | 1 | 1.14mi |
| 19930 Binder St Detroit, MI | 3.0 | 1.0 | 1000 | $1,450 | $1.45 | 18d | 1 | 1.29mi |
| 8036 Hupp Ave Warren, MI | 2.0 | 1.0 | 680 | $1,150 | $1.69 | 45d | 1 | 1.31mi |
| 19450 Fenelon St Detroit, MI | 3.0 | 1.0 | 1062 | $1,384 | $1.30 | 6d | 1 | 1.32mi |
| 7605 Jackson Ave Warren, MI | 2.0 | 1.0 | 600 | $1,165 | $1.94 | 26d | 1 | 1.34mi |
| 8065 Meadow Ave Warren, MI | 2.0 | 1.0 | 800 | $1,050 | $1.31 | 26d | 1 | 1.36mi |
| 21155 Warner Ave Warren, MI | 2.0 | 1.0 | 756 | $1,029 | $1.36 | 26d | 1 | 1.38mi |
| 4652 E 10 Mile Rd Warren, MI | 2.0 | 1.0 | 950 | $1,200 | $1.26 | 45d | 1 | 1.39mi |
| 19415 Gable St Detroit, MI | 3.0 | 1.0 | 1000 | $1,373 | $1.37 | 26d | 1 | 1.39mi |
| 19361 Moenart St Unit 1 Detroit, MI | 2.0 | 1.0 | 1000 | $1,100 | $1.10 | 25d | 1 | 1.39mi |
| 2709 Capitol Ave Warren, MI | 3.0 | 2.0 | 1056 | $1,649 | $1.56 | 45d | 1 | 1.42mi |
| 8162 Orchard Ave Warren, MI | 2.0 | 1.0 | 900 | $1,000 | $1.11 | 45d | 1 | 1.44mi |
| 20255 Harned St Detroit, MI | 3.0 | 1.0 | 1000 | $1,374 | $1.37 | 18d | 1 | 1.46mi |
| 8251 Hudson Ave Warren, MI | 3.0 | 1.0 | 908 | $1,400 | $1.54 | 26d | 1 | 1.46mi |
| 19260 Bloom St Detroit, MI | 3.0 | 1.0 | 1100 | $1,350 | $1.23 | 6d | 1 | 1.47mi |
Listing history 7 events
-
2026-06-13statusdays on market $60,000 Pending 6 DOM
-
2026-06-09days on market $60,000 Active 5 DOM
-
2026-06-08days on market $60,000 Active 4 DOM
-
2026-06-07remarks 268-char remark
-
2026-06-07statusdays on market $60,000 Active 3 DOM
-
2026-06-04remarks 266-char remark
-
2026-06-04$60,000 Coming Soon 1 DOM
ⓘ Source: listings_history table (triggers on properties + properties_extension) + one-shot
backfill from property_details.listing_events for pre-trigger history.
Tax reassessment forecast MI · Partial reset (capped growth)
- Current annual tax
- $993 · $83/mo
- Projected year-2 tax
- $993 · $83/mo
- Expected delta
- $0/yr ($0/mo · 0.0%)
ⓘ Screening estimate from a state-policy table — verify with the county assessor before closing.
Climate risk First Street
- Flood 5/10 Major FEMA zone X (unshaded) · 64% chance over 30 yrs
- Wildfire 1/10 Low
- Heat 3/10 Moderate 7 d/yr ≥97°F today · 15 d/yr by 30 yrs out
- Wind 1/10 Low
- Air quality 3/10 Moderate 3 unhealthy d/yr today · 5 by 30 yrs out
Nearby sold comps map
Loading sold comps map…
Walkable amenities ~0.75 mi
Loading nearby amenities…
Taxation est. · year 1
- Rental income
- $17,149
- − Mortgage interest
- −$3,361
- − Property taxes
- −$993
- − Insurance
- −$300
- − Repairs & maintenance
- −$1,372
- − Management
- −$1,372
- − Depreciation
- −$1,745
- Taxable income
- $8,005
- Est. tax owed @ 24.0%
- −$1,921
- After-tax cash flow
- $6,557/yr
For passive investors: Depreciation is non-cash, so a rental often shows a tax loss while cash-flowing — sheltering income. Rental losses are passive: they offset passive income freely, and up to $25,000/yr can offset ordinary (W-2) income if you actively participate and your MAGI is under $100k (phasing out to $0 by $150k); unused losses carry forward. On sale, claimed depreciation is recaptured at up to 25%, and gains may owe capital-gains tax (a 1031 exchange can defer both). Figures are a year-1 estimate at your 24.0% rate — not tax advice; consult a CPA.
Schools (NCES district)
- District
- Fitzgerald Public Schools
- NCES district ID
- 2614460
- Math proficiency
- 8% ▼ -8.00%
- Reading proficiency
- 23% ▼ -11.00%
- Median HH income
- $34,828
- Composite
- 12.67/100
- National rank
- #9608
- State rank
- #503 of 540 in MI
Livability — Warren
- Score
- 74/100
- State rank
- #171
- US rank
- #4491
Category grades
Schools grade is shown separately in the Schools card above.
Census & demographics
- Census place
- Warren, MI
- County
- Macomb County · 638,552 people
- City population
- 114,937
- Metro
- Detroit-Warren-Dearborn, MI
- Population (ZIP)
- 30,696
- Household income
- $54,230
- Rent vs Own
- Severe rent burden
- 1296.0
Population outlook (Macomb County) Hauer SSP2
- Today (2025)
- 925,296 people
- By 2030
- 948,226 · +2.5%
- By 2040
- 983,961 · +6.3%
- By 2050
- 1,010,200 · +9.2%
- By 2075
- 1,076,222 · +16.3%
- By 2100
- 1,077,065 · +16.4%
Race, ethnicity, and origin ACS 2023
- Neighborhood character
- Diverse neighborhood (Simpson 0.68)
- Race & ethnicity
- White 47% Black 25% Asian 19% Two or more races 5% Hispanic / Latino 3% Native American 2%
- Common ancestry
- Romanian 7% Lithuanian 2% Slovak 1%
- Foreign-born
- 16% · Canada
- Languages at home
- 77% English-only · Other Indo-European 14% Other Asian/Pacific 3% Russian/Polish/Slavic 2%
Political lean MEDSL · Macomb
- 2024 margin
- R (+13.7) · D 42.2% · R 55.9% · Other 1.9%
- 2008→2024 swing
- -22.3pp toward R · 2008: 8.6pp · 2024: -13.7pp
- All cycles
- 2024: R+13.7 2020: R+8.1 2016: R+11.6 2012: D+4.0 2008: D+8.6
Not yet ingested
- Civics
- —
Market trends
- HPI YoY
- ▼ -199.66%
- Current HPI
- 177.9273
- Rent YoY
- ▲ 2.35%
- Metro
- Detroit-Warren-Dearborn, MI
- State GDP YoY
- ▲ 1.37%
- F500 in state
- 28
Industry mix (Fortune 500 HQ in MI)
| Industry | F500 HQs | Revenue |
|---|---|---|
| Automotive Parts | 3 | $48B |
|
||
| Automotive | 2 | $372B |
|
||
| Chemicals | 1 | $45B |
|
||
| Automotive Retail | 1 | $29B |
|
||
| Healthcare / Medical Devices | 1 | $23B |
|
||
| Automotive Technology | 1 | $20B |
|
||
Price history
+0.0% since first listed3 events — show timeline
- 2026-06-05 Listed $60,000 MiRealSource-MiMLS
- 2026-06-05 Listed $60,000 REALCOMP
- 2026-06-03 Coming Soon $60,000 MiRealSource-MiMLS
Property tax history
+1.9%/yrLatest (2025): $993 · +2.5% YoY. Source: county tax records.
Cash-flow waterfall
monthlySold comps — $/sqft
last 12 mo · ≤1 miLoading sold comps…