1001 NE 82nd Ave · Fanning Springs, FL
Flood risk 4/10 · Minor
- FEMA flood zone
- X (unshaded)
- Chance of flooding over 30 yrs
- 0.23%
- Est. flood insurance / yr
- $507 – $1,088
Fire risk 7/10 · Major
- Est. fire insurance / yr
- $947 – $1,759
Heat risk 9/10 · Severe
- Hot days now (above 107°F)
- 7 days/yr
- Hot days in 30 yrs
- 23 days/yr
Wind risk 9/10 · Severe
- Chance of severe wind over 30 yrs
- 99.0%
Air-quality risk 2/10 · Minimal
- Unhealthy air days now
- 1 days/yr
- Unhealthy air days in 30 yrs
- 2 days/yr
Risk factors via First Street. Map © Google.
Why this score? — see what drove the D grade
The composite is a weighted blend of 9 inputs, each scored 0–100. Each bar is that input's sub-score; the figure is the points it added to the 100-point composite (weight × sub-score).
- Appreciation +10.0/10.0
- Cash flow +8.0/30.0
- ARV discount +7.5/15.0
- Schools +4.2/10.0
- Livability +3.2/5.0
- Rent growth +2.5/5.0
- Condition / age +2.5/5.0
- 1% rule +2.2/10.0
- DSCR +2.0/10.0
$220,000
🖨 Deal sheet (PDF) 📄 Offer letter ✓ Due diligence
Listing remarks MLS
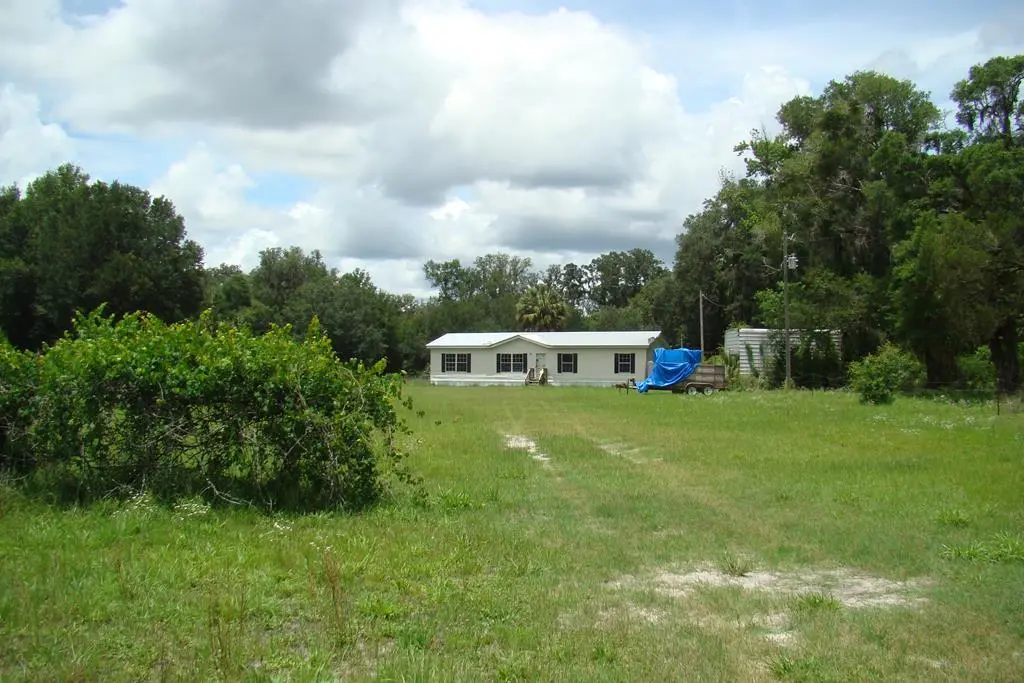
REDUCED!!!! This 6.15 acres has a little bit of everything! Gated/fenced/cross fenced pastures with plenty of room for horses, cattle or goats to roam. No farm animals? No worries, plenty of room for the large family to play. Few trees dot the property for shade. Features spacious well maintained 4 BR, 2 Bath DWMH open kitchen w/ island & dining, family room, living room w/ wood burning fireplace, large master suite and bath, crown molding throughout, 9 ft ceilings, NEW metal roof (5/6/2020) , TWO 24x26 metal garages/workshops with electric/water, 18x26 det. metal carport with 10k lb two post lift, open end stable for the horses, extra 15x20 metal storage/she-shed, open back deck with wheel chair ramp, NEW HVAC SYSTEM just installed (2/3/21) 3 power poles, 2 septics, 2 wells & slab for RV all on a paved road! Just minutes to dining, shopping, medical, Suwannee River with multiple boat ramps/springs and all the amenities that a small country town has to offer!
Key facts
- Shed
- Work shops
- Aluminum rv cover
Tags
Property features AI
Exterior
- Parking: Off-street parking
- Utilities: Private well water
- Home design: Residential mobile home
- Construction: Vinyl siding; Metal roof; Built on crawl space
- Exterior features: Level, wooded lot; Workshop; Pets allowed
Interior
- Kitchen: Refrigerator
- Flooring: Carpet; Vinyl
- Bathrooms: 2 full bathrooms
- Interior features: Walk-in closets; Crawl space basement
Neighborhood map
What this means for you Summary
Snapshot
- This is a 4-bed/2.0-bath manufactured listed at $220k.
Deal economics
- At list price, monthly cash flow is $-226 ($-3k/yr) — negative.
- To cash-flow at today's rent, offer at most $180k (18.1% below list).
- To meet the 1% rule (rent ≥ 1% of price), the offer needs to be $158k (28.3% below list).
- Recommended offer: $158k (28.3% below list) — sets the bar for 1% rule.
- Cap rate 5.1% vs local median 3.7% in Fanning Springs — top-decile yield for the area; either an underpriced asset or a hidden risk that comps aren't pricing in. Stress-test before assuming the spread holds.
Location & tenants
- Location reads 63/100 on livability (#739 in FL) — a middle-class / working-renter tenant base. Strengths: crime A+, cost of living A+, housing A+; Watch: health & safety D, amenities F, commute F.
- Dixie (rural): math 52% / reading 50% proficiency, ranked #36 of 73 in FL (top 49%) — acceptable for families but not a draw, mixed tenant base, ~2y average lease; 85% free/reduced lunch — lower-income household profile, screen leases tightly.
- Zoned schools: Old Town Elementary School (math 73% / reading 58%, grade B+, #500 of 2,144 statewide, top 24%, 456 students, 80% FRL); Ruth Rains Middle School (math 48% / reading 49%, grade C-, #274 of 571 statewide, top 50%, 431 students, 76% FRL); Dixie County High School (math 31% / reading 42%, grade F, #351 of 667 statewide, top 54%, 714 students, 70% FRL).
- Market conditions: 263 active listings in the ZIP; 49 units permitted in Dixie County in 2024 (0 in 5+ unit buildings).
Forward outlook
- In year one you build about $24k of equity ($2k loan paydown + $22k appreciation (10.0% local appreciation)).
- Dixie County population projected at -16% by 2050 — secular population decline; favor cash flow + early exit over multi-decade hold.
- By year 2, paydown + projected appreciation supports a ~$38k cash-out refi (75% LTV) — recoverable capital for the next deal without selling this one.
Negotiation context
- It's been on market 21 days — a 2% lower offer ($217k) is reasonable based on typical stale-listing flexibility.
- 2 sale attempts since 6y ago with the ask held roughly flat each time — persistent listings suggest the price (not the market) is what's stuck; bring a comps-based counter.
- Current owner paid $185k; 19% above their basis — modest negotiation headroom, anchor on the comps not their cost.
Risks & watch-outs
- Climate carrying-cost: severe wind risk, 99% chance of damaging wind over 30y; major wildfire risk; extreme-heat days projected 7→23/yr by 2055 (HVAC capex compounding) — expect insurance premiums to compound above CPI over the hold.
Questions for the listing agent
- What do current leases actually rent for vs. the listed asking? Can we see a recent rent roll and the last 12 months of T-12 income?
- Is there a deadline driving the sale (1031 exchange, divorce, estate, relocation)? That informs how much negotiation room exists.
- Schools are F-rated, which usually means shorter tenancies and higher turnover. Who's the typical renter profile here, and what's been the actual vacancy rate?
- The area grade is low — what's the realistic commute time and amenity access for the typical tenant pool here? Any planned neighborhood developments (good or bad) we should know about?
- What's the average days-on-market for RENTAL listings here right now (not sales)? A rising rental-DOM trend means longer vacancies and softer asking-rent achievability than the comps imply.
- What's the recent tenant-quality profile in this submarket — average credit score on applications, eviction rate, late-payment / NSF rate, and stable-employment percentage? A property-management company in the area should have these aggregated.
- How much new for-sale + rental construction is in the pipeline within 1–3 miles? Heavy new supply typically softens prices + rents 12–24 months out; constrained supply supports both.
Investment metrics
- 1% rule
- 0.72% ✗
- Cap rate
- 5.06%
- Cash-on-cash
- -4.40%
- DSCR
- 0.80
- GRM
- 11.6
CMA / ARV
No comps found within radius.
Projected returns pro-forma
10.0% appreciation · 3.0% rent growth · sell at horizon
- IRR
- 21.2%
- Equity multiple
- 2.71×
- Total profit
- $105,418
- Equity at exit
- $198,193
- IRR
- 19.1%
- Equity multiple
- 6.22×
- Total profit
- $321,744
- Equity at exit
- $427,412
Cash invested: $61,600 (down + closing). Projections, not guarantees.
Landlord ↔ Tenant lean methodology
- Overall (STATE)
- 87 Strongly Landlord-Friendly
- State Florida
- 87 Strongly Landlord-Friendly · R+3
- County
- — inherits STATE
- City
- — inherits STATE
ZIP-level market 32680
- Home prices YoY
- 2.5%
- Active inventory
- 263
- Price-to-rent
- 11.6×
Monthly cashflow live
- Estimated rent
- $1,576 medium interval (Pro) →
- Mortgage (P&I)
- −$1,154
- Tax from tax record
- −$226 /mo · $2,711/yr
- Insurance
- −$92
- HOA
- −$0
- Vacancy / Maint / Mgmt
- −$331
- Net cashflow
- $-226
Break-even live
Sensitivity live
| Price | -10% $-101 | -5% $-164 | +0% $-226 | +5% $-288 | +10% $-351 |
|---|---|---|---|---|---|
| Rent | -10% $-351 | -5% $-288 | +0% $-226 | +5% $-164 | +10% $-101 |
| Rate | -1.0pp $-115 | -0.5pp $-170 | base $-226 | +0.5pp $-283 | +1.0pp $-341 |
UW: 25.0% down · 7.5% · 30yr · 1.5% tax · 5.0% vac · 8.0% maint · 8.0% mgmt
Financing live
Cash to close
- Down payment
- $55,000
- Closing costs
- $6,600
- Reserves months
- —
- Total cash needed
- —
Loan-product check · same deal, 3 products live
Conventional
25% down · 7.5% · 30yr
- Down + closing
- —
- Monthly P&I
- —
- Monthly cashflow
- —
- DSCR
- —
- Eligible?
- —
Personal DTI + credit; lowest rate.
DSCR
20% down · 8.5% · 30yr
- Down + closing
- —
- Monthly P&I
- —
- Monthly cashflow
- —
- DSCR
- —
- Eligible?
- —
No personal income docs; deal must DSCR.
Hard money
10% down · 12.0% · 12mo
- Down + closing
- —
- Monthly P&I
- —
- Monthly cashflow
- —
- DSCR
- —
- Eligible?
- —
Short-term bridge; refi at stabilization.
Listing history 16 events
-
2026-06-22days on market $220,000 Active 21 DOM
-
2026-06-21days on market $220,000 Active 20 DOM
-
2026-06-21days on market $220,000 Active 19 DOM
-
2026-06-18days on market $220,000 Active 17 DOM
-
2026-06-17days on market $220,000 Active 16 DOM
-
2026-06-16days on market $220,000 Active 15 DOM
-
2026-06-15days on market $220,000 Active 14 DOM
-
2026-06-13days on market $220,000 Active 12 DOM
-
2026-06-12days on market $220,000 Active 11 DOM
-
2026-06-09days on market $220,000 Active 8 DOM
-
2026-06-08days on market $220,000 Active 7 DOM
-
2026-06-07days on market $220,000 Active 6 DOM
-
2026-06-07days on market $220,000 Active 5 DOM
-
2026-06-04days on market $220,000 Active 2 DOM
-
2026-06-02remarks 695-char remark
-
2026-06-02$220,000 Active 1 DOM
ⓘ Source: listings_history table (triggers on properties + properties_extension) + one-shot
backfill from property_details.listing_events for pre-trigger history.
Tax reassessment forecast FL · Resets to sale price
- Current annual tax
- $2,711 · $226/mo
- Projected year-2 tax
- $2,711 · $226/mo
- Expected delta
- $0/yr ($0/mo · 0.0%)
ⓘ Screening estimate from a state-policy table — verify with the county assessor before closing.
Climate risk First Street
- Flood 4/10 Moderate FEMA zone X (unshaded) · 23% chance over 30 yrs
- Wildfire 7/10 Severe
- Heat 9/10 Extreme 7 d/yr ≥107°F today · 23 d/yr by 30 yrs out
- Wind 9/10 Extreme 99% chance of damaging wind over 30 yrs
- Air quality 2/10 Low 1 unhealthy d/yr today · 2 by 30 yrs out
Nearby sold comps map
Loading sold comps map…
Walkable amenities ~0.75 mi
Loading nearby amenities…
Taxation est. · year 1
- Rental income
- $18,916
- − Mortgage interest
- −$12,323
- − Property taxes
- −$2,711
- − Insurance
- −$1,100
- − Repairs & maintenance
- −$1,513
- − Management
- −$1,513
- − Depreciation
- −$6,400
- Taxable loss
- −$6,645
- Est. tax savings @ 24.0%
- +$1,595
- After-tax cash flow
- $-1,117/yr
For passive investors: Depreciation is non-cash, so a rental often shows a tax loss while cash-flowing — sheltering income. Rental losses are passive: they offset passive income freely, and up to $25,000/yr can offset ordinary (W-2) income if you actively participate and your MAGI is under $100k (phasing out to $0 by $150k); unused losses carry forward. On sale, claimed depreciation is recaptured at up to 25%, and gains may owe capital-gains tax (a 1031 exchange can defer both). Figures are a year-1 estimate at your 24.0% rate — not tax advice; consult a CPA.
Schools (NCES district)
- District
- Dixie
- NCES district ID
- 1200450
- Math proficiency
- 52% ▼ -3.00%
- Reading proficiency
- 50% ▼ -4.00%
- Median HH income
- $34,799
- Composite
- 42.18/100
- National rank
- #3290
- State rank
- #36 of 73 in FL
Livability — Fanning Springs
- Score
- 63/100
- State rank
- #739
- US rank
- #15960
Category grades
Schools grade is shown separately in the Schools card above.
Census & demographics
- Population (ZIP)
- 10,445
Population outlook (Dixie County) Hauer SSP2
- Today (2025)
- 15,122 people
- By 2030
- 14,521 · -4.0%
- By 2040
- 13,503 · -10.7%
- By 2050
- 12,671 · -16.2%
- By 2075
- 10,857 · -28.2%
- By 2100
- 8,344 · -44.8%
Race, ethnicity, and origin ACS 2023
- Neighborhood character
- Predominantly White (94%)
- Race & ethnicity
- White 94% Two or more races 4% Hispanic / Latino 3% Black 1%
- Common ancestry
- Romanian 2% Slovak 1% Italian 1%
- Foreign-born
- 3% · Canada
- Languages at home
- 99% English-only · Spanish 1%
Political lean MEDSL · Dixie
- 2024 margin
- Solid R (+70.4) · D 14.5% · R 84.9%
- 2008→2024 swing
- -25.4pp toward R · 2008: -45.0pp · 2024: -70.4pp
- All cycles
- 2024: R+70.4 2020: R+66.0 2016: R+63.2 2012: R+46.9 2008: R+45.0
Not yet ingested
- Civics
- —
Market trends
- HPI YoY
- ▲ 10.22%
- Current HPI
- 424.0037
- Rent YoY
- —
- Metro
- —
- State GDP YoY
- ▲ 3.28%
- F500 in state
- 36
Industry mix (Fortune 500 HQ in FL)
| Industry | F500 HQs | Revenue |
|---|---|---|
| Industrial Technology | 2 | $29B |
|
||
| Insurance | 2 | $17B |
|
||
| Retail | 1 | $60B |
|
||
| Technology Distribution | 1 | $58B |
|
||
| Homebuilding | 1 | $35B |
|
||
| Technology Manufacturing | 1 | $35B |
|
||
Price history
+22.3% since first listed3 events — show timeline
- 2026-06-01 Listed $220,000 DGLMLS
- 2021-03-12 Sold (MLS) $185,000 DGLMLS
- 2020-10-08 Listed $179,900 DGLMLS
Property tax history
+15.4%/yrLatest (2025): $2,711 · +9.0% YoY. Source: county tax records.
Cash-flow waterfall
monthlySold comps — $/sqft
last 12 mo · ≤1 miLoading sold comps…