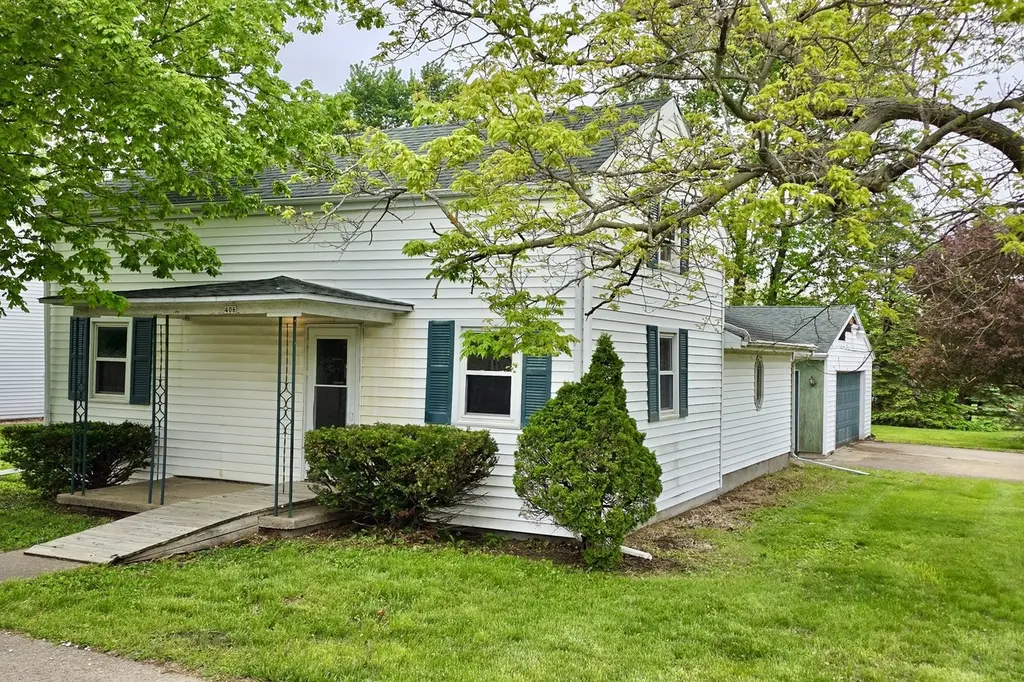
406 E North St · Danvers, IL
Flood risk 1/10 · Minimal
- FEMA flood zone
- X (unshaded)
- Chance of flooding over 30 yrs
- 0.0%
- Est. flood insurance / yr
- $507 – $1,088
Fire risk 1/10 · Minimal
- Est. fire insurance / yr
- $804 – $1,492
Heat risk 3/10 · Minor
- Hot days now (above 106°F)
- 7 days/yr
- Hot days in 30 yrs
- 18 days/yr
Wind risk 2/10 · Minimal
- Chance of severe wind over 30 yrs
- 1.0%
Air-quality risk 2/10 · Minimal
- Unhealthy air days now
- 1 days/yr
- Unhealthy air days in 30 yrs
- 2 days/yr
Risk factors via First Street. Map © Google.
Why this score? — see what drove the C grade
The composite is a weighted blend of 9 inputs, each scored 0–100. Each bar is that input's sub-score; the figure is the points it added to the 100-point composite (weight × sub-score).
- Cash flow +17.9/30.0
- ARV discount +15.0/15.0
- 1% rule +5.6/10.0
- DSCR +5.6/10.0
- Livability +3.5/5.0
- Schools +2.7/10.0
- Rent growth +2.5/5.0
- Condition / age +2.5/5.0
- Appreciation +0.0/10.0
$99,900
🖨 Deal sheet (PDF) 📄 Offer letter ✓ Due diligence
Listing remarks
Tons of potential in this 1.5 story on North street in Danvers. First floor primary and laundry. 2nd floor has 2 bedrooms. Oversized 2 car detached garage and large corner lot. This house needs some love and it will be back to it's truest potential. Danvers is just 6 miles from Bloomington. Visit Danvers Vault, Fast stop or the library in just minutes. Property being sold "as is" condition.
Key facts
- Large corner lot
- First floor primary
- 7,200 sq ft lot
Tags
Property features AI
Finance
- Other: Possession at closing; Earnest money is held
- Financial info: Special service area: No
- HOA & community: Master association fee not required
Exterior
- Parking: Detached garage providing 2 garage spaces (2 total parking spaces)
- Utilities: Public water; Public sewer
- Home design: Detached single-family home; 1.5-story design; Fee simple ownership; Property over 100 years old
- Construction: Aluminum siding; Approximately 954 total square feet (assessor); About 558 sq ft on main level and 396 sq ft upper level; Unfinished basement space (approximately 558); Built before 1978
- Exterior features: Lot dimensions approximately 60 x 120; Lot is less than 0.25 acre; Gated community feature
Interior
- Kitchen: Kitchen with eating area / table space
- Bedrooms: Three bedrooms (master and one bedroom on main level; two additional bedrooms on second level)
- Flooring: Carpet in living room and master bedroom; Laminate flooring in one upstairs bedroom; Linoleum in kitchen; Vinyl in utility room
- Bathrooms: One full bathroom
- Heating & cooling: Natural gas heating; Central air conditioning; Window air conditioning unit(s)
- Interior features: Five total rooms; Cellar basement
- Laundry & utility: Main-level laundry room / utility (approximately 5 x 10); Separate utility room on main level (approximately 5 x 15)
Neighborhood map
What this means for you Summary
Snapshot
- This is a 3-bed/1.0-bath single-family listed at $100k.
Deal economics
- At list price, monthly cash flow is $85 ($1k/yr) — positive.
- The deal already cash-flows at list — no discount required.
- Meets the 1% rule at list price ($1k rent vs $100k).
Location & tenants
- Location reads 69/100 on livability (#429 in IL) — a middle-class / working-renter tenant base. Strengths: crime A+, cost of living A+, housing A+; Watch: amenities F, commute F, health & safety F.
- Olympia CUSD 16 (rural): math 29% / reading 30% proficiency, ranked #237 of 620 in IL (top 38%) — low school quality limits family demand, transient renter base, plan for 1-2y turnover.
- Zoned schools: Olympia South Elem Sch (math 22% / reading 37%, grade F, #658 of 2,056 statewide, top 35%, 327 students, 0% FRL); Olympia Middle School (math 26% / reading 26%, grade F, #318 of 665 statewide, top 48%, 386 students, 0% FRL); Olympia High School (math 32% / reading 32%, grade F, #157 of 693 statewide, top 25%, 503 students, 0% FRL) — zoned schools average 0% FRL vs 30% district-wide (30 pts lower); this property's tenant base skews higher-income than the district average.
- Market conditions: 8 active listings in the ZIP; 247 units permitted in McLean County in 2024 (54 in 5+ unit buildings).
Forward outlook
- Local home prices are declining (-3.0%/yr); year-one equity from $691 of loan paydown is wiped out by about $3k of value loss. Plan a longer hold.
Negotiation context
- Only 10 days on market — expect competitive offers; lowballing is unlikely to land.
Risks & watch-outs
- Watch-outs: built in 1874 — expect roof / HVAC / electrical / plumbing capex.
Questions for the listing agent
- Built in 1874 — when were the roof, HVAC, electrical panel, plumbing, and water heater last replaced?
- Is there a deadline driving the sale (1031 exchange, divorce, estate, relocation)? That informs how much negotiation room exists.
- Schools are B-rated — typically a magnet for longer-tenancy family renters. What's the average tenant stay here, and is there a school-zone premium baked into asking?
- What's the average days-on-market for RENTAL listings here right now (not sales)? A rising rental-DOM trend means longer vacancies and softer asking-rent achievability than the comps imply.
- What's the recent tenant-quality profile in this submarket — average credit score on applications, eviction rate, late-payment / NSF rate, and stable-employment percentage? A property-management company in the area should have these aggregated.
- How much new for-sale + rental construction is in the pipeline within 1–3 miles? Heavy new supply typically softens prices + rents 12–24 months out; constrained supply supports both.
Investment metrics
- 1% rule
- 1.06% ✓
- Cap rate
- 7.31%
- Cash-on-cash
- 3.64%
- DSCR
- 1.16
- GRM
- 7.9
CMA / ARV
- ARV (median comp)
- $160,209
- List price
- $99,900
- Delta
- -37.64%
- Verdict
- UNDERPRICED
- Comps
- 13 within 1.0 mi
Show comp detail 2 sales within ~0.75 mi
| Address | Dist | Beds/Ba | Sqft | Sold | Price | $/sf | Match |
|---|---|---|---|---|---|---|---|
| 406 E North St | 0.00mi | 3/1.0 | 954 (0%) | 1mo | $112,000 | $117 | 99 |
| 112 W Columbia St | 0.30mi | 3/1.0 | 1,006 (+6%) | 14mo | $137,000 | $136 | 65 |
Match score weights: distance 35% · size 25% · config 20% · recency 20%. Top-matched comps best support the ARV.
Projected returns pro-forma
-3.0% appreciation · 3.0% rent growth · sell at horizon
- IRR
- -10.5%
- Equity multiple
- 0.62×
- Total profit
- $-10,738
- Equity at exit
- $14,895
- IRR
- -1.1%
- Equity multiple
- 0.92×
- Total profit
- $-2,190
- Equity at exit
- $8,638
Cash invested: $27,972 (down + closing). Projections, not guarantees.
Landlord ↔ Tenant lean methodology
- Overall (STATE)
- 43 Moderately Tenant-Leaning
- State Illinois
- 43 Moderately Tenant-Leaning · D+7
- County
- — inherits STATE
- City
- — inherits STATE
ZIP-level market 61732
- Home prices YoY
- -20.9%
- Active inventory
- 8
- Price-to-rent
- 7.9×
Monthly cashflow live
- Estimated rent
- $1,055 medium interval (Pro) →
- Mortgage (P&I)
- −$524
- Tax from tax record
- −$183 /mo · $2,199/yr
- Insurance
- −$42
- HOA
- −$0
- Vacancy / Maint / Mgmt
- −$222
- Net cashflow
- $85
Break-even live
Sensitivity live
| Price | -10% $141 | -5% $113 | +0% $85 | +5% $56 | +10% $28 |
|---|---|---|---|---|---|
| Rent | -10% $1 | -5% $43 | +0% $85 | +5% $126 | +10% $168 |
| Rate | -1.0pp $135 | -0.5pp $110 | base $85 | +0.5pp $59 | +1.0pp $33 |
UW: 25.0% down · 7.5% · 30yr · 1.5% tax · 5.0% vac · 8.0% maint · 8.0% mgmt
Financing live
Cash to close
- Down payment
- $24,975
- Closing costs
- $2,997
- Reserves months
- —
- Total cash needed
- —
Loan-product check · same deal, 3 products live
Conventional
25% down · 7.5% · 30yr
- Down + closing
- —
- Monthly P&I
- —
- Monthly cashflow
- —
- DSCR
- —
- Eligible?
- —
Personal DTI + credit; lowest rate.
DSCR
20% down · 8.5% · 30yr
- Down + closing
- —
- Monthly P&I
- —
- Monthly cashflow
- —
- DSCR
- —
- Eligible?
- —
No personal income docs; deal must DSCR.
Hard money
10% down · 12.0% · 12mo
- Down + closing
- —
- Monthly P&I
- —
- Monthly cashflow
- —
- DSCR
- —
- Eligible?
- —
Short-term bridge; refi at stabilization.
Listing history 5 events
-
2026-05-16status Pending 407-char remark
-
2026-05-12historical Contingent - No Showings 407-char remark
-
2026-05-05$99,900 Active 407-char remark
-
1995-10-01soldstatus $63,000
-
1994-02-01soldstatus $62,000
ⓘ Source: listings_history table (triggers on properties + properties_extension) + one-shot
backfill from property_details.listing_events for pre-trigger history.
Tax reassessment forecast IL · Partial reset (capped growth)
- Current annual tax
- $2,199 · $183/mo
- Projected year-2 tax
- $2,233 · $186/mo
- Expected delta
- +$34/yr (+$3/mo · 1.6%)
ⓘ Screening estimate from a state-policy table — verify with the county assessor before closing.
Climate risk First Street
- Flood 1/10 Low FEMA zone X (unshaded) · 0% chance over 30 yrs
- Wildfire 1/10 Low
- Heat 3/10 Moderate 7 d/yr ≥106°F today · 18 d/yr by 30 yrs out
- Wind 2/10 Low 100% chance of damaging wind over 30 yrs
- Air quality 2/10 Low 1 unhealthy d/yr today · 2 by 30 yrs out
Nearby sold comps map
Loading sold comps map…
Walkable amenities ~0.75 mi
Loading nearby amenities…
Taxation est. · year 1
- Rental income
- $12,661
- − Mortgage interest
- −$5,596
- − Property taxes
- −$2,199
- − Insurance
- −$500
- − Repairs & maintenance
- −$1,013
- − Management
- −$1,013
- − Depreciation
- −$2,906
- Taxable loss
- −$565
- Est. tax savings @ 24.0%
- +$136
- After-tax cash flow
- $1,153/yr
For passive investors: Depreciation is non-cash, so a rental often shows a tax loss while cash-flowing — sheltering income. Rental losses are passive: they offset passive income freely, and up to $25,000/yr can offset ordinary (W-2) income if you actively participate and your MAGI is under $100k (phasing out to $0 by $150k); unused losses carry forward. On sale, claimed depreciation is recaptured at up to 25%, and gains may owe capital-gains tax (a 1031 exchange can defer both). Figures are a year-1 estimate at your 24.0% rate — not tax advice; consult a CPA.
Schools (NCES district)
- District
- Olympia CUSD 16
- NCES district ID
- 1729890
- Math proficiency
- 29% ▼ -4.00%
- Reading proficiency
- 30% ▼ -4.00%
- Median HH income
- $62,002
- Composite
- 26.94/100
- National rank
- #7081
- State rank
- #237 of 620 in IL
Livability — Danvers
- Score
- 69/100
- State rank
- #429
- US rank
- #8804
Category grades
Schools grade is shown separately in the Schools card above.
Census & demographics
- Census place
- Danvers, IL
- Population (ZIP)
- 2,089
Population outlook (McLean County) Hauer SSP2
- Today (2025)
- 176,468 people
- By 2030
- 178,002 · +0.9%
- By 2040
- 178,592 · +1.2%
- By 2050
- 177,090 · +0.4%
- By 2075
- 173,224 · -1.8%
- By 2100
- 158,425 · -10.2%
Race, ethnicity, and origin ACS 2023
- Neighborhood character
- Predominantly White (91%)
- Race & ethnicity
- White 91% Two or more races 9%
- Common ancestry
- Romanian 6% Italian 5% Lithuanian 3%
- Foreign-born
- 0%
Political lean MEDSL · McLean
- 2024 margin
- Toss-up / Even · D 51.6% · R 46.8% · Other 1.6%
- 2008→2024 swing
- +3.7pp toward D · 2008: 1.2pp · 2024: 4.9pp
- All cycles
- 2024: D+4.9 2020: D+3.9 2016: R+1.5 2012: R+11.1 2008: D+1.2
Not yet ingested
- Civics
- —
Market trends
- HPI YoY
- ▼ -52.43%
- Current HPI
- 197.8062
- Rent YoY
- —
- Metro
- —
- State GDP YoY
- ▲ 1.59%
- F500 in state
- 60
Industry mix (Fortune 500 HQ in IL)
| Industry | F500 HQs | Revenue |
|---|---|---|
| Insurance | 4 | $201B |
|
||
| Consumer Goods | 4 | $87B |
|
||
| Industrial Machinery | 3 | $64B |
|
||
| Healthcare | 2 | $55B |
|
||
| Retail / Pharmacy | 1 | $148B |
|
||
| Agriculture / Food | 1 | $86B |
|
||
Price history
+80.6% since first listed6 events — show timeline
- 2026-05-29 Sold (MLS) $112,000 MRED as Distributed by MLS Grid
- 2026-05-16 Pending — MRED as Distributed by MLS Grid
- 2026-05-12 Contingent — MRED as Distributed by MLS Grid
- 2026-05-05 Listed $99,900 MRED as Distributed by MLS Grid
- 1995-10-01 Sold (Public Records) $63,000 Public Records
- 1994-02-01 Sold (Public Records) $62,000 Public Records
Property tax history
+4.1%/yrLatest (2024): $2,199 · +3.3% YoY. Source: county tax records.
Cash-flow waterfall
monthlySold comps — $/sqft
last 12 mo · ≤1 miLoading sold comps…