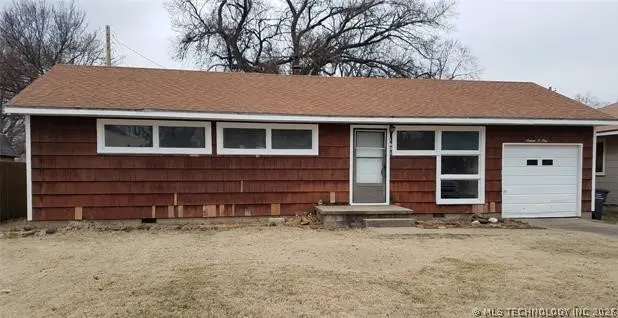
1601 Colorado Ave · Bartlesville, OK
Flood risk 1/10 · Minimal
- FEMA flood zone
- X (shaded)
- Chance of flooding over 30 yrs
- 0.0%
- Est. flood insurance / yr
- $507 – $1,088
Fire risk 8/10 · Major
- Est. fire insurance / yr
- $2,463 – $4,575
Heat risk 6/10 · Moderate
- Hot days now (above 113°F)
- 7 days/yr
- Hot days in 30 yrs
- 18 days/yr
Wind risk 2/10 · Minimal
- Chance of severe wind over 30 yrs
- 4.0%
Air-quality risk 2/10 · Minimal
- Unhealthy air days now
- 1 days/yr
- Unhealthy air days in 30 yrs
- 3 days/yr
Risk factors via First Street. Map © Google.
Why this score? — see what drove the B+ grade
The composite is a weighted blend of 9 inputs, each scored 0–100. Each bar is that input's sub-score; the figure is the points it added to the 100-point composite (weight × sub-score).
- Cash flow +30.0/30.0
- 1% rule +10.0/10.0
- DSCR +10.0/10.0
- Appreciation +10.0/10.0
- ARV discount +7.5/15.0
- Livability +3.2/5.0
- Schools +2.6/10.0
- Rent growth +2.5/5.0
- Condition / age +2.5/5.0
$38,000
🖨 Deal sheet (PDF) 📄 Offer letter ✓ Due diligence
Listing remarks MLS
FRESH INTERIOR PAINT.
Key facts
- 8,400 sq ft lot
- Garage
- Built 1954
Neighborhood map
What this means for you Summary
Snapshot
- This is a 3-bed/1.0-bath single-family listed at $38k.
Deal economics
- At list price, monthly cash flow is $703 ($8k/yr) — positive.
- The deal already cash-flows at list — no discount required.
- Meets the 1% rule at list price ($1k rent vs $38k).
- Cap rate 28.5% vs local median 4.7% in Bartlesville — top-decile yield for the area; either an underpriced asset or a hidden risk that comps aren't pricing in. Stress-test before assuming the spread holds.
Location & tenants
- Location reads 64/100 on livability (#175 in OK) — a middle-class / working-renter tenant base. Strengths: cost of living A+, housing A+; Watch: employment C-, crime D+, amenities F.
- Bartlesville (town): math 30% / reading 29% proficiency, ranked #59 of 270 in OK (top 22%) — low school quality limits family demand, transient renter base, plan for 1-2y turnover.
- Zoned schools: Jane Phillips Es (math 8% / reading 8%, grade F, #741 of 845 statewide, top 89%, 289 students, 0% FRL); Central Ms (math 29% / reading 29%, grade F, #55 of 345 statewide, top 16%, 671 students, 0% FRL); Bartlesville Hs (math 38% / reading 45%, grade F, #23 of 447 statewide, top 5%, 1,642 students, 0% FRL) — zoned schools average 0% FRL vs 43% district-wide (43 pts lower); this property's tenant base skews higher-income than the district average.
- Market conditions: 137 active listings in the ZIP; 1 comparable units currently listed for rent nearby; 46 units permitted in Washington County in 2024 (0 in 5+ unit buildings).
- This rent runs 31% of the median local income ($47k/yr) — at the standard rent-burdened threshold; future hikes will face affordability resistance.
Forward outlook
- In year one you build about $4k of equity ($263 loan paydown + $4k appreciation (10.0% local appreciation)).
- Washington County population projected at +12% by 2050 — modest demand growth; plan on rents tracking national, not racing it.
- At projected returns (10.0% appreciation + 3.0% rent growth), your $11k cash investment doubles in ~1 year — after that, you're playing with house money.
- By year 8, paydown + projected appreciation supports a ~$35k cash-out refi (75% LTV) — recoverable capital for the next deal without selling this one.
Negotiation context
- Only 0 days on market — expect competitive offers; lowballing is unlikely to land.
- 2 sale attempts since 6y ago with the ask held roughly flat each time — persistent listings suggest the price (not the market) is what's stuck; bring a comps-based counter.
Risks & watch-outs
- Watch-outs: built in 1954 — expect roof / HVAC / electrical / plumbing capex.
- Climate carrying-cost: severe wildfire risk; extreme-heat days projected 7→18/yr by 2055 (HVAC capex compounding) — expect insurance premiums to compound above CPI over the hold.
Questions for the listing agent
- Built in 1954 — when were the roof, HVAC, electrical panel, plumbing, and water heater last replaced?
- Is there a deadline driving the sale (1031 exchange, divorce, estate, relocation)? That informs how much negotiation room exists.
- Schools are D-rated, which usually means shorter tenancies and higher turnover. Who's the typical renter profile here, and what's been the actual vacancy rate?
- Crime grade is D in this area — have there been break-ins, vandalism, or insurance claims at this property in the last 3 years? What carrier currently insures it and at what premium?
- What's the average days-on-market for RENTAL listings here right now (not sales)? A rising rental-DOM trend means longer vacancies and softer asking-rent achievability than the comps imply.
- What's the recent tenant-quality profile in this submarket — average credit score on applications, eviction rate, late-payment / NSF rate, and stable-employment percentage? A property-management company in the area should have these aggregated.
- How much new for-sale + rental construction is in the pipeline within 1–3 miles? Heavy new supply typically softens prices + rents 12–24 months out; constrained supply supports both.
Investment metrics
- 1% rule
- 3.21% ✓
- Cap rate
- 28.48%
- Cash-on-cash
- 79.25%
- DSCR
- 4.53
- GRM
- 2.6
CMA / ARV
- ARV (on-the-fly)
- $95,550
- Comps found
- 12
Show comp detail 12 sales within ~0.75 mi
| Address | Dist | Beds/Ba | Sqft | Sold | Price | $/sf | Match |
|---|---|---|---|---|---|---|---|
| 1601 Colorado Ave | 0.00mi | 3/1.0 | 944 (-3%) | 0mo | $38,000 | $40 | 94 |
| 1623 SW Jennings | 0.57mi | 2/1.0 (-1) | 976 (+0%) | 1mo | $31,500 | $32 | 68 |
| 1424 S Penn Ave | 0.37mi | 3/1.0 | 1,016 (+4%) | 10mo | $106,950 | $105 | 67 |
| 1548 S Oak Ave | 0.36mi | 3/1.0 | 1,046 (+7%) | 10mo | $60,000 | $57 | 63 |
| 1569 S Elm | 0.22mi | 3/1.0 | 1,068 (+10%) | 15mo | $76,500 | $72 | 62 |
| 1554 S Oak Ave | 0.35mi | 2/1.0 (-1) | 860 (-12%) | 4mo | $65,000 | $76 | 56 |
| 1509 SW Elm Ave | 0.32mi | 3/2.0 | 1,056 (+8%) | 16mo | $162,500 | $154 | 54 |
| 1442 S Hickory Ave | 0.42mi | 3/1.0 | 1,076 (+10%) | 14mo | $105,000 | $98 | 51 |
| 1835 S Armstrong Ave | 0.56mi | 2/1.0 (-1) | 1,050 (+8%) | 7mo | $110,900 | $106 | 51 |
| 1446 S Hickory Ave | 0.41mi | 3/1.0 | 1,095 (+12%) | 12mo | $104,000 | $95 | 50 |
| 1642 S Oak Ave | 0.34mi | 2/1.0 (-1) | 840 (-14%) | 15mo | $105,000 | $125 | 44 |
| 1516 S Maple Ave | 0.44mi | 2/2.0 (-1) | 1,090 (+12%) | 16mo | $109,900 | $101 | 38 |
Match score weights: distance 35% · size 25% · config 20% · recency 20%. Top-matched comps best support the ARV.
Projected returns pro-forma
10.0% appreciation · 3.0% rent growth · sell at horizon
- IRR
- 89.3%
- Equity multiple
- 7.15×
- Total profit
- $65,464
- Equity at exit
- $34,233
- IRR
- 84.0%
- Equity multiple
- 15.81×
- Total profit
- $157,623
- Equity at exit
- $73,826
Cash invested: $10,640 (down + closing). Projections, not guarantees.
Landlord ↔ Tenant lean methodology
- Overall (STATE)
- 83 Strongly Landlord-Friendly
- State Oklahoma
- 83 Strongly Landlord-Friendly · R+20
- County
- — inherits STATE
- City
- — inherits STATE
ZIP-level market 74003
- Home prices YoY
- 5.0%
- Active inventory
- 137
- Price-to-rent
- 2.6×
Monthly cashflow live
- Estimated rent
- $1,219 medium interval (Pro) →
- Mortgage (P&I)
- −$199
- Tax from tax record
- −$45 /mo · $541/yr
- Insurance
- −$16
- HOA
- −$0
- Vacancy / Maint / Mgmt
- −$256
- Net cashflow
- $703
Break-even live
Sensitivity live
| Price | -10% $724 | -5% $713 | +0% $703 | +5% $692 | +10% $681 |
|---|---|---|---|---|---|
| Rent | -10% $606 | -5% $655 | +0% $703 | +5% $751 | +10% $799 |
| Rate | -1.0pp $722 | -0.5pp $712 | base $703 | +0.5pp $693 | +1.0pp $683 |
UW: 25.0% down · 7.5% · 30yr · 1.5% tax · 5.0% vac · 8.0% maint · 8.0% mgmt
Financing live
Cash to close
- Down payment
- $9,500
- Closing costs
- $1,140
- Reserves months
- —
- Total cash needed
- —
Loan-product check · same deal, 3 products live
Conventional
25% down · 7.5% · 30yr
- Down + closing
- —
- Monthly P&I
- —
- Monthly cashflow
- —
- DSCR
- —
- Eligible?
- —
Personal DTI + credit; lowest rate.
DSCR
20% down · 8.5% · 30yr
- Down + closing
- —
- Monthly P&I
- —
- Monthly cashflow
- —
- DSCR
- —
- Eligible?
- —
No personal income docs; deal must DSCR.
Hard money
10% down · 12.0% · 12mo
- Down + closing
- —
- Monthly P&I
- —
- Monthly cashflow
- —
- DSCR
- —
- Eligible?
- —
Short-term bridge; refi at stabilization.
Rent comps 1 comps
| Address | Beds | Baths | Sqft | Rent | $/sqft | DOM | Units | Dist |
|---|---|---|---|---|---|---|---|---|
| 821 S Johnstone Ave Bartlesville, OK | 1.0–2.0 | 1.0–2.0 | 888 | $1,521 | $1.71 | 25d | 1 | 1.10mi |
Listing history 2 events
-
2026-06-12remarks 61-char remark
-
2026-06-12$38,000 Pending
ⓘ Source: listings_history table (triggers on properties + properties_extension) + one-shot
backfill from property_details.listing_events for pre-trigger history.
Tax reassessment forecast OK · Resets to sale price
- Current annual tax
- $541 · $45/mo
- Projected year-2 tax
- $541 · $45/mo
- Expected delta
- $0/yr ($0/mo · 0.0%)
ⓘ Screening estimate from a state-policy table — verify with the county assessor before closing.
Climate risk First Street
- Flood 1/10 Low FEMA zone X (shaded) · 0% chance over 30 yrs
- Wildfire 8/10 Severe
- Heat 6/10 Major 7 d/yr ≥113°F today · 18 d/yr by 30 yrs out
- Wind 2/10 Low 4% chance of damaging wind over 30 yrs
- Air quality 2/10 Low 1 unhealthy d/yr today · 3 by 30 yrs out
Nearby sold comps map
Loading sold comps map…
Walkable amenities ~0.75 mi
Loading nearby amenities…
Taxation est. · year 1
- Rental income
- $14,625
- − Mortgage interest
- −$2,129
- − Property taxes
- −$541
- − Insurance
- −$190
- − Repairs & maintenance
- −$1,170
- − Management
- −$1,170
- − Depreciation
- −$1,105
- Taxable income
- $8,320
- Est. tax owed @ 24.0%
- −$1,997
- After-tax cash flow
- $6,435/yr
For passive investors: Depreciation is non-cash, so a rental often shows a tax loss while cash-flowing — sheltering income. Rental losses are passive: they offset passive income freely, and up to $25,000/yr can offset ordinary (W-2) income if you actively participate and your MAGI is under $100k (phasing out to $0 by $150k); unused losses carry forward. On sale, claimed depreciation is recaptured at up to 25%, and gains may owe capital-gains tax (a 1031 exchange can defer both). Figures are a year-1 estimate at your 24.0% rate — not tax advice; consult a CPA.
Schools (NCES district)
- District
- Bartlesville
- NCES district ID
- 4003630
- Math proficiency
- 30% ▼ -13.00%
- Reading proficiency
- 29% ▼ -10.00%
- Median HH income
- $48,889
- Composite
- 25.69/100
- National rank
- #7389
- State rank
- #59 of 270 in OK
Livability — Bartlesville
- Score
- 64/100
- State rank
- #175
- US rank
- #13940
Category grades
Schools grade is shown separately in the Schools card above.
Census & demographics
- Census place
- Bartlesville, OK
- County
- Washington County · 41,935 people
- City population
- 41,935
- Metro
- Bartlesville, OK
- Population (ZIP)
- 14,024
- Household income
- $47,168
- Rent vs Own
- Severe rent burden
- 395.0
Population outlook (Washington County) Hauer SSP2
- Today (2025)
- 54,946 people
- By 2030
- 56,249 · +2.4%
- By 2040
- 58,867 · +7.1%
- By 2050
- 61,600 · +12.1%
- By 2075
- 69,355 · +26.2%
- By 2100
- 73,067 · +33.0%
Race, ethnicity, and origin ACS 2023
- Neighborhood character
- Predominantly White (69%)
- Race & ethnicity
- White 69% Two or more races 14% Hispanic / Latino 7% Native American 7% Black 4%
- Hispanic origin (detail)
- Mexican 6%
- Common ancestry
- Slovak 2% Lithuanian 2% Italian 2%
- Foreign-born
- 2% · Canada
- Languages at home
- 96% English-only · Spanish 4%
Political lean MEDSL · Washington
- 2024 margin
- Solid R (+47.6) · D 25.0% · R 72.7% · Other 2.4%
- 2008→2024 swing
- -3.1pp toward R · 2008: -44.6pp · 2024: -47.6pp
- All cycles
- 2024: R+47.6 2020: R+48.0 2016: R+48.5 2012: R+47.8 2008: R+44.6
Not yet ingested
- Civics
- —
Market trends
- HPI YoY
- ▲ 14.78%
- Current HPI
- 309.9534
- Rent YoY
- —
- Metro
- Bartlesville, OK
- State GDP YoY
- ▲ 1.55%
- F500 in state
- 6
Industry mix (Fortune 500 HQ in OK)
| Industry | F500 HQs | Revenue |
|---|---|---|
| Energy | 3 | $48B |
|
||
Price history
-9.5% since first listed5 events — show timeline
- 2026-06-09 Listing Removed — MLS Technology, Inc.
- 2026-06-09 Listed $38,000 MLS Technology, Inc.
- 2020-10-02 Sold (MLS) $35,000 MLS Technology, Inc.
- 2020-08-31 Pending — MLS Technology, Inc.
- 2020-04-28 Listed $42,000 MLS Technology, Inc.
Property tax history
+6.0%/yrLatest (2025): $541 · +1.9% YoY. Source: county tax records.
Cash-flow waterfall
monthlySold comps — $/sqft
last 12 mo · ≤1 miLoading sold comps…