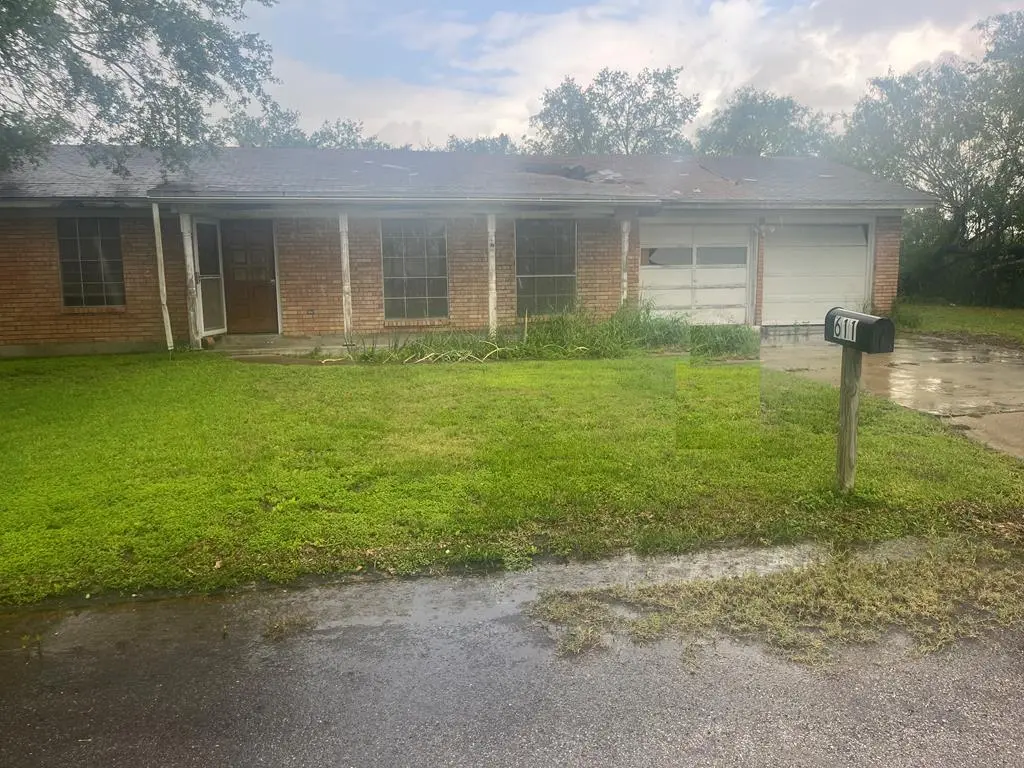
611 Montclair St · Refugio, TX
Flood risk 1/10 · Minimal
- FEMA flood zone
- X (unshaded)
- Chance of flooding over 30 yrs
- 0.0%
- Est. flood insurance / yr
- $507 – $1,088
Fire risk 3/10 · Minor
- Est. fire insurance / yr
- $1,222 – $2,270
Heat risk 9/10 · Severe
- Hot days now (above 109°F)
- 7 days/yr
- Hot days in 30 yrs
- 23 days/yr
Wind risk 9/10 · Severe
- Chance of severe wind over 30 yrs
- 99.0%
Air-quality risk 1/10 · Minimal
- Unhealthy air days now
- 0 days/yr
- Unhealthy air days in 30 yrs
- 0 days/yr
Risk factors via First Street. Map © Google.
Why this score? — see what drove the C grade
The composite is a weighted blend of 9 inputs, each scored 0–100. Each bar is that input's sub-score; the figure is the points it added to the 100-point composite (weight × sub-score).
- Cash flow +15.0/30.0
- ARV discount +15.0/15.0
- 1% rule +5.0/10.0
- DSCR +5.0/10.0
- Appreciation +3.9/10.0
- Livability +3.6/5.0
- Schools +3.2/10.0
- Rent growth +2.5/5.0
- Condition / age +2.5/5.0
$27,500
🖨 Deal sheet 📄 Offer letter ✓ Due diligence
Listing remarks
Said property has been damaged and consumed extensively by fire therefore is not livable and should not to be occupied as a residence.
Key facts
- 0.24 acre lot
- 2 garage spots
- Built 1963
Property features AI
Exterior
- Parking: Attached 2-car garage; 2 total parking spaces (2 covered)
- Utilities: No utilities listed
- Home design: Single family residence; One level
- Construction: Brick veneer construction; Composition roof; Slab foundation; Built as residential single family
- Exterior features: Other exterior features; Interior lot
Interior
- Flooring: Concrete flooring
- Bathrooms: 2 full bathrooms
- Heating & cooling: No heating; No cooling
- Interior features: Other interior features
Neighborhood map
What this means for you Summary
Snapshot
- This is a 3-bed/2.0-bath single-family listed at $28k.
Deal economics
- At list price, monthly cash flow is $718 ($9k/yr) — positive.
- The deal already cash-flows at list — no discount required.
- Meets the 1% rule at list price ($1k rent vs $28k).
Location & tenants
- Location reads 72/100 on livability (#255 in TX) — a middle-class / working-renter tenant base. Strengths: cost of living A+, housing A+, health & safety A+; Watch: schools D-, amenities F, commute F.
- Refugio ISD (town): math 38% / reading 38% proficiency, ranked #455 of 826 in TX (top 55%) — families likely to look elsewhere, expect single-tenant / working-renter base with shorter leases; 63% free/reduced lunch — lower-income household profile, screen leases tightly.
- Market conditions: 37 active listings in the ZIP; 1 comparable units currently listed for rent nearby; 24 units permitted in Refugio County in 2024 (0 in 5+ unit buildings).
Forward outlook
- Local home prices are declining (-2.2%/yr); year-one equity from $190 of loan paydown is wiped out by about $604 of value loss. Plan a longer hold.
- Refugio County population projected at +9% by 2050 — modest demand growth; plan on rents tracking national, not racing it.
- At projected returns (-2.2% appreciation + 3.0% rent growth), your $8k cash investment doubles in ~1 year — after that, you're playing with house money.
Negotiation context
- Only 11 days on market — expect competitive offers; lowballing is unlikely to land.
Risks & watch-outs
- Climate carrying-cost: severe wind risk, 99% chance of damaging wind over 30y; extreme-heat days projected 7→23/yr by 2055 (HVAC capex compounding) — expect insurance premiums to compound above CPI over the hold.
Questions for the listing agent
- Built in 1963 — when were the roof, HVAC, electrical panel, plumbing, and water heater last replaced?
- Is there a deadline driving the sale (1031 exchange, divorce, estate, relocation)? That informs how much negotiation room exists.
- Schools are D-rated, which usually means shorter tenancies and higher turnover. Who's the typical renter profile here, and what's been the actual vacancy rate?
- What's the average days-on-market for RENTAL listings here right now (not sales)? A rising rental-DOM trend means longer vacancies and softer asking-rent achievability than the comps imply.
- What's the recent tenant-quality profile in this submarket — average credit score on applications, eviction rate, late-payment / NSF rate, and stable-employment percentage? A property-management company in the area should have these aggregated.
- How much new for-sale + rental construction is in the pipeline within 1–3 miles? Heavy new supply typically softens prices + rents 12–24 months out; constrained supply supports both.
Investment metrics
- 1% rule
- 4.18% ✓
- Cap rate
- 37.64%
- Cash-on-cash
- 111.97%
- DSCR
- 5.98
- GRM
- 2.0
CMA / ARV
- ARV (on-the-fly)
- $50,526
- Comps found
- 7
Show comp detail 7 sales within ~0.75 mi
| Address | Dist | Beds/Ba | Sqft | Sold | Price | $/sf | Match |
|---|---|---|---|---|---|---|---|
| 707 Tallow | 0.28mi | 3/2.0 | 1,337 (+11%) | 0mo | $210,000 | $157 | 68 |
| 210 Swift St | 0.53mi | 2/1.0 (-1) | 1,152 (-4%) | 12mo | $99,900 | $87 | 50 |
| 505 W Heard St | 0.32mi | 3/1.0 | 1,041 (-14%) | 13mo | $70,000 | $67 | 48 |
| 512 N Alamo St | 0.55mi | 3/2.0 | 1,296 (+8%) | 22mo | $42,500 | $33 | 43 |
| 512 N Alamo St Unit A | 0.55mi | 3/2.0 | 1,296 (+8%) | 22mo | $42,500 | $33 | 43 |
| 214 Dunbar St | 0.63mi | 3/2.0 | 1,364 (+13%) | 9mo | $45,000 | $33 | 41 |
| 406 W Commons St | 0.65mi | 2/1.0 (-1) | 1,088 (-10%) | 14mo | $45,900 | $42 | 33 |
Match score weights: distance 35% · size 25% · config 20% · recency 20%. Top-matched comps best support the ARV.
Projected returns pro-forma
-2.2% appreciation · 3.0% rent growth · sell at horizon
- IRR
- —
- Equity multiple
- 6.49×
- Total profit
- $42,255
- Equity at exit
- $5,095
- IRR
- —
- Equity multiple
- 13.55×
- Total profit
- $96,613
- Equity at exit
- $4,123
Cash invested: $7,700 (down + closing). Projections, not guarantees.
Landlord ↔ Tenant lean methodology
- Overall (STATE)
- 87 Strongly Landlord-Friendly
- State Texas
- 87 Strongly Landlord-Friendly · R+5
- County
- — inherits STATE
- City
- — inherits STATE
ZIP-level market 78377
- Home prices YoY
- -1.5%
- Active inventory
- 37
- Price-to-rent
- 2.0×
Monthly cashflow live
- Estimated rent
- $1,150 medium interval (Pro) →
- Mortgage (P&I)
- −$144
- Tax est. 1.5%
- −$34 /mo · $412/yr
- Insurance
- −$11
- HOA
- −$0
- Vacancy / Maint / Mgmt
- −$242
- Net cashflow
- $718
Break-even live
UW: 25.0% down · 7.5% · 30yr · 1.5% tax · 5.0% vac · 8.0% maint · 8.0% mgmt
Financing live
Cash to close
- Down payment
- $6,875
- Closing costs
- $825
- Reserves months
- —
- Total cash needed
- —
Loan-product check · same deal, 3 products live
Conventional
25% down · 7.5% · 30yr
- Down + closing
- —
- Monthly P&I
- —
- Monthly cashflow
- —
- DSCR
- —
- Eligible?
- —
Personal DTI + credit; lowest rate.
DSCR
20% down · 8.5% · 30yr
- Down + closing
- —
- Monthly P&I
- —
- Monthly cashflow
- —
- DSCR
- —
- Eligible?
- —
No personal income docs; deal must DSCR.
Hard money
10% down · 12.0% · 12mo
- Down + closing
- —
- Monthly P&I
- —
- Monthly cashflow
- —
- DSCR
- —
- Eligible?
- —
Short-term bridge; refi at stabilization.
Rent comps 1 comps
| Address | Beds | Baths | Sqft | Rent | $/sqft | DOM | Units | Dist |
|---|---|---|---|---|---|---|---|---|
| 507 E Commons St Refugio, TX | 2.0 | 1.0 | 736 | $1,150 | $1.56 | 44d | 1 | 1.06mi |
Listing history 9 events
-
2026-06-19days on market $27,500 Active 11 DOM
-
2026-06-18days on market $27,500 Active 10 DOM
-
2026-06-17days on market $27,500 Active 9 DOM
-
2026-06-16days on market $27,500 Active 8 DOM
-
2026-06-15days on market $27,500 Active 7 DOM
-
2026-06-14days on market $27,500 Active 5 DOM
-
2026-06-12days on market $27,500 Active 4 DOM
-
2026-06-09remarks 134-char remark
-
2026-06-09$27,500 Active 1 DOM
ⓘ Source: listings_history table (triggers on properties + properties_extension) + one-shot
backfill from property_details.listing_events for pre-trigger history.
Climate risk First Street
- Flood 1/10 Low FEMA zone X (unshaded) · 0% chance over 30 yrs
- Wildfire 3/10 Moderate
- Heat 9/10 Extreme 7 d/yr ≥109°F today · 23 d/yr by 30 yrs out
- Wind 9/10 Extreme 99% chance of damaging wind over 30 yrs
- Air quality 1/10 Low 0 unhealthy d/yr today · 0 by 30 yrs out
Nearby sold comps map
Loading sold comps map…
Walkable amenities ~0.75 mi
Loading nearby amenities…
Taxation est. · year 1
- Rental income
- $13,800
- − Mortgage interest
- −$1,540
- − Property taxes
- −$412
- − Insurance
- −$138
- − Repairs & maintenance
- −$1,104
- − Management
- −$1,104
- − Depreciation
- −$800
- Taxable income
- $8,702
- Est. tax owed @ 24.0%
- −$2,088
- After-tax cash flow
- $6,533/yr
For passive investors: Depreciation is non-cash, so a rental often shows a tax loss while cash-flowing — sheltering income. Rental losses are passive: they offset passive income freely, and up to $25,000/yr can offset ordinary (W-2) income if you actively participate and your MAGI is under $100k (phasing out to $0 by $150k); unused losses carry forward. On sale, claimed depreciation is recaptured at up to 25%, and gains may owe capital-gains tax (a 1031 exchange can defer both). Figures are a year-1 estimate at your 24.0% rate — not tax advice; consult a CPA.
Schools (NCES district)
- District
- Refugio ISD
- NCES district ID
- 4836780
- Math proficiency
- 38% ▼ -8.00%
- Reading proficiency
- 38% ▲ 2.00%
- Median HH income
- $46,181
- Composite
- 32.48/100
- National rank
- #5712
- State rank
- #455 of 826 in TX
Livability — Refugio
- Score
- 72/100
- State rank
- #255
- US rank
- #6003
Category grades
Schools grade is shown separately in the Schools card above.
Census & demographics
- Census place
- Refugio, TX
- Population (ZIP)
- 3,376
Population outlook (Refugio County) Hauer SSP2
- Today (2025)
- 7,573 people
- By 2030
- 7,665 · +1.2%
- By 2040
- 7,895 · +4.3%
- By 2050
- 8,234 · +8.7%
- By 2075
- 9,521 · +25.7%
- By 2100
- 10,148 · +34.0%
Race, ethnicity, and origin ACS 2023
- Neighborhood character
- Diverse neighborhood (Simpson 0.60)
- Race & ethnicity
- Hispanic / Latino 51% White 35% Two or more races 25% Black 11%
- Hispanic origin (detail)
- Mexican 48%
- Common ancestry
- Iranian 2% Lithuanian 1%
- Foreign-born
- 3% · Canada
- Languages at home
- 75% English-only · Spanish 24%
Political lean MEDSL · Refugio
- 2024 margin
- Solid R (+39.5) · D 29.9% · R 69.5%
- 2008→2024 swing
- -25.0pp toward R · 2008: -14.5pp · 2024: -39.5pp
- All cycles
- 2024: R+39.5 2020: R+32.7 2016: R+27.0 2012: R+24.7 2008: R+14.5
Not yet ingested
- Civics
- —
Market trends
- HPI YoY
- ▼ -2.20%
- Current HPI
- 142.4929
- Rent YoY
- —
- Metro
- —
- State GDP YoY
- ▲ 3.95%
- F500 in state
- 110
Industry mix (Fortune 500 HQ in TX)
| Industry | F500 HQs | Revenue |
|---|---|---|
| Energy | 16 | $1,198B |
|
||
| Technology | 5 | $198B |
|
||
| Engineering / Construction | 4 | $72B |
|
||
| Energy Services | 3 | $60B |
|
||
| Utilities | 3 | $41B |
|
||
| Healthcare | 2 | $330B |
|
||
Price history
5 events — show timeline
- 2026-06-05 Listed $27,500 RAAR
- 2017-09-20 Sold (Public Records) — Public Records
- 1975-05-27 Sold (Public Records) — Public Records
- 1963-06-25 Sold (Public Records) — Public Records
- 1963-03-26 Sold (Public Records) — Public Records
Property tax history
+7.2%/yrLatest (2025): $4,052 · +4.1% YoY. Source: county tax records.
Cash-flow waterfall
monthlySold comps — $/sqft
last 12 mo · ≤1 miLoading sold comps…