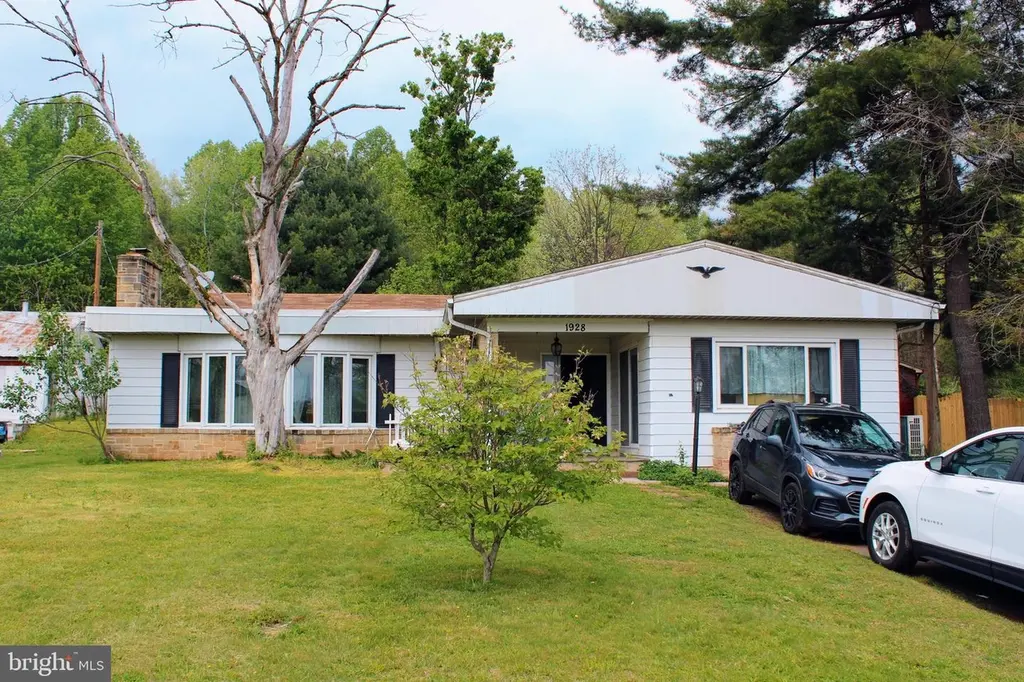
1928 New Bloomfield Rd · Wheatfield, PA
Flood risk 1/10 · Minimal
- FEMA flood zone
- X (unshaded)
- Chance of flooding over 30 yrs
- 0.0%
- Est. flood insurance / yr
- $507 – $1,088
Fire risk 3/10 · Minor
- Est. fire insurance / yr
- $511 – $949
Heat risk 4/10 · Minor
- Hot days now (above 100°F)
- 7 days/yr
- Hot days in 30 yrs
- 15 days/yr
Wind risk 2/10 · Minimal
- Chance of severe wind over 30 yrs
- 3.0%
Air-quality risk 2/10 · Minimal
- Unhealthy air days now
- 1 days/yr
- Unhealthy air days in 30 yrs
- 1 days/yr
Risk factors via First Street. Map © Google.
Why this score? — see what drove the D grade
The composite is a weighted blend of 9 inputs, each scored 0–100. Each bar is that input's sub-score; the figure is the points it added to the 100-point composite (weight × sub-score).
- ARV discount +15.0/15.0
- Cash flow +9.9/30.0
- Schools +3.8/10.0
- DSCR +2.8/10.0
- 1% rule +2.6/10.0
- Rent growth +2.5/5.0
- Livability +2.5/5.0
- Condition / age +2.5/5.0
- Appreciation +0.0/10.0
$249,900
🖨 Deal sheet 📄 Offer letter ✓ Due diligence
Listing remarks MLS
This is a perfect project. Nice floor plan. Very large garage. L-Shaped lot. Inground pool (requires repairs). Nice country setting with a great view.
Key facts
- Surrounding decking
- Large garage
- Above ground pool
Tags
Property features AI
Exterior
- Parking: Detached oversized garage with 3 garage spaces; Driveway parking for 2 vehicles; Total of 5 garage/parking spaces; Dirt driveway
- Utilities: 200+ amp electrical service with circuit breakers; Hot water: oil; Heating fuel: electric and oil; Cooling fuel: electric; Water: private well; Sewer: on-site septic
- Home design: Detached structure; Shingle roof; Crawl space foundation; Fee simple ownership
- Construction: Stone and vinyl siding exterior; Built year (assessor source)
- Exterior features: Deck(s); Outbuilding(s); Above-ground personal pool
Interior
- Kitchen: Pellet stove
- Bedrooms: Three main-level bedrooms
- Flooring: Hardwood; Laminate; Partially carpeted
- Bathrooms: One full bathroom; One half bathroom (main level)
- Heating & cooling: Forced air heating; Other heating sources (oil and electric listed separately); Central A/C; Ductless / mini-split; Window unit(s)
- Interior features: Soaking tub; Stove - pellet; Wood floors; Level entry main
Neighborhood map
What this means for you Summary
Snapshot
- This is a 3-bed/1.5-bath single-family listed at $250k.
Deal economics
- At list price, monthly cash flow is $-155 ($-2k/yr) — negative.
- To cash-flow at today's rent, offer at most $223k (10.9% below list).
- To meet the 1% rule (rent ≥ 1% of price), the offer needs to be $190k (23.8% below list).
- Recommended offer: $190k (23.8% below list) — sets the bar for 1% rule.
Location & tenants
- Location reads: area grade D — affects rentability + tenant quality, not the cash-flow math above.
- Susquenita SD (rural): math 34% / reading 53% proficiency, ranked #275 of 539 in PA (top 51%) — families likely to look elsewhere, expect single-tenant / working-renter base with shorter leases.
- Zoned schools: Susquenita Hs (math 64%, 503 students, 31% FRL) — zoned schools at 31% FRL track the district average.
- Market conditions: 19 active listings in the ZIP; 107 units permitted in Perry County in 2024 (0 in 5+ unit buildings).
Forward outlook
- Local home prices are declining (-3.0%/yr); year-one equity from $2k of loan paydown is wiped out by about $7k of value loss. Plan a longer hold.
- Perry County population projected at -19% by 2050 — secular population decline; favor cash flow + early exit over multi-decade hold.
Negotiation context
- It's been on market 41 days — a 3% lower offer ($242k) is reasonable based on typical stale-listing flexibility.
- 3 sale attempts since 16y ago with the ask held roughly flat each time — persistent listings suggest the price (not the market) is what's stuck; bring a comps-based counter.
- Current owner paid $140k; list at $250k implies a 78% gain — meaningful room to come down on a strong offer.
Risks & watch-outs
- Watch-outs: built in 1945 — expect roof / HVAC / electrical / plumbing capex.
Questions for the listing agent
- What do current leases actually rent for vs. the listed asking? Can we see a recent rent roll and the last 12 months of T-12 income?
- It's been on market 41 days. Have you received any prior offers? Is the seller open to a 24% concession, seller financing, or rate buy-down credit?
- Built in 1945 — when were the roof, HVAC, electrical panel, plumbing, and water heater last replaced?
- Is there a deadline driving the sale (1031 exchange, divorce, estate, relocation)? That informs how much negotiation room exists.
- The area grade is low — what's the realistic commute time and amenity access for the typical tenant pool here? Any planned neighborhood developments (good or bad) we should know about?
- What's the average days-on-market for RENTAL listings here right now (not sales)? A rising rental-DOM trend means longer vacancies and softer asking-rent achievability than the comps imply.
- What's the recent tenant-quality profile in this submarket — average credit score on applications, eviction rate, late-payment / NSF rate, and stable-employment percentage? A property-management company in the area should have these aggregated.
- How much new for-sale + rental construction is in the pipeline within 1–3 miles? Heavy new supply typically softens prices + rents 12–24 months out; constrained supply supports both.
Investment metrics
- 1% rule
- 0.76% ✗
- Cap rate
- 5.55%
- Cash-on-cash
- -2.65%
- DSCR
- 0.88
- GRM
- 10.9
CMA / ARV
- ARV (median comp)
- $326,573
- List price
- $249,900
- Delta
- -23.48%
- Verdict
- UNDERPRICED
- Comps
- 2 within 1.0 mi
Projected returns pro-forma
-3.0% appreciation · 3.0% rent growth · sell at horizon
- IRR
- -20.7%
- Equity multiple
- 0.28×
- Total profit
- $-50,363
- Equity at exit
- $37,261
- IRR
- -14.0%
- Equity multiple
- 0.19×
- Total profit
- $-56,601
- Equity at exit
- $21,607
Cash invested: $69,972 (down + closing). Projections, not guarantees.
Landlord ↔ Tenant lean methodology
- Overall (STATE)
- 62 Landlord-Friendly
- State Pennsylvania
- 62 Landlord-Friendly · EVEN
- County
- — inherits STATE
- City
- — inherits STATE
ZIP-level market 17068
- Home prices YoY
- -14.6%
- Active inventory
- 19
- Price-to-rent
- 10.9×
Monthly cashflow live
- Estimated rent
- $1,903 medium interval (Pro) →
- Mortgage (P&I)
- −$1,311
- Tax from tax record
- −$244 /mo · $2,924/yr
- Insurance
- −$104
- HOA
- −$0
- Vacancy / Maint / Mgmt
- −$400
- Net cashflow
- $-155
Break-even live
UW: 25.0% down · 7.5% · 30yr · 1.5% tax · 5.0% vac · 8.0% maint · 8.0% mgmt
Financing live
Cash to close
- Down payment
- $62,475
- Closing costs
- $7,497
- Reserves months
- —
- Total cash needed
- —
Loan-product check · same deal, 3 products live
Conventional
25% down · 7.5% · 30yr
- Down + closing
- —
- Monthly P&I
- —
- Monthly cashflow
- —
- DSCR
- —
- Eligible?
- —
Personal DTI + credit; lowest rate.
DSCR
20% down · 8.5% · 30yr
- Down + closing
- —
- Monthly P&I
- —
- Monthly cashflow
- —
- DSCR
- —
- Eligible?
- —
No personal income docs; deal must DSCR.
Hard money
10% down · 12.0% · 12mo
- Down + closing
- —
- Monthly P&I
- —
- Monthly cashflow
- —
- DSCR
- —
- Eligible?
- —
Short-term bridge; refi at stabilization.
Listing history 25 events
-
2026-06-18days on market $249,900 Active 41 DOM
-
2026-06-17days on market $249,900 Active 40 DOM
-
2026-06-16days on market $249,900 Active 39 DOM
-
2026-06-15days on market $249,900 Active 38 DOM
-
2026-06-14days on market $249,900 Active 36 DOM
-
2026-06-13days on market $249,900 Active 35 DOM
-
2026-06-10days on market $249,900 Active 33 DOM
-
2026-06-09days on market $249,900 Active 32 DOM
-
2026-06-08days on market $249,900 Active 31 DOM
-
2026-06-07days on market $249,900 Active 30 DOM
-
2026-06-05days on market $249,900 Active 27 DOM
-
2026-06-03days on market $249,900 Active 26 DOM
-
2026-06-02days on market $249,900 Active 25 DOM
-
2026-06-01days on market $249,900 Active 24 DOM
-
2026-05-31days on market $249,900 Active 23 DOM
-
2026-05-31days on market $249,900 Active 22 DOM
-
2026-05-08$249,900 Active 673-char remark
-
2015-10-29soldstatus $140,000
-
2012-03-27historical
-
2011-09-27$149,900
-
2011-04-04soldstatus $57,000
Show marketing remark (150 chars)
This is a perfect project. Nice floor plan. Very large garage. L-Shaped lot. Inground pool (requires repairs). Nice country setting with a great view.
-
2011-03-20historical
Show marketing remark (150 chars)
This is a perfect project. Nice floor plan. Very large garage. L-Shaped lot. Inground pool (requires repairs). Nice country setting with a great view.
-
2010-08-26$59,900
Show marketing remark (150 chars)
This is a perfect project. Nice floor plan. Very large garage. L-Shaped lot. Inground pool (requires repairs). Nice country setting with a great view.
-
2003-01-21soldstatus $139,900
-
1998-10-29soldstatus $116,000
ⓘ Source: listings_history table (triggers on properties + properties_extension) + one-shot
backfill from property_details.listing_events for pre-trigger history.
Tax reassessment forecast PA · Partial reset (capped growth)
- Current annual tax
- $2,924 · $244/mo
- Projected year-2 tax
- $3,436 · $286/mo
- Expected delta
- +$512/yr (+$43/mo · 17.5%)
ⓘ Screening estimate from a state-policy table — verify with the county assessor before closing.
Climate risk First Street
- Flood 1/10 Low FEMA zone X (unshaded) · 0% chance over 30 yrs
- Wildfire 3/10 Moderate
- Heat 4/10 Moderate 7 d/yr ≥100°F today · 15 d/yr by 30 yrs out
- Wind 2/10 Low 3% chance of damaging wind over 30 yrs
- Air quality 2/10 Low 1 unhealthy d/yr today · 1 by 30 yrs out
Nearby sold comps map
Loading sold comps map…
Walkable amenities ~0.75 mi
Loading nearby amenities…
Taxation est. · year 1
- Rental income
- $22,839
- − Mortgage interest
- −$13,998
- − Property taxes
- −$2,924
- − Insurance
- −$1,250
- − Repairs & maintenance
- −$1,827
- − Management
- −$1,827
- − Depreciation
- −$7,270
- Taxable loss
- −$6,257
- Est. tax savings @ 24.0%
- +$1,502
- After-tax cash flow
- $-355/yr
For passive investors: Depreciation is non-cash, so a rental often shows a tax loss while cash-flowing — sheltering income. Rental losses are passive: they offset passive income freely, and up to $25,000/yr can offset ordinary (W-2) income if you actively participate and your MAGI is under $100k (phasing out to $0 by $150k); unused losses carry forward. On sale, claimed depreciation is recaptured at up to 25%, and gains may owe capital-gains tax (a 1031 exchange can defer both). Figures are a year-1 estimate at your 24.0% rate — not tax advice; consult a CPA.
Schools (NCES district)
- District
- Susquenita SD
- NCES district ID
- 4223040
- Math proficiency
- 34% ▼ -5.00%
- Reading proficiency
- 53% ▼ -8.00%
- Median HH income
- $59,765
- Composite
- 38.26/100
- National rank
- #4240
- State rank
- #275 of 539 in PA
Livability — Wheatfield
No livability data for this city. (Only ~50 U.S. cities are tracked.)
Census & demographics
- Population (ZIP)
- 4,384
Population outlook (Perry County) Hauer SSP2
- Today (2025)
- 44,250 people
- By 2030
- 42,862 · -3.1%
- By 2040
- 39,574 · -10.6%
- By 2050
- 36,001 · -18.6%
- By 2075
- 27,991 · -36.7%
- By 2100
- 20,936 · -52.7%
Race, ethnicity, and origin ACS 2023
- Neighborhood character
- Predominantly White (90%)
- Race & ethnicity
- White 90% Two or more races 7% Hispanic / Latino 3% Black 1%
- Common ancestry
- Polish 5% Romanian 3% Iranian 3%
- Foreign-born
- 1% · Canada
- Languages at home
- 96% English-only · Spanish 2% German/W. Germanic 1%
Political lean MEDSL · Perry
- 2024 margin
- Solid R (+49.3) · D 24.8% · R 74.1% · Other 1.0%
- 2008→2024 swing
- -15.6pp toward R · 2008: -33.7pp · 2024: -49.3pp
- All cycles
- 2024: R+49.3 2020: R+50.1 2016: R+51.9 2012: R+38.8 2008: R+33.7
Not yet ingested
- Civics
- —
Market trends
- HPI YoY
- ▼ -27.07%
- Current HPI
- 157.819
- Rent YoY
- —
- Metro
- —
- State GDP YoY
- ▲ 1.68%
- F500 in state
- 34
Industry mix (Fortune 500 HQ in PA)
| Industry | F500 HQs | Revenue |
|---|---|---|
| Healthcare | 2 | $309B |
|
||
| Insurance | 2 | $27B |
|
||
| Telecommunications / Media | 1 | $124B |
|
||
| Industrial Distribution | 1 | $22B |
|
||
| Financial Services | 1 | $20B |
|
||
| Chemicals / Materials | 1 | $18B |
|
||
Price history
+115.4% since first listed9 events — show timeline
- 2026-05-08 Listed $249,900 BRIGHT MLS
- 2015-10-29 Sold (Public Records) $140,000 Public Records
- 2012-03-27 Listing Removed — BRIGHT MLS
- 2011-09-27 Listed $149,900 BRIGHT MLS
- 2011-04-04 Sold (MLS) $57,000 BRIGHT MLS
- 2011-03-20 Listing Removed — BRIGHT MLS
- 2010-08-26 Listed $59,900 BRIGHT MLS
- 2003-01-21 Sold (Public Records) $139,900 Public Records
- 1998-10-29 Sold (Public Records) $116,000 Public Records
Property tax history
+0.1%/yrLatest (2026): $2,924 · -12.2% YoY. Source: county tax records.
Cash-flow waterfall
monthlySold comps — $/sqft
last 12 mo · ≤1 miLoading sold comps…